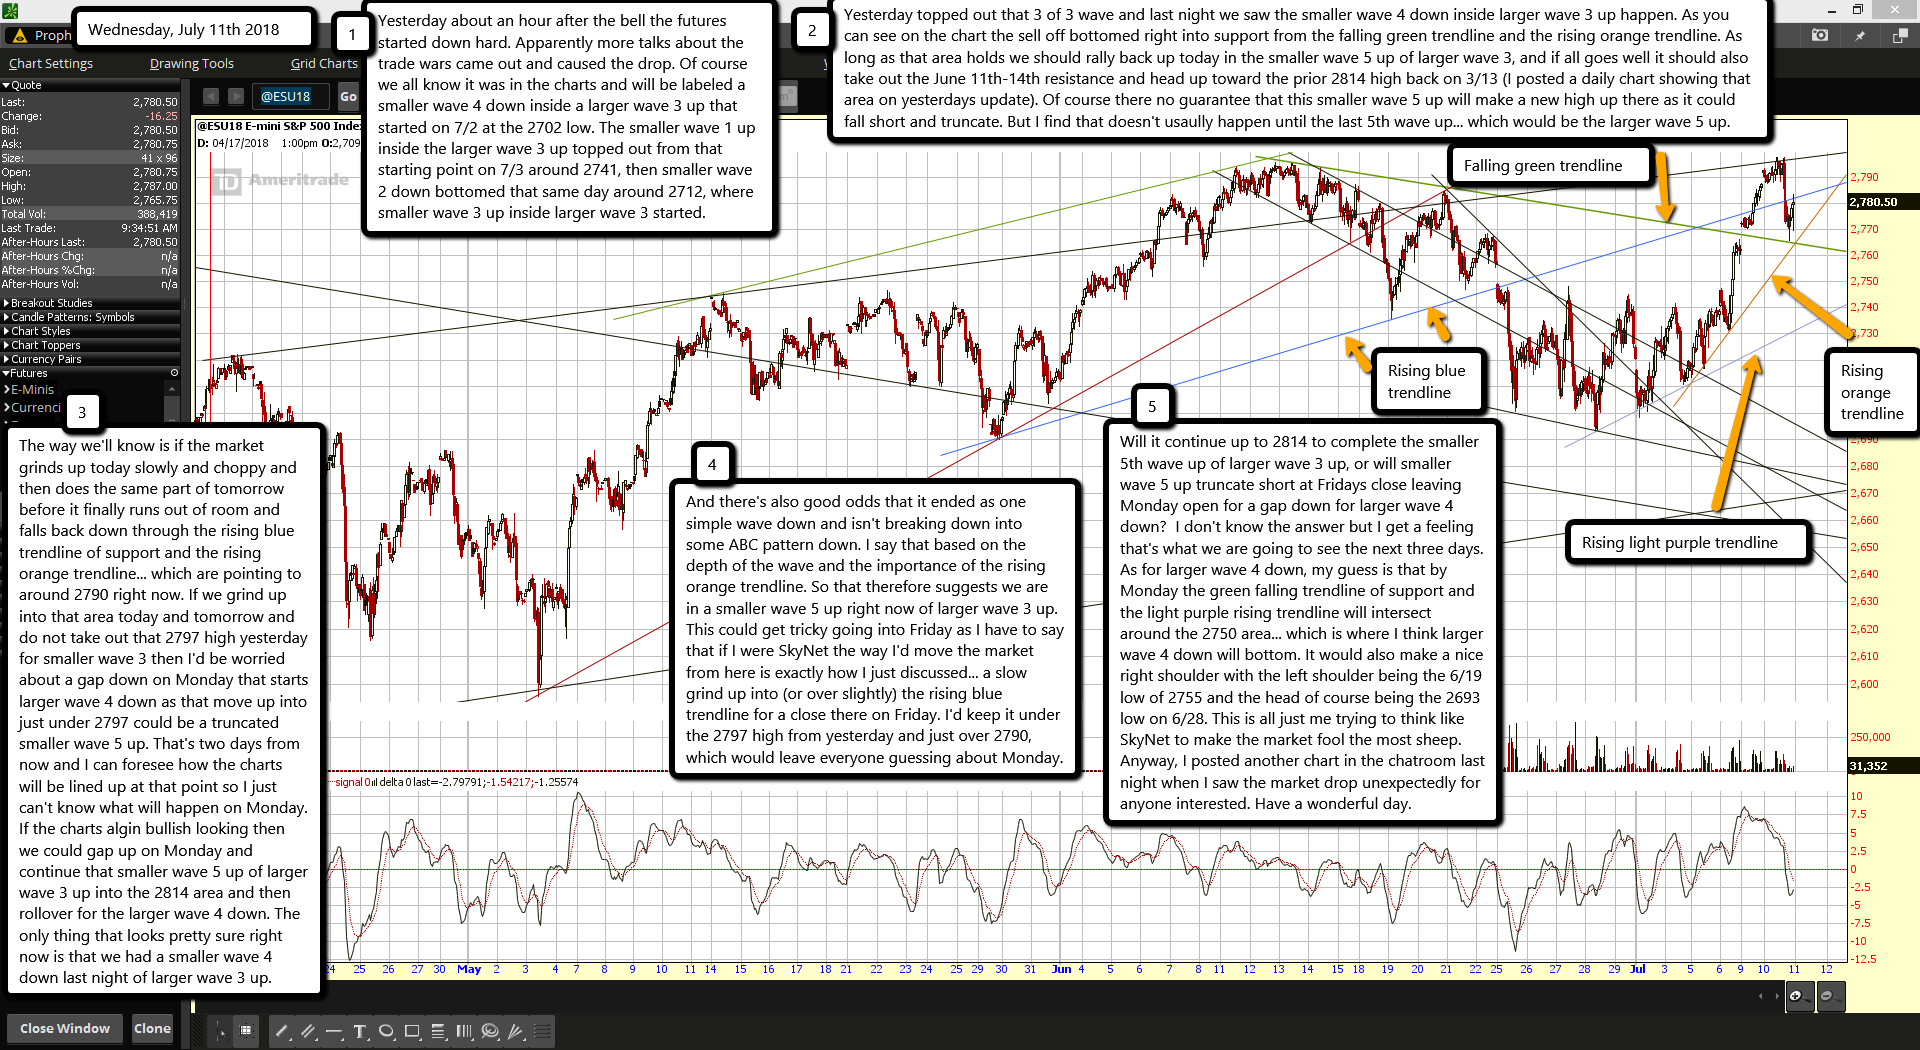
Yesterday about an hour after the bell the futures started down hard. Apparently more talks about the trade wars came out and caused the drop. Of course we all know it was in the charts and will be labeled a smaller wave 4 down inside a larger wave 3 up that started on 7/2 at the 2702 low. The smaller wave 1 up inside the larger wave 3 up topped out from that starting point on 7/3 around 2741, then smaller wave 2 down bottomed that same day around 2712, where smaller wave 3 up inside larger wave 3 started.
Yesterday topped out that 3 of 3 wave and last night we saw the smaller wave 4 down inside larger wave 3 up happen. As you can see on the chart the sell off bottomed right into support from the falling green trendline and the rising orange trendline. As long as that area holds we should rally back up today in the smaller wave 5 up of larger wave 3, and if all goes well it should also take out the June 11th-14th resistance and head up toward the prior 2814 high back on 3/13 (I posted a daily chart showing that area on yesterdays update). Of course there no guarantee that this smaller wave 5 up will make a new high up there as it could fall short and truncate. But I find that doesn't usaully happen until the last 5th wave up... which would be the larger wave 5 up.
The way we'll know is if the market grinds up today slowly and choppy and then does the same part of tomorrow before it finally runs out of room and falls back down through the rising blue trendline of support and the rising orange trendline... which are pointing to around 2790 right now. If we grind up into that area today and tomorrow and do not take out that 2797 high yesterday for smaller wave 3 then I'd be worried about a gap down on Monday that starts larger wave 4 down as that move up into just under 2797 could be a truncated smaller wave 5 up. That's two days from now and I can foresee how the charts will be lined up at that point so I just can't know what will happen on Monday. If the charts algin bullish looking then we could gap up on Monday and continue that smaller wave 5 up of larger wave 3 up into the 2814 area and then rollover for the larger wave 4 down. The only thing that looks pretty sure right now is that we had a smaller wave 4 down last night of larger wave 3 up.
And there's also good odds that it ended as one simple wave down and isn't breaking down into some ABC pattern down. I say that based on the depth of the wave and the importance of the rising orange trendline. So that therefore suggests we are in a smaller wave 5 up right now of larger wave 3 up. This could get tricky going into Friday as I have to say that if I were SkyNet the way I'd move the market from here is exactly how I just discussed... a slow grind up into (or over slightly) the rising blue trendline for a close there on Friday. I'd keep it under the 2797 high from yesterday and just over 2790, which would leave everyone guessing about Monday.
Will it continue up to 2814 to complete the smaller 5th wave up of larger wave 3 up, or will smaller wave 5 up truncate short at Fridays close leaving Monday open for a gap down for larger wave 4 down? I don't know the answer but I get a feeling that's what we are going to see the next three days. As for larger wave 4 down, my guess is that by Monday the green falling trendline of support and the light purple rising trendline will intersect around the 2750 area... which is where I think larger wave 4 down will bottom. It would also make a nice right shoulder with the left shoulder being the 6/19 low of 2755 and the head of course being the 2693 low on 6/28. This is all just me trying to think like SkyNet to make the market fool the most sheep. Anyway, I posted another chart in the chatroom last night when I saw the market drop unexpectedly for anyone interested. Have a wonderful day.


