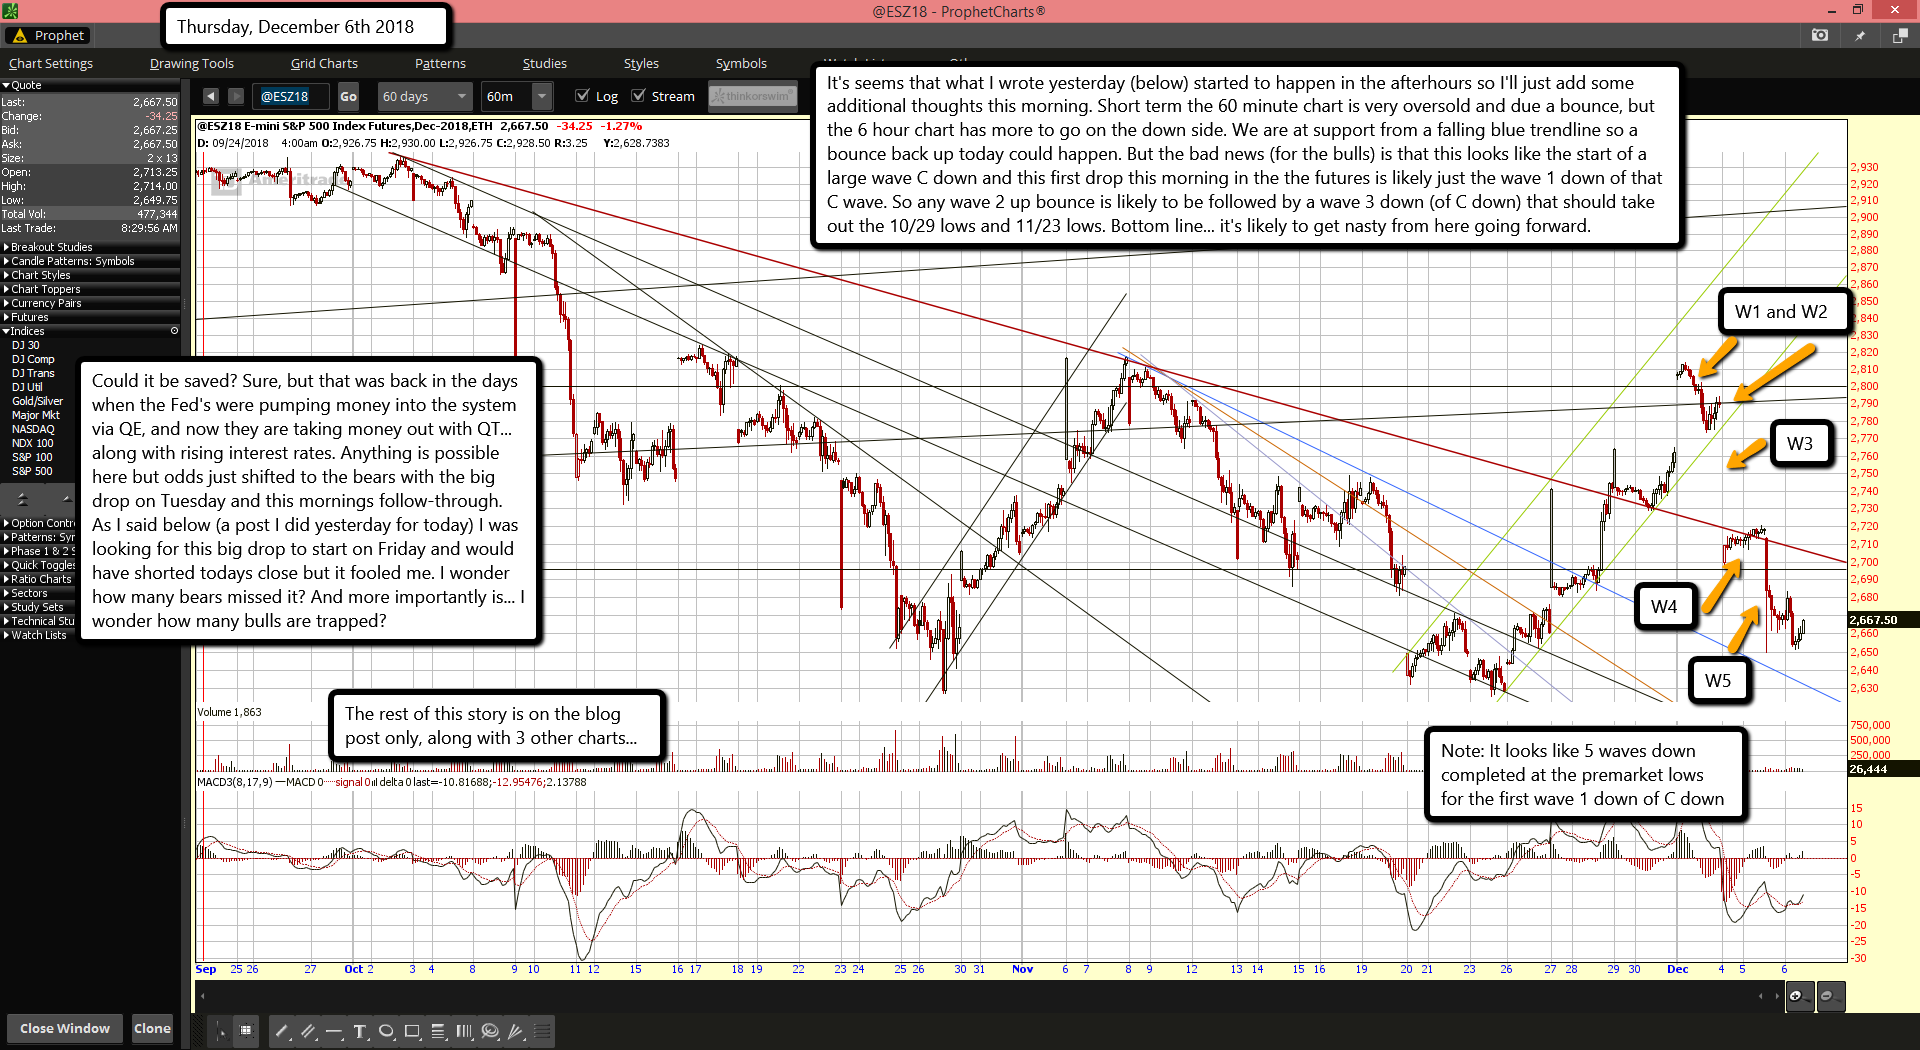
It's seems that what I wrote yesterday (below) started to happen in the afterhours so I'll just add some additional thoughts this morning. Short term the 60 minute chart is very oversold and due a bounce, but the 6 hour chart has more to go on the down side. We are at support from a falling blue trendline so a bounce back up today could happen. But the bad news (for the bulls) is that this looks like the start of a large wave C down and this first drop this morning in the the futures is likely just the wave 1 down of that C wave. So any wave 2 up bounce is likely to be followed by a wave 3 down (of C down) that should take out the 10/29 lows and 11/23 lows. Bottom line... it's likely to get nasty from here going forward.
Could it be saved? Sure, but that was back in the days when the Fed's were pumping money into the system via QE, and now they are taking money out with QT... along with rising interest rates. Anything is possible here but odds just shifted to the bears with the big drop on Tuesday and this mornings follow-through. As I said below (a post I did yesterday for today) I was looking for this big drop to start on Friday and would have shorted todays close but it fooled me. I wonder how many bears missed it? And more importantly is... I wonder how many bulls are trapped?
Everything below was written Wednesday afternoon (before the drop in the futures)...
Well, got my pullback to the 2700-2720 zone that I was expecting by next week... except it all happened in one day! Crazy market for sure! I was hoping they would hold the market up until Thursday and then tank it but that wasn't to be and instead it dropped 90 points on the SPX in just one day. It's like a wild wild west show in the market right now. So, where do we go from here you ask?
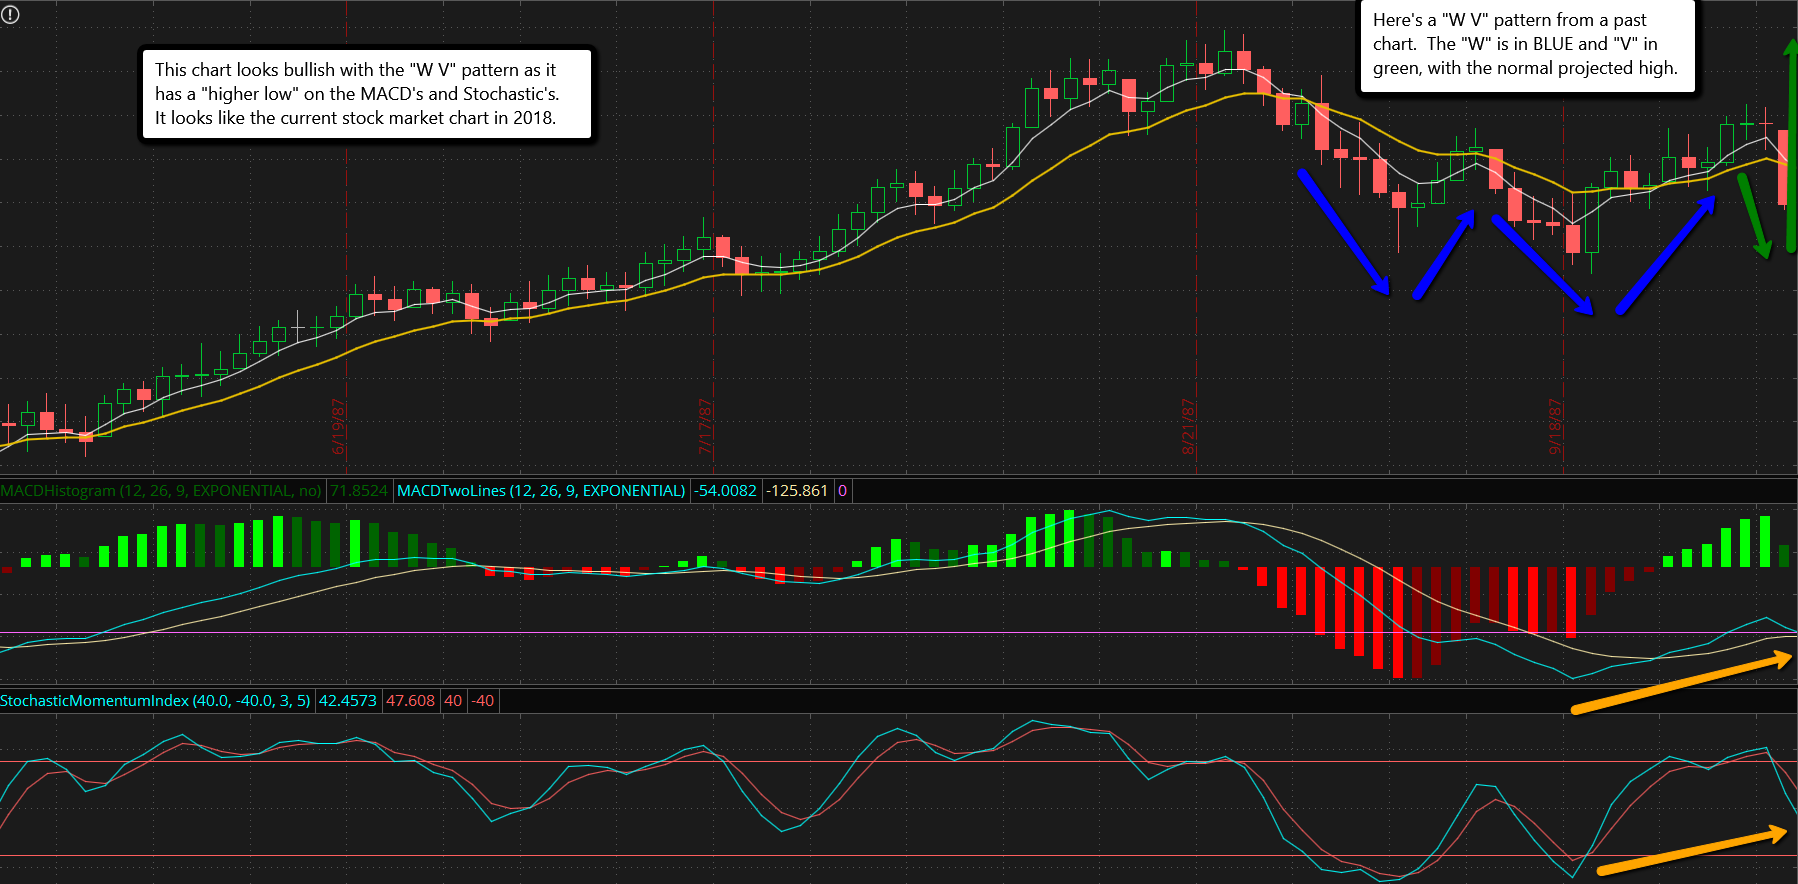
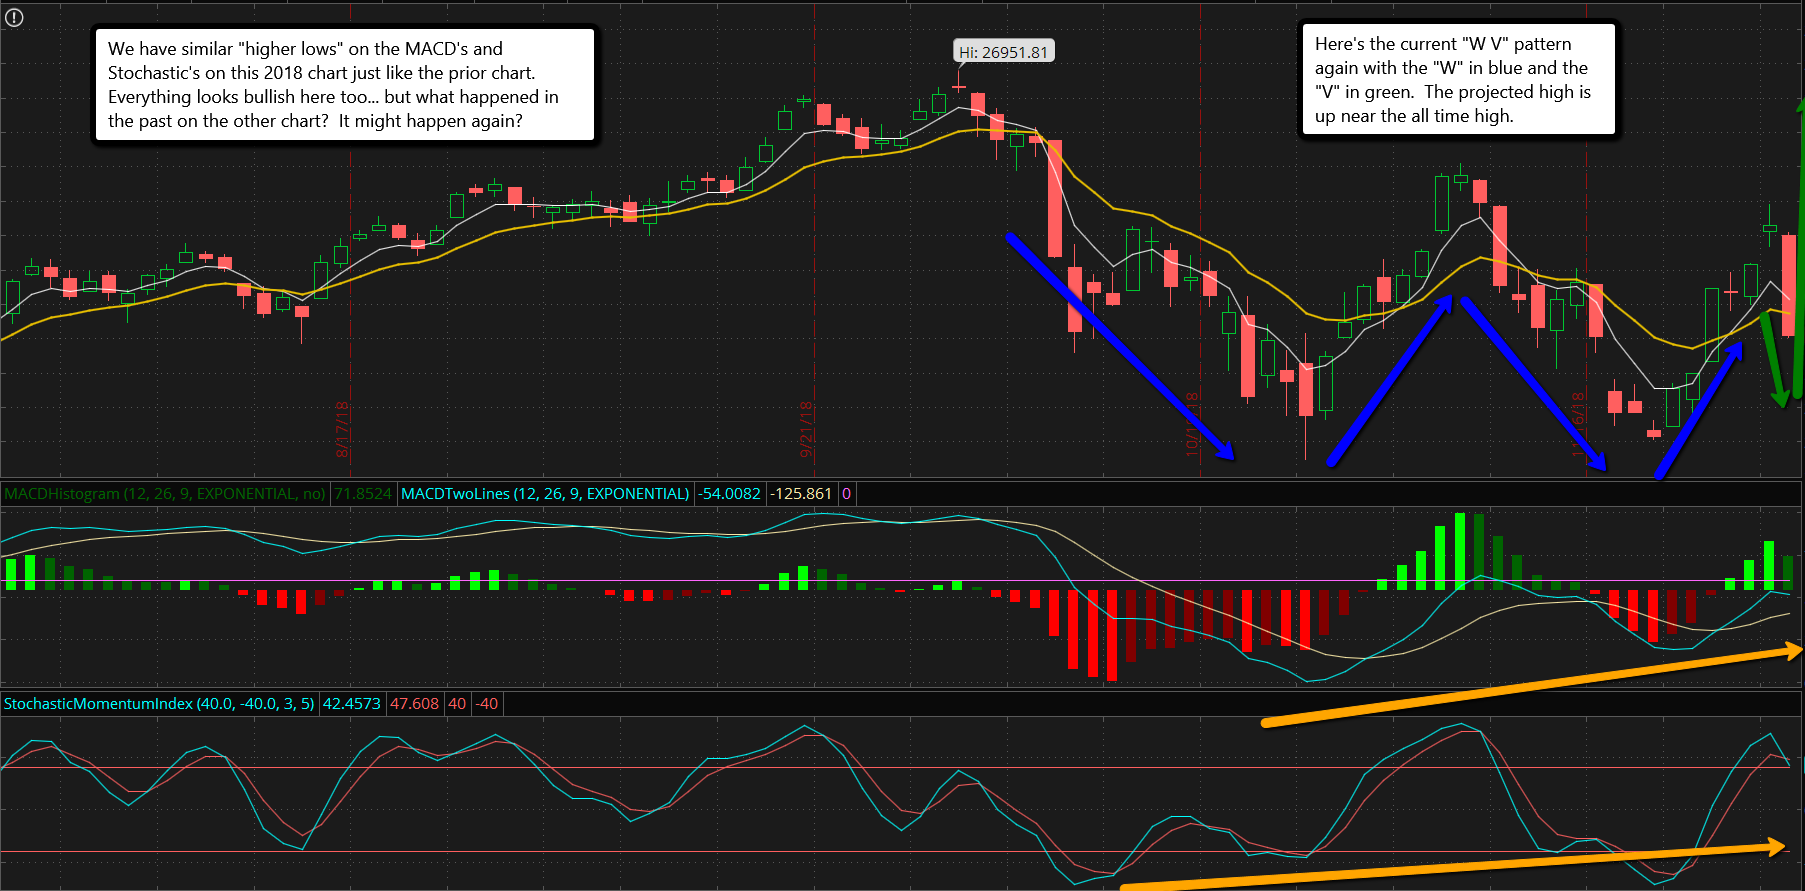
From a technical point of view we have the makings of a nice "W V" pattern with the "W" already formed with the lows on 10/29 and 11/23, and the "V" appears half formed now with the large drop on Tuesday being the left side of it. This "W V" pattern is a bullish pattern and is the opposite of the "M A" pattern that is bearish. What normally happens is once the bottom of the "V" is put in (might already be put in at the low on Tuesday?) the right side of the "V" goes up and takes out the horizontal top area and basically goes the same distance up from that level as it went down.
Meaning that if look at the horizontal top levels of 2823 on 10/17, then 2817 on 11/07, and 2814 on 12/03 you have around 2819 or so as a middle price range. So you take that and subtract the low of the "V" (right now it's at 2696 but it's not confirmed yet as the low of the "V") from that top and you get 123 points or so (2819-2696). Ok, now add that to the 2819 middle area to make the horizontal top of the "W V" pattern to get your upside forecasted target zone of the right side of th "V", or 2942 (2819+123).
That is your upside target if this plays out like a normal "W V" pattern... and it most cases they do indeed play out. We have the normal seasonality pattern of the Santa rally coming soon, and the bullish December month that rare has even seen a crash in it. So what's to worry about then you ask? Just go long and everything will be fine... right? Yeah, the bulls hope so. I can't blame anyone for buying this pullback as it looks "textbook" perfect to me. In fact I'll be looking at a long if we go down small today and close red a little on the DOW (I think it leads the market) with a decent "bottoming tail" on it. Short term charts will support that too as they are quite oversold from Tuesdays 90 point drop on the SPX.
Chart ONE:
Chart TWO:
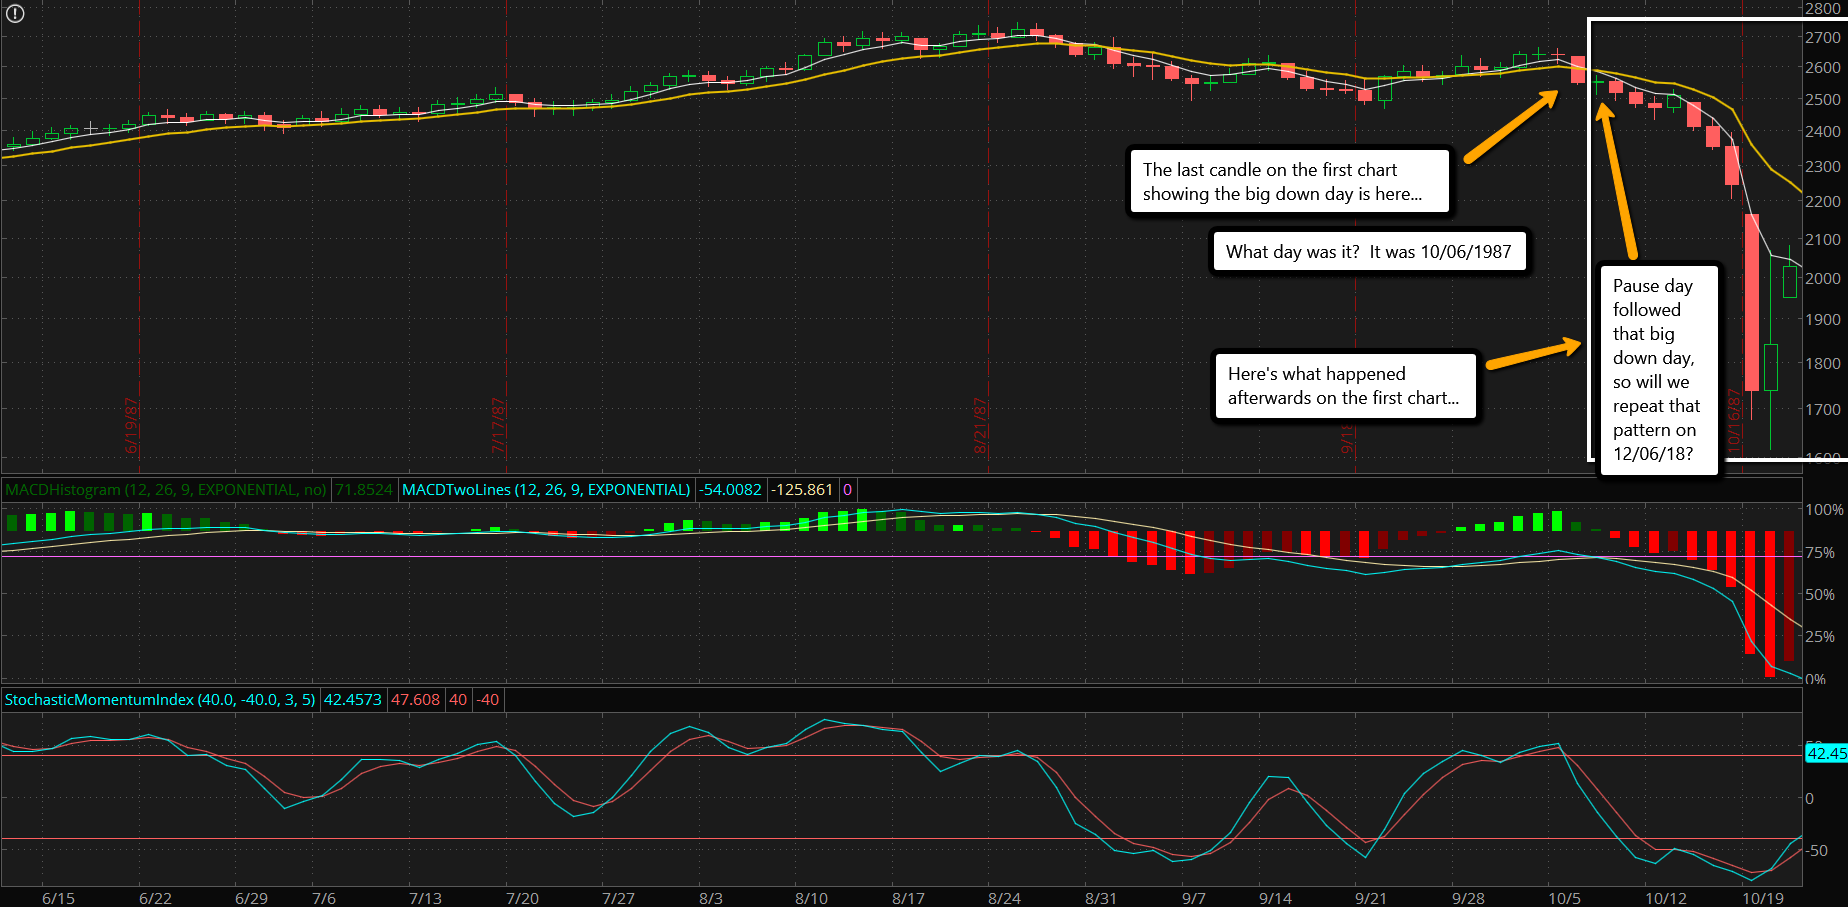
Chart Three:
So while the current pattern doesn't have to follow the 1987 pattern day by day it could continue, and if it does then a slightly green close is expected Thursday with a long bottoming tail and long topping tail. That might suggest a rally up to 2740-2760 SPX intraday and down to 2650-2670 on the downside.
Now afterhours the futures tanked to 2650 so that part is possible... let's see what today brings. While most all of the "MA" bearish patterns and "WV" bullish patterns work and play out normally... what if this one doesn't? Be prepared for a lot of pain for the bulls. Maybe one of the FP's I have will play out to the downside afterall?


Fantasy! WILL TEST JAN LOWS AND WONT COME BACK UNTIL THE NAZ GOES UNDER 7000!
Sorry for the late reply. I spend all day in the chatroom and don’t usually get an comments on posts. But yeah, you were right on testing the January lows.