
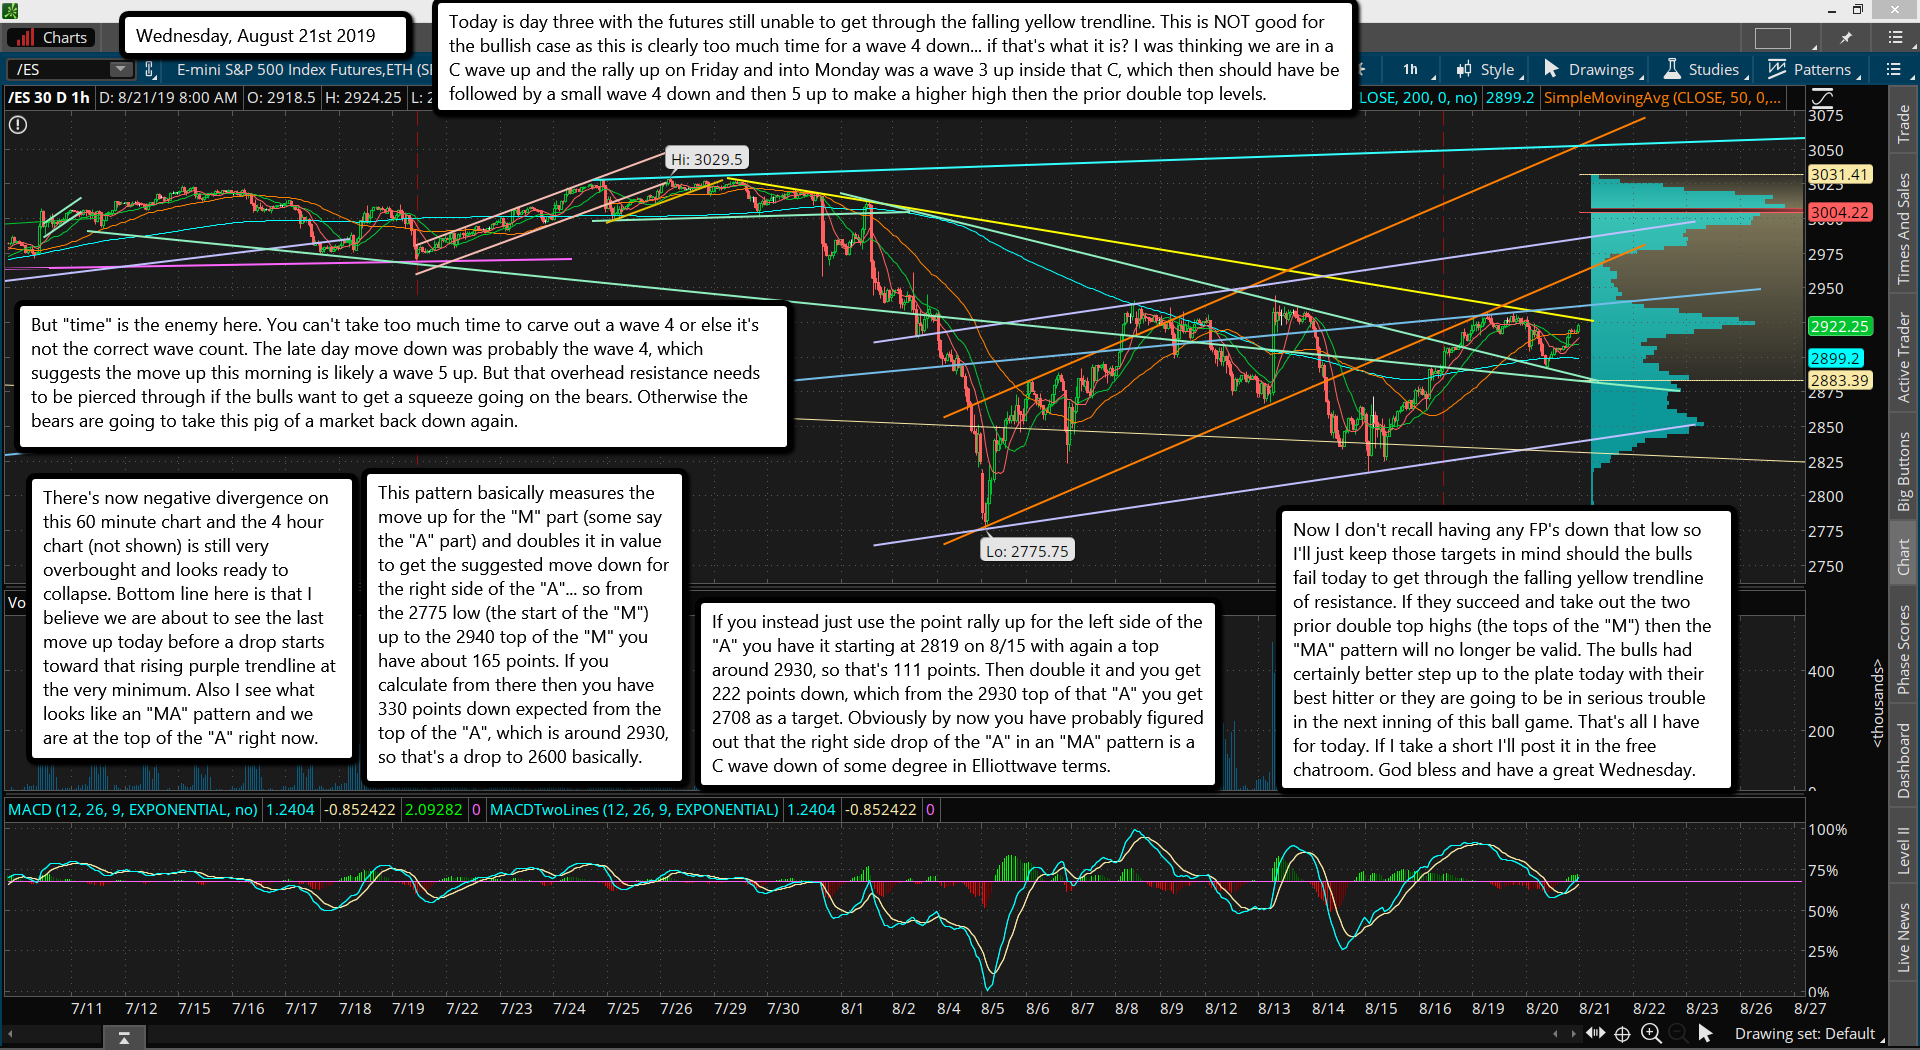
Today is day three with the futures still unable to get through the falling yellow trendline. This is NOT good for the bullish case as this is clearly too much time for a wave 4 down... if that's what it is? I was thinking we are in a C wave up and the rally up on Friday and into Monday was a wave 3 up inside that C, which then should have be followed by a small wave 4 down and then 5 up to make a higher high then the prior double top levels.
But "time" is the enemy here. You can't take too much time to carve out a wave 4 or else it's not the correct wave count. The late day move down was probably the wave 4, which suggests the move up this morning is likely a wave 5 up. But that overhead resistance needs to be pierced through if the bulls want to get a squeeze going on the bears. Otherwise the bears are going to take this pig of a market back down again.
There's now negative divergence on this 60 minute chart and the 4 hour chart (not shown) is still very overbought and looks ready to collapse. Bottom line here is that I believe we are about to see the last move up today before a drop starts toward that rising purple trendline at the very minimum. Also I see what looks like an "MA" pattern and we are at the top of the "A" right now.
This pattern basically measures the move up for the "M" part (some say the "A" part) and doubles it in value to get the suggested move down for the right side of the "A"... so from the 2775 low (the start of the "M") up to the 2940 top of the "M" you have about 165 points. If you calculate from there then you have 330 points down expected from the top of the "A", which is around 2930, so that's a drop to 2600 basically.
If you instead just use the point rally up for the left side of the "A" you have it starting at 2819 on 8/15 with again a top around 2930, so that's 111 points. Then double it and you get 222 points down, which from the 2930 top of that "A" you get 2708 as a target. Obviously by now you have probably figured out that the right side drop of the "A" in an "MA" pattern is a C wave down of some degree in Elliottwave terms.
Now I don't recall having any FP's down that low so I'll just keep those targets in mind should the bulls fail today to get through the falling yellow trendline of resistance. If they succeed and take out the two prior double top highs (the tops of the "M") then the "MA" pattern will no longer be valid. The bulls had certainly better step up to the plate today with their best hitter or they are going to be in serious trouble in the next inning of this ball game. That's all I have for today. If I take a short I'll post it in the free chatroom. God bless and have a great Wednesday.

