Last week we got close to the 5080-5090 target zone with a high of 5066, and then the pullback started. I'm still not sure which of my wave counts we are on but I lean toward the Alternative Bullish Wave Count, which suggests the smallest pullback of all of them.
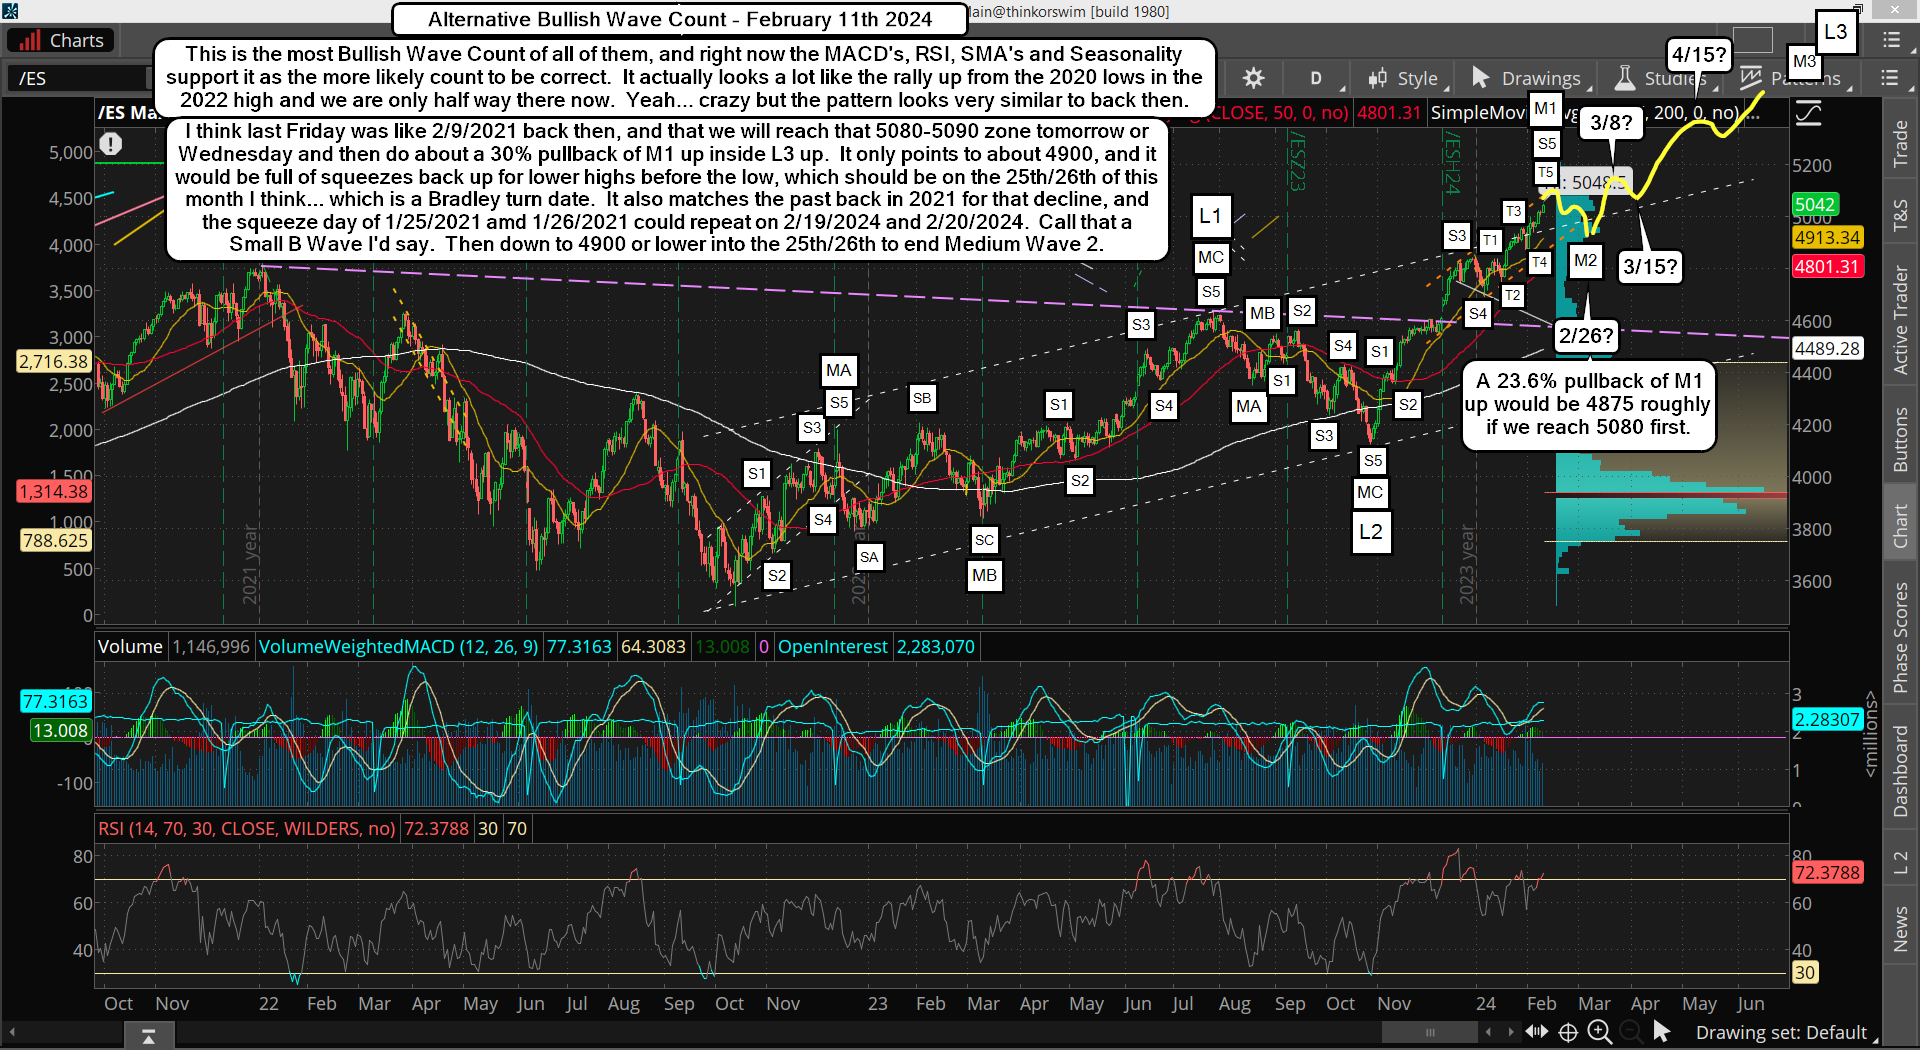
That pullback came last Tuesday after the CPI number wasn't liked by the market, and it "might" have been the end of it, but last Fridays failure to breakout to another new all time high suggest that move down may not be finished and that it will unfold in an ABC pattern. Here's last weeks chart of the Alternative Bullish Wave Count last Monday...
As you can see on that chart I showed M1 to M2 as an ABC down into February 26th, which I think is still very likely to play out. Bulls might try another time to breakout to another higher high early this week but I think it doesn't happen and instead we pullback again and bottom on the 26th to end the pullback for M2 down.
What I don't know is how low that pullback will be? The move down last Tuesday reached a low of 4963 on the ES, so if this is an ABC move down then it should take out that low by some amount.
However, there's nothing to rule out a higher low or a double bottom. The market loves to fool everyone so I just have to focus on the date of the 26th for the low (possibly Sunday the 25th in the futures?). Of course if it's a really nasty drop of 7-10%, likely I've talked about in the past as "possible", then it will be a super strong buy that will take us to new all time highs again very quickly (Low odds in my opinion).
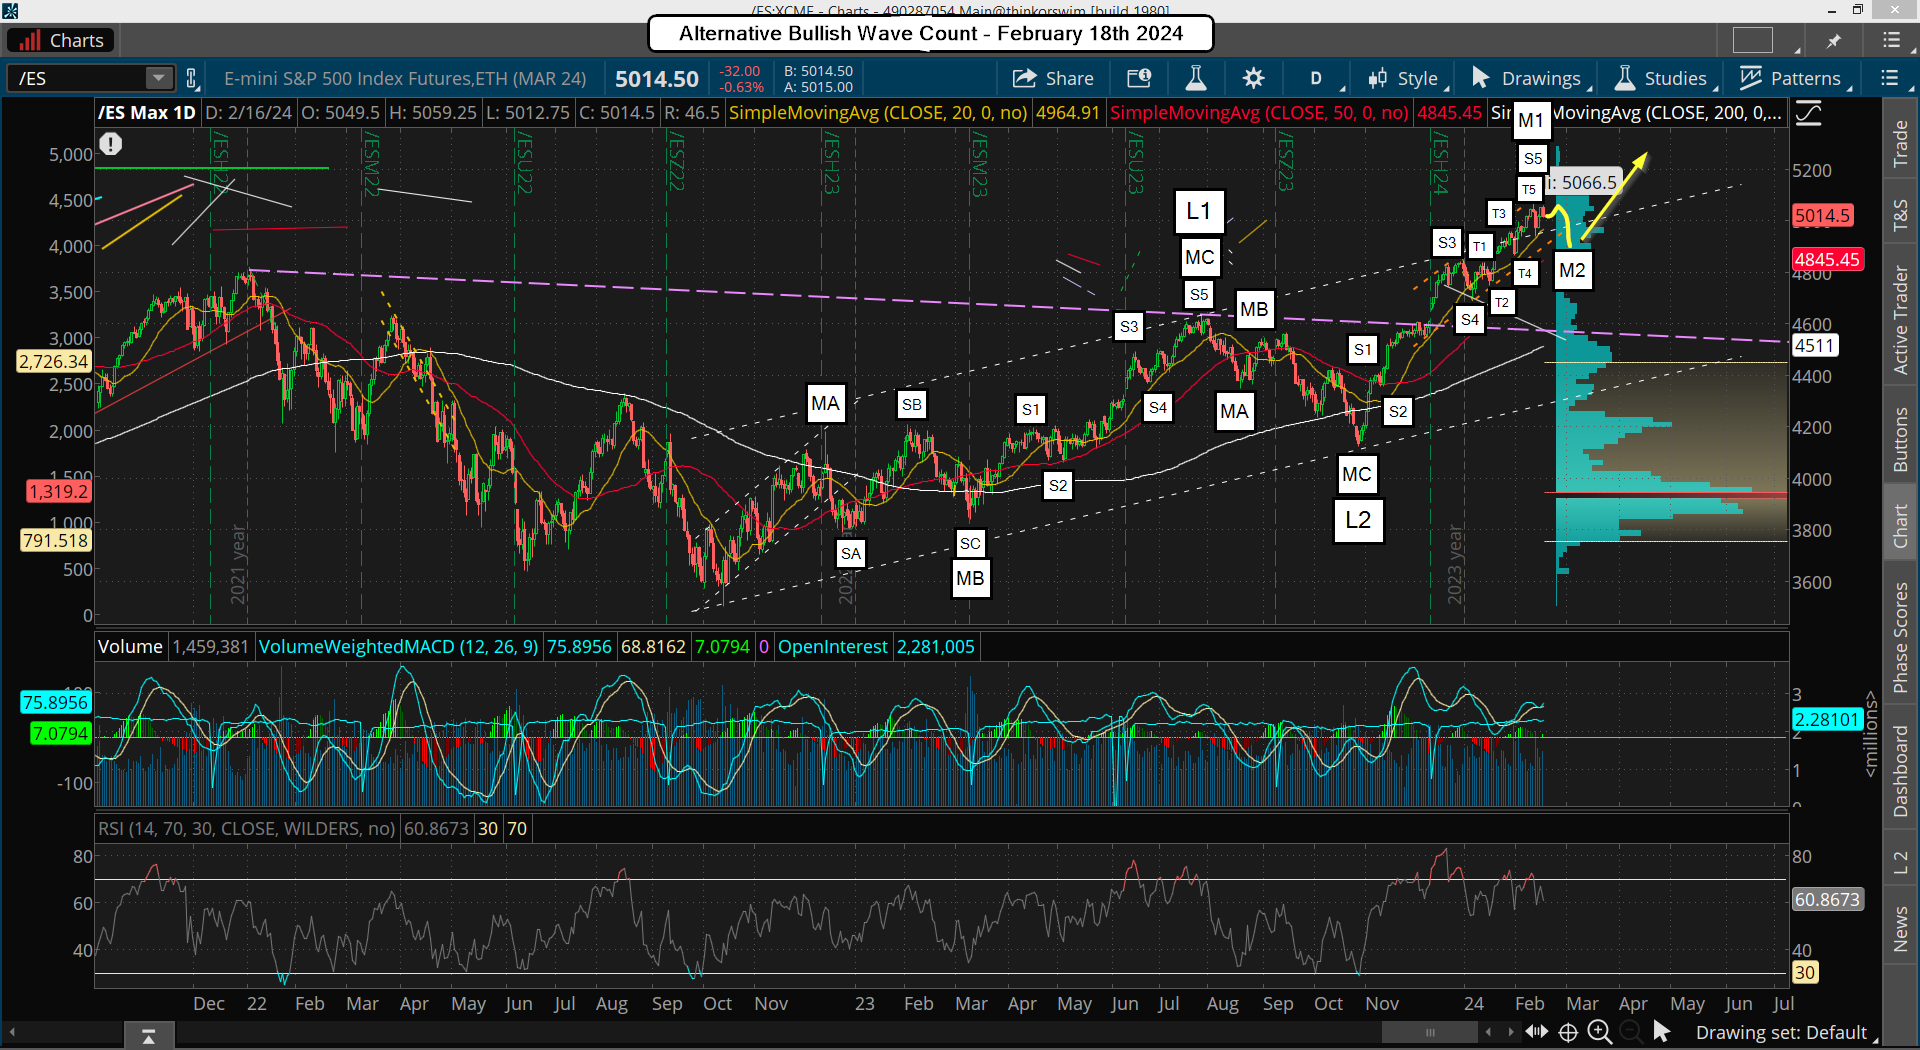
If that happens we could rally all summer and reach 6000, who knows for sure? But if it's a smaller pullback (4850-4900?) then the move up to the new all time high might only last into next month and only reach 5300-5400? Below is the updated Alternative Bullish Wave Count.
Now I will bring back the First Bullish Wave Count, or the Second Bullish Wave Count if the pullback turns into something much larger then expected, but for now this chart is what I'm focused on. On that chart you can see that I have the coming pullback into the 26th as making a lower low then last Tuesday, which would a nice an clean ABC down for M2... but if that does not happen then I'll relabel the count as M1 having NOT completed last Monday at the 5066 high.
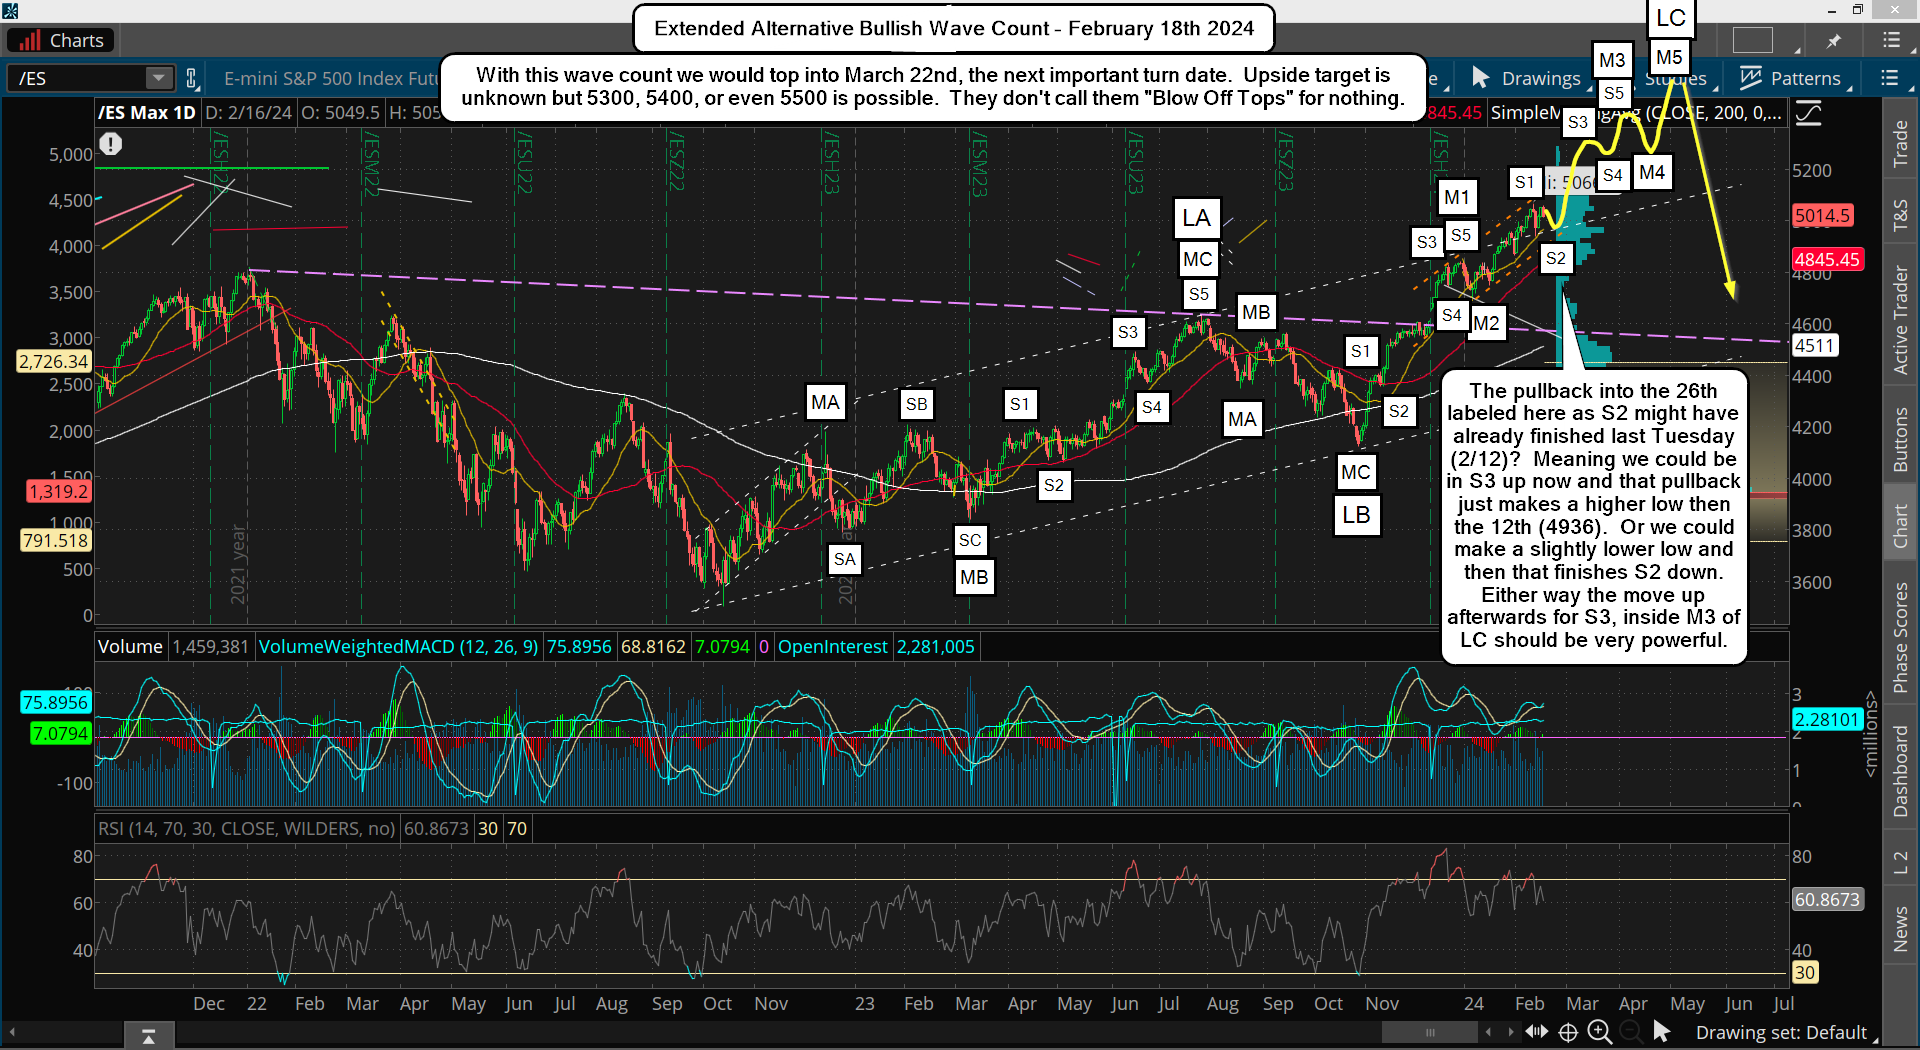
It will mean that the Small and Tiny waves leading up into the high from L2 will we be extending and sub diving further. I do favor that happening actually as there's just something about the positions I've labeled those Small and Tiny waves at that just doesn't look right. Below is a chart of that Extended Alternative Bullish Wave Count exploring that possibility.
In this chart you'll see I relabeled the Large waves to ABC's instead of 5 wave patterns. I did this because when I looked back in the past it seems that all the recent rallies (last 10+ years) up from important lows unfolded in an ABC pattern. The C wave up always had 5 waves inside, which is normal of course but discovering that the larger waves were in a 3 wave pattern was a shock to me.
I know that Elliottwave talks about 5 waves up and 3 waves down but the facts tell me otherwise. So I'm just using what I see as "factual" from the past to forecast the future, that's why I labeled this chart with an ABC up for the Large waves.
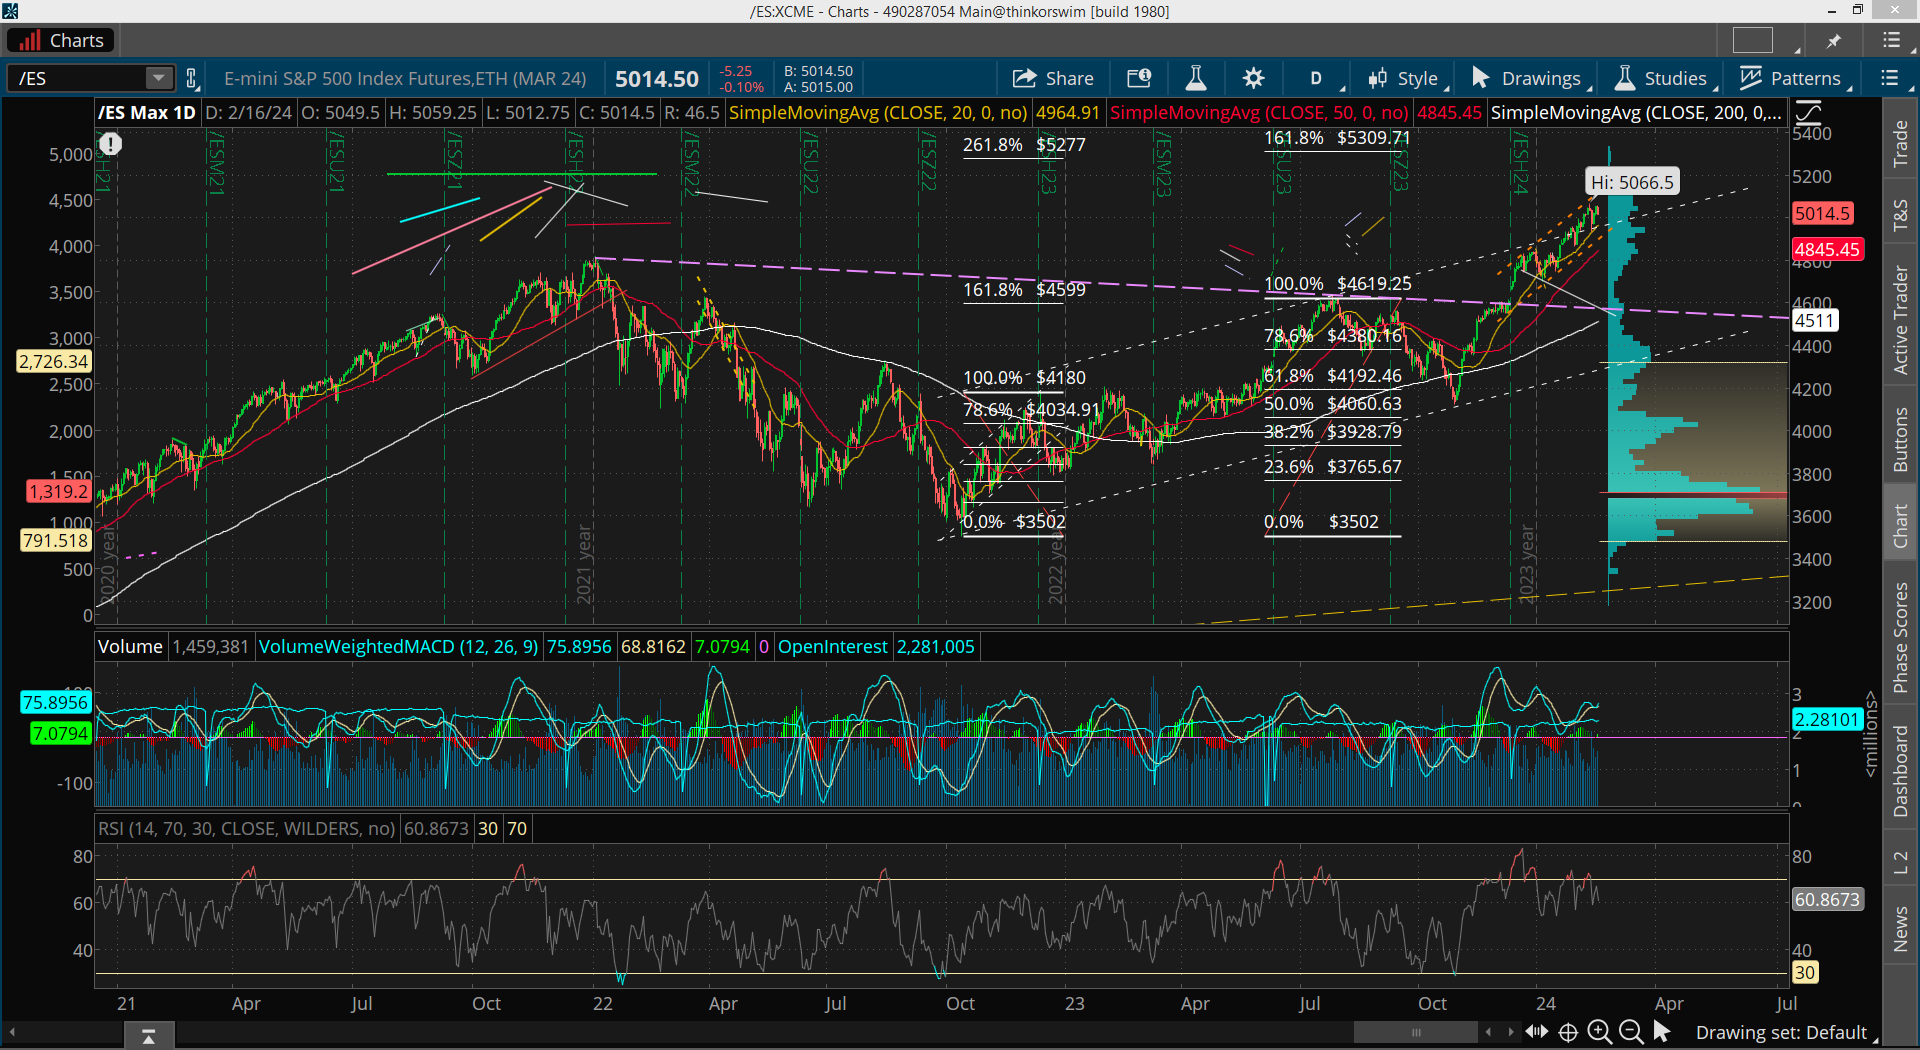
I also noticed that many (most) of the prior patterns over the last 20 years, that did have this ABC up, all rallied about the same amount in percentage terms for that C wave. What I mean is that when I measure the start of the rally up from the very bottom to the high of the A wave as 100% the point where 161.8% is located at seems to be where the next important top is at, which is the end of the C wave up. Here's a chart of it...
The first rally up from the 3502 in October of 2022 topped at 4180, which was the A wave for that move. The 161.8% mark of that rally was 4599, and that was the next important high area on 7/31/2023, with an actual high of 4619.25... and that's super close in my opinion.
On my Alternative Bullish Wave Count chart (and Extended) I labeled that A wave as the top of Medium Wave A, and it foretold the top for Medium Wave C extremely well. Now, that ABC created a Large Wave A (or Large Wave 1, but again, my research says it's an A wave), which when you look at the 161.8% mark of it you get a projection of 5309.71 for the high of Large Wave C.
So, odds are VERY STRONG in my opinion that we reach that level before any rally strong pullback (like 7-10%) happens. I think we reach it into the March 22nd turn date, (after a small pullback into the February 26th turn date first).
After that pullback I just don't know? We could do another leg up to 6000 or that could have ended it all and we go down the rest of this year. Hard to say right now but let's not put the cart before the horse here. It's better to just get the next big moves correct and worry about every other move when it's closer.
In fact, when I looked at many prior patterns in the past they were mixed on whether or not the final high was in or not. Sometimes it was the final high, but most of the times it wasn't. Let's look at those charts now.
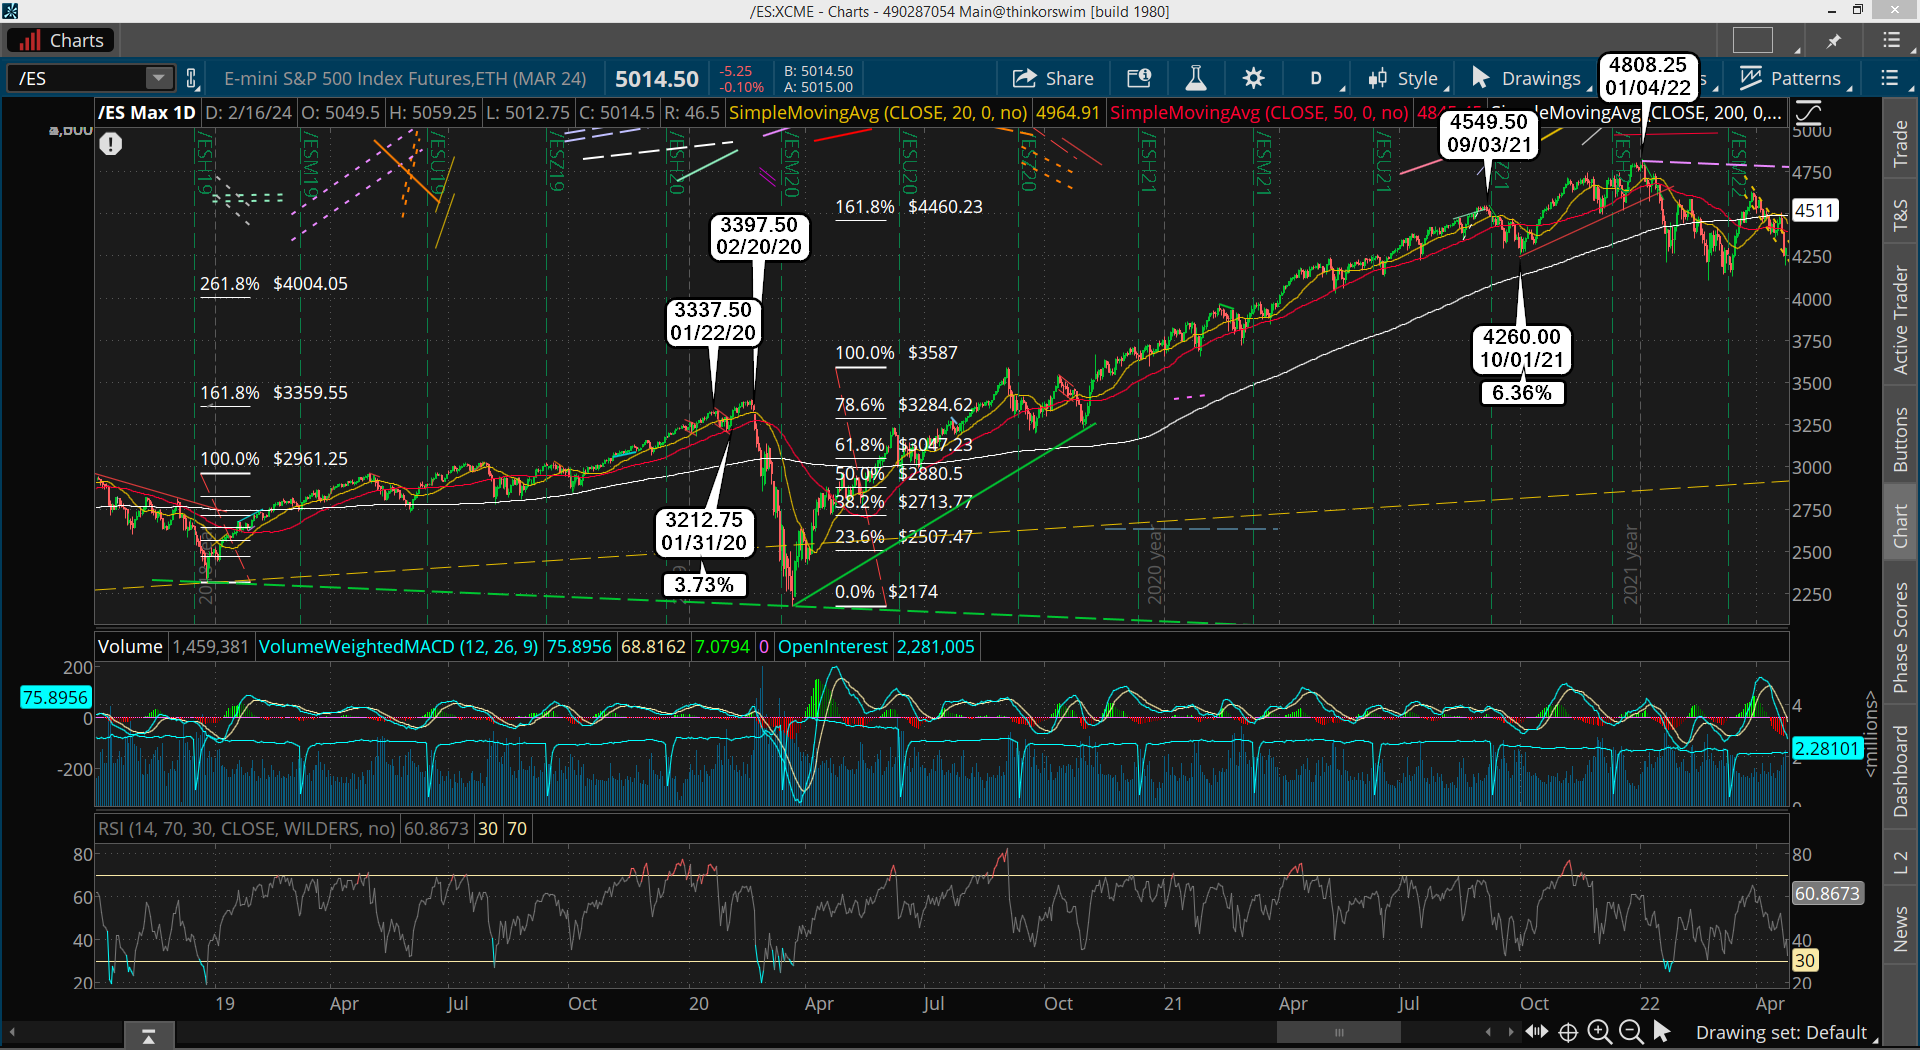
Above we have the 2020 and 2022 chart to study. On the 2022 part I've marked the first major rally up (the Large A wave) as ending at the 3587 high. Then when I do the Fibonacci on it the 161.8% level points to 4460.23, which was NOT the last high. The market fell shy a little at 4549 and then did a 6.36% pullback before another strong and final rally up to the 4808.25 high.
That could be what we see happen this coming March 22nd, where we reach just shy of the 5309.71 projected target and from there we start a 5-10% pullback. Then back up into April and May for some even higher high, and possibly the final one?
Looking at the 2020 section of the chart you can see the same thing basically, a rally up into the 161.8% area, which stopped shy back then to at 3337.50 instead of the 3359.55 target. A pullback of only 3.73% then and one more higher high followed.
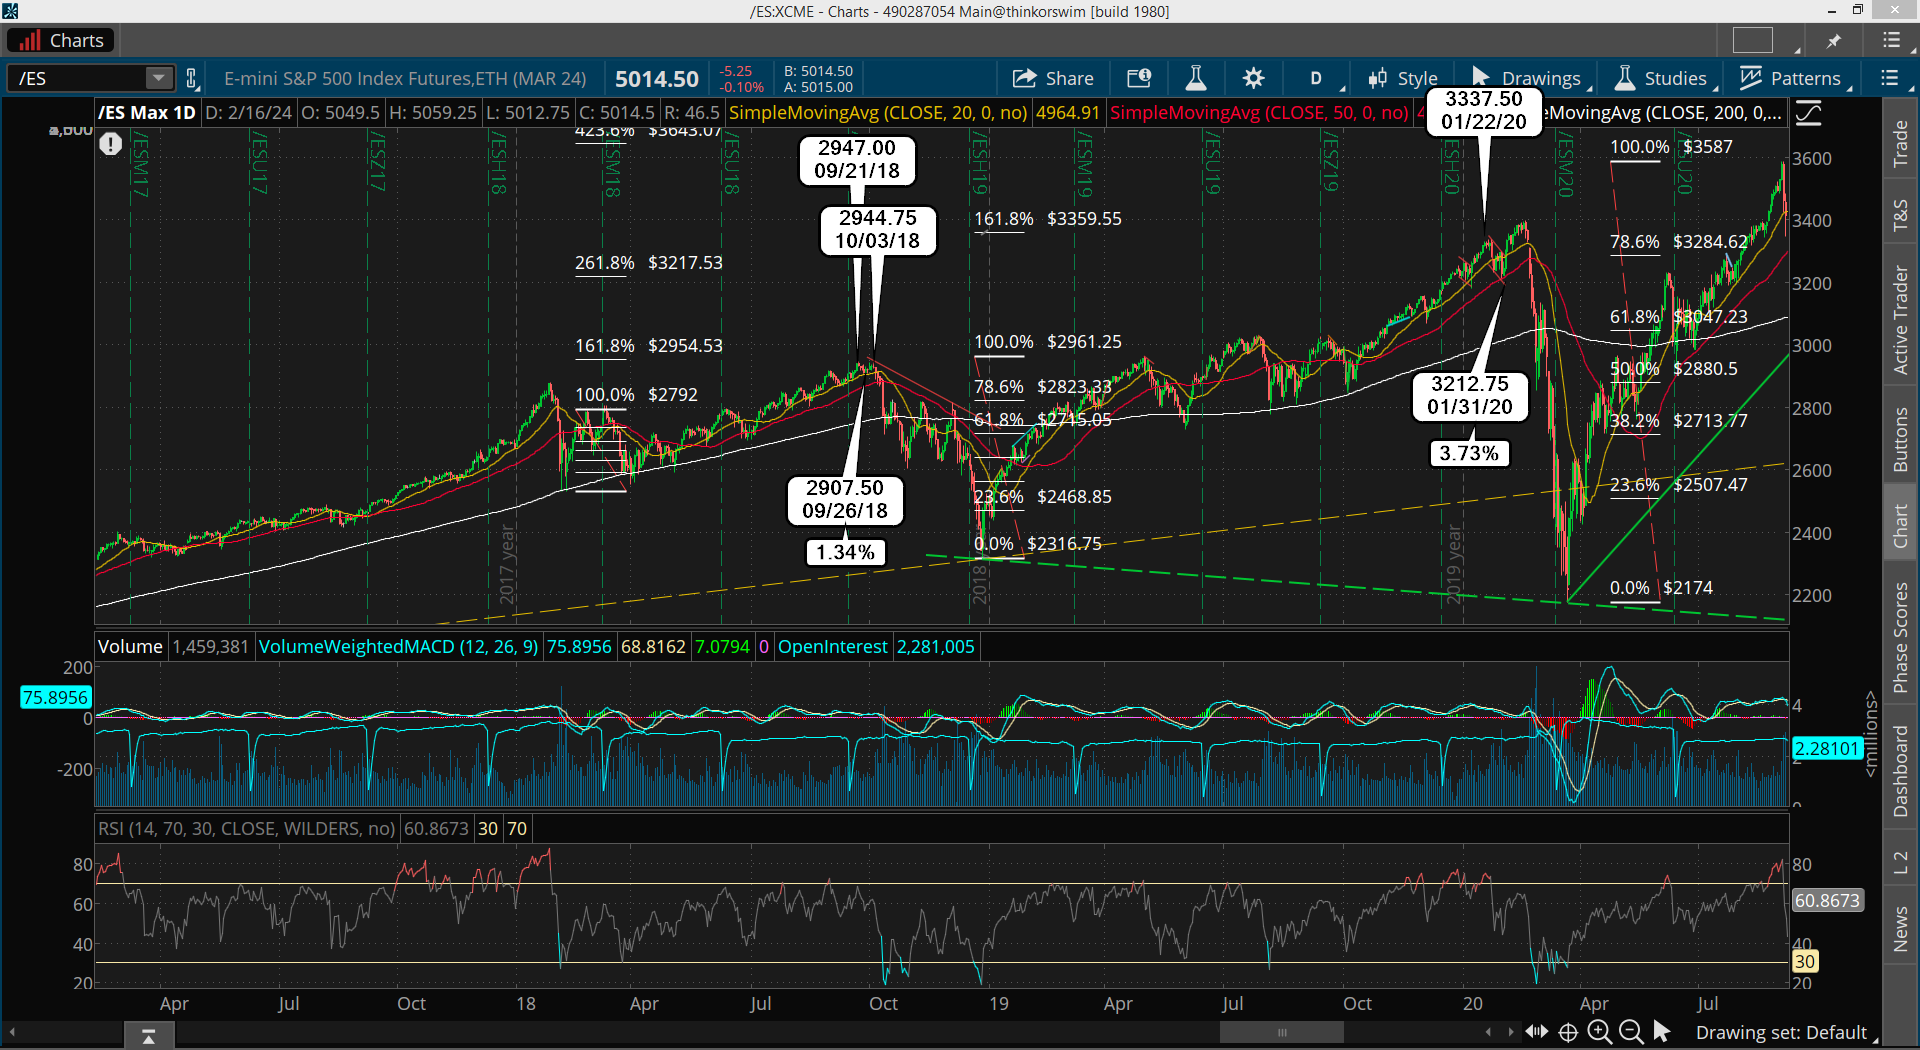
On the next chart (above) I cover the same 2020 period but also the 2018 chart. You can see that back in the first quarter of 2018 there was an A wave up that topped at 2792, which gave a projection of 2954.53 for the 161.8% target high. The market rallied all year until it almost reached it on September 21st, pulled back just 1.34% and tried one last time to reach it but couldn't.
What stands out to me is that the market doesn't seem to reach the 161.8% level on the first try but if there's a deep enough pullback (3-6%?) it will reach it and pierce it for that final high afterwards. The small pullback of 1.34% back then kept it from making that higher high and from there it crashed basically.
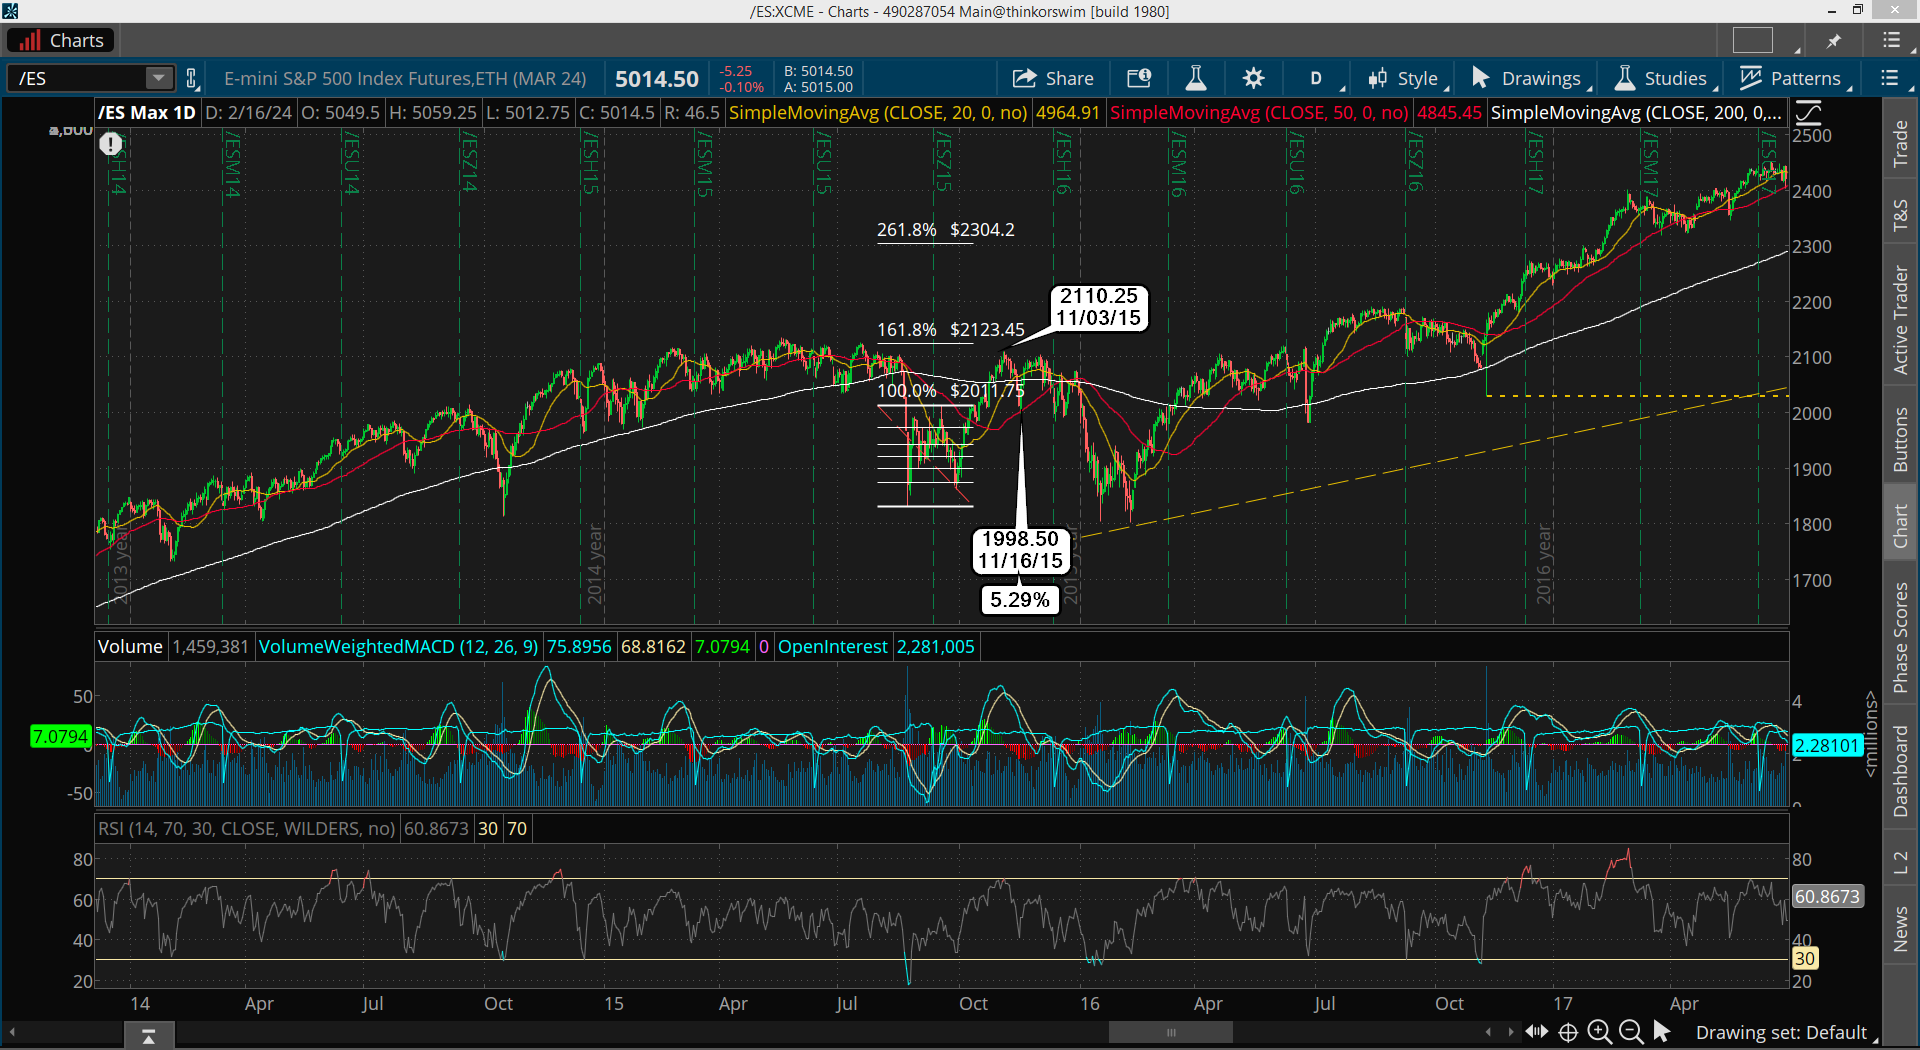
On the next chart (above) we see the 2016 period. After the Flash Crash in 2015 the market quickly rallied back up to 2011.75 to make the A wave, and that high projected a 2123.45 target for the 161.8% extension. The market rallied up to 2110.25 on 11/3/15 and fell shy a little to hit it like it has done many times.
It then pulled back 5.29% and made another run back up to tried to make a new higher high. It failed and caused another large drop into late that year and early 2016. This seems to be the pattern where if the rally up AFTER the pullback from the 161.8% target FAILS to make a new all time high the drop starts from there for the next larger and longer term correction (months).
If if makes a new higher high the multi month correction starts from that point it seems, but in both cases after that last move up (call it a 5th wave?) there is a very another large drop that follows.
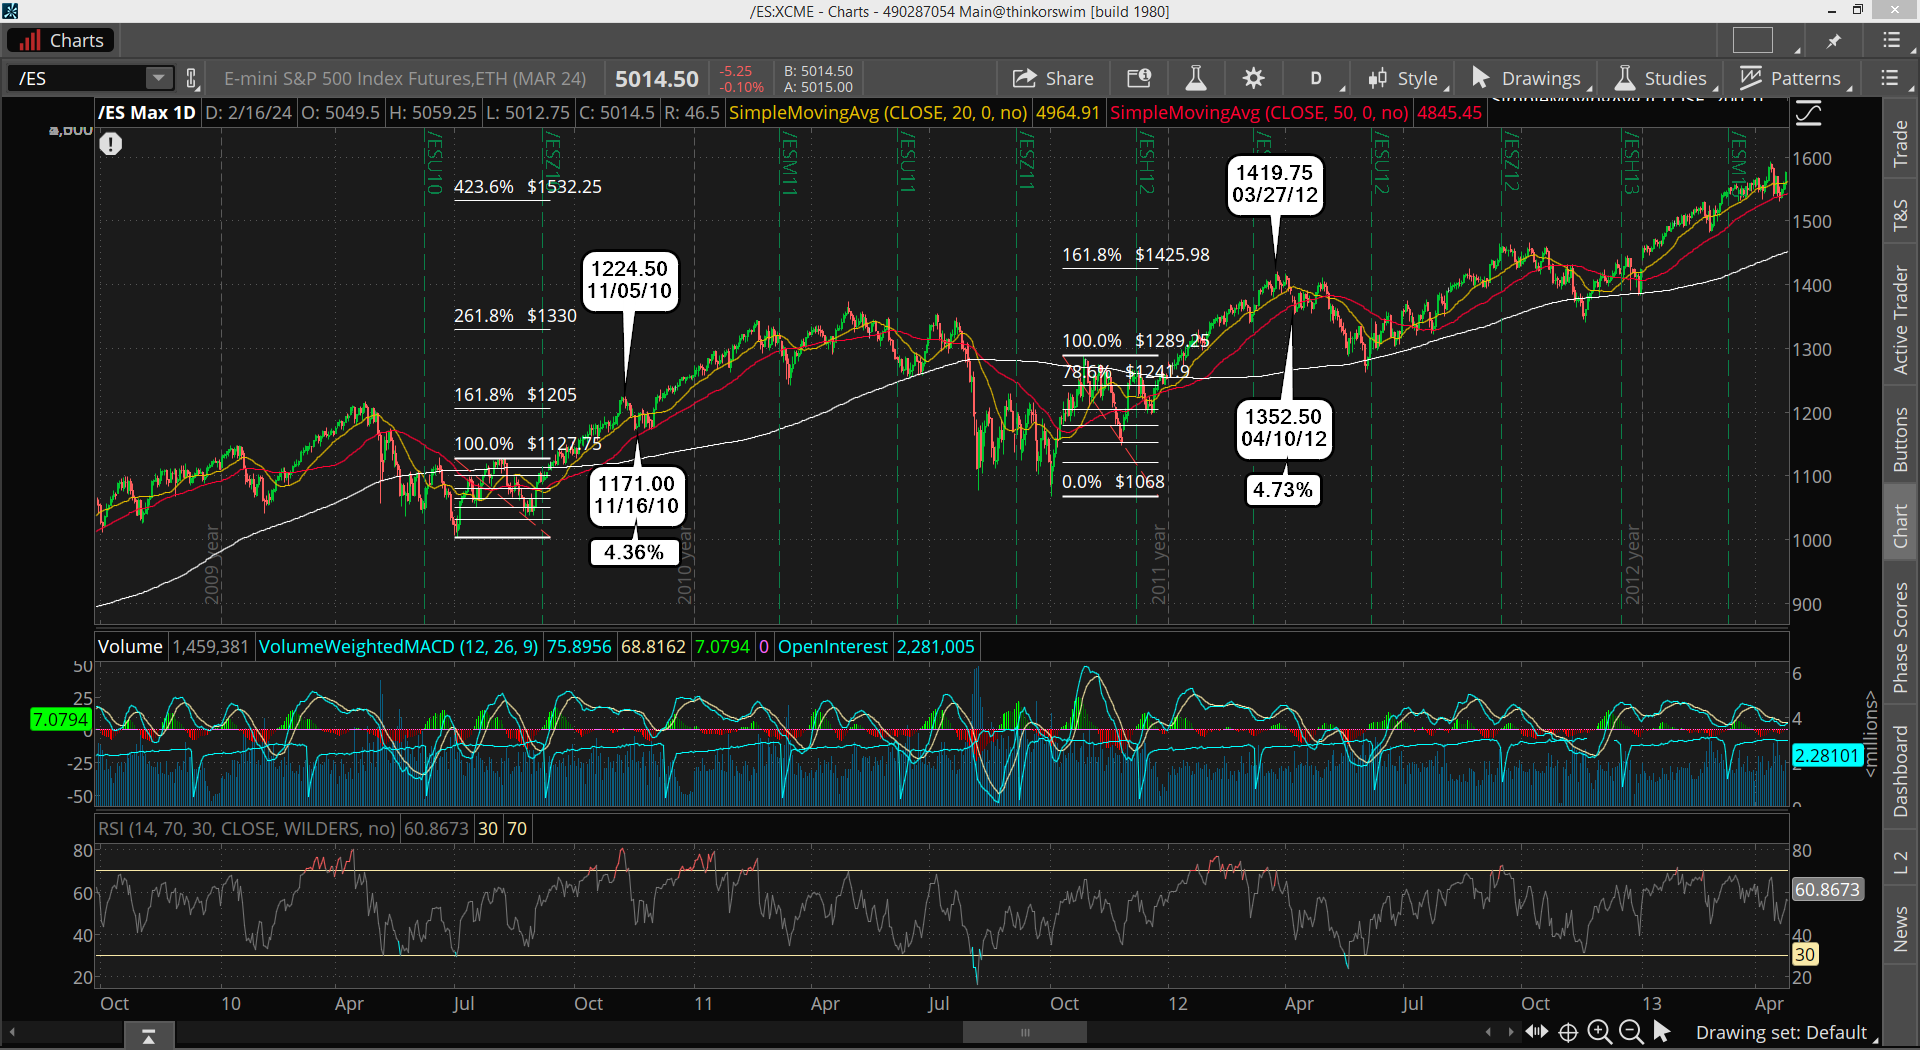
Moving on we now will look at the 2010 and 2012 periods (above). First we examine the late 2011 rally back up for the A wave, which topped at 1289.25 and projected a 161.8% target of 1425.98.. which once again the market rallied up into it and fell shy hitting 1419.75 on March 27th, 2012.
Then we saw a 4.73% pullback followed by another rally to attempt to make that final higher high. It failed just like the 2016 one did. Call it a "Truncated 5th Wave" if you want? Regardless of what you label it the same result happened... another multi-month deep correction. It pulled back into the 200 SMA (in white) and found support there to stop the decline. But it was probably a 40-50% pullback from the 2011 low, so a nice one to trade.
Looking at the 2010 low the first rally up for the A wave ended at 1127.75 and projected a 1205 high for the 161.8% extension. The market rallied up nicely an pierced that level this time around with a high of 1224.50, and then did a 4.36% pullback. It held on the 50 SMA (in red), so from there another rally up followed.
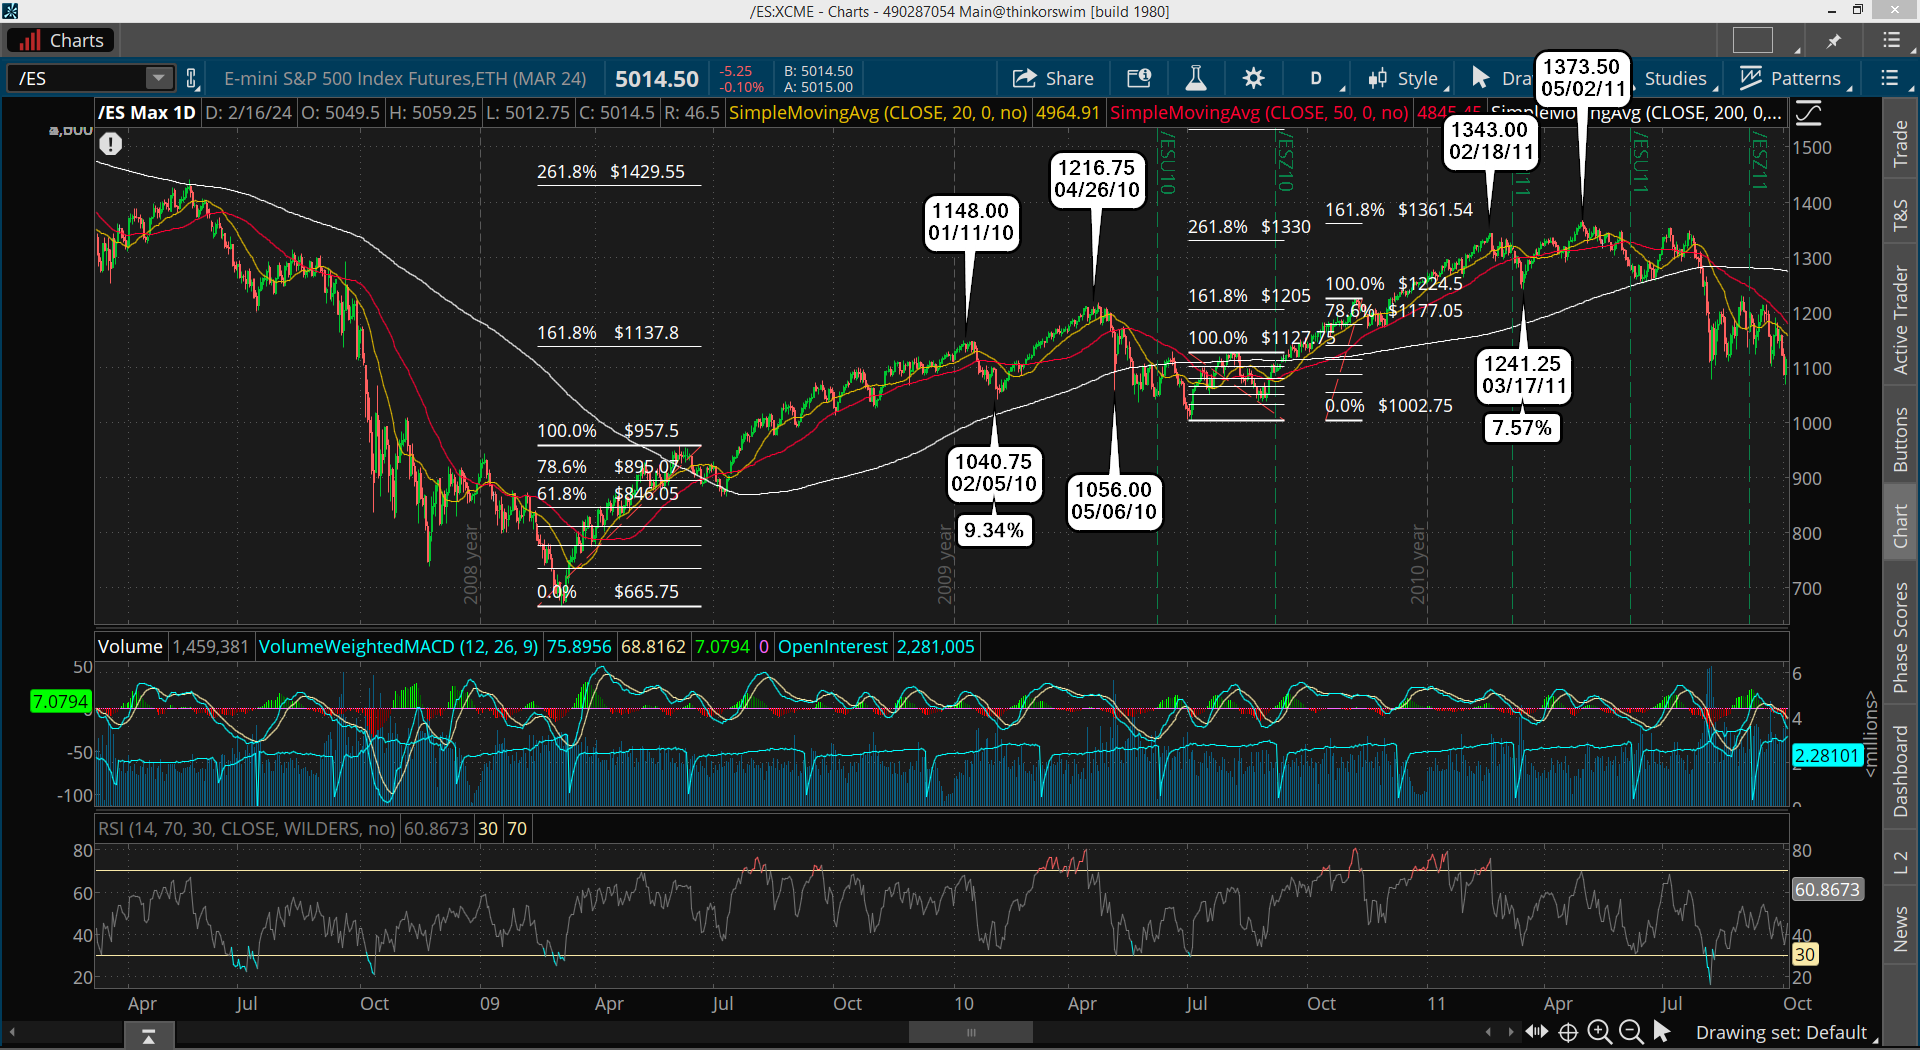
Going back further now we study the 2009-2011 period (above) and you can see that I added the period after that 4.36% pullback to see if the rally that followed could be projected to as well. I marked the top of that A wave at the 1224.50 high and it projected a 161.8% level of 1361.54, which the market rallied up into 1343.00 on 2/18/11 (fell shy again) before pulling back 7.57%, which then gave the market enough fuel to make another higher high on 5/2/11 of 1373.50 to pierce the 161.8% level successfully.
Looking at the famous 666 low in 2009 we see the A wave high was 957.50 and it projected a 161.8% target of 1137.80 back then. It was hit and pierced on 1/11/10 and then produced a 9.34% pullback before rallying again into 4/26/10 where a larger multi-month correction followed.
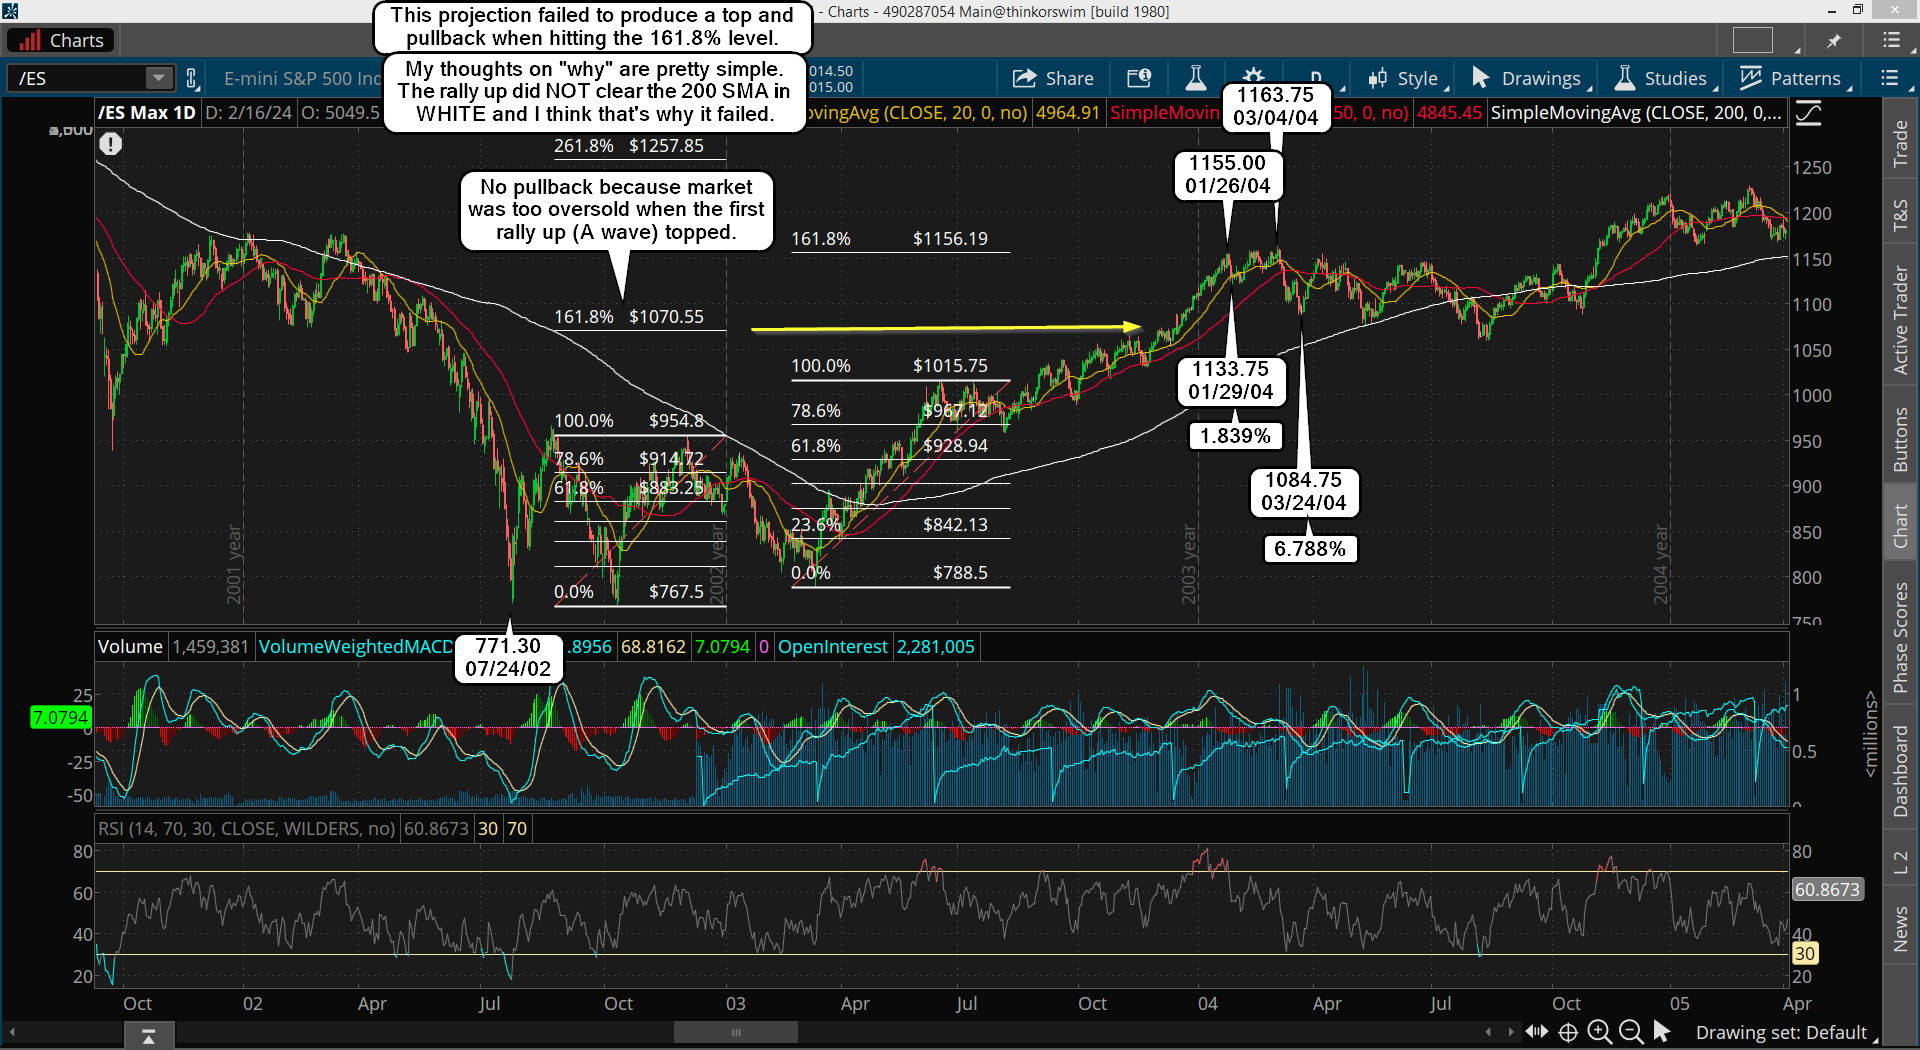
Lastly let's look at the 2002-2004 period (above) to see what happened back then. I marked two different levels for the high of some A wave up. The one in 2003 into 2004 worked again as the 1015.75 high for the A wave targeted 1156.19 for the 161.8% extension and the market hit 1155.00 on 1/26/04 falling shy as it seems to do a lot.
Then a small pullback of only 1.839%, followed by a final attempt into 3/4/04 where it pierced it successfully and reached 1163.75 before a multi-month correction started. It was a slow an drawn out one but the pattern still repeats it seems.
Now looking at the 2009 period the 954.80 high for the A wave projected a target of 1070.55 for the 161.8% extension, which was hit and pierced, but the market continued higher there without doing the typical 3-9% pullback. I can only think that happened because the market was so oversold on the monthly and weekly charts that there was too much upward pressure to allow such a pullback so early after the 2 year correction ended.
Conclusion...
If after the pullback into the 26th the rally up into March 22nd gets to the 5250-5300 zone a week or so PRIOR to the 22nd, and it pulls back 1-2%, then the move back up might ONLY put in a double top like 9/21/18 and 10/3/18 did (lower high back then, but could be a slightly higher high this time) I'd say we will have topped for the year and will drop hard like 2018 did.
Or... if after the pullback into the 26th the rally up into March 22nd tops inside the 5250-5300 zone on that date then odds suggest we'll pullback some decent amount of 4-10%? and then rally up into April or May for a higher high to end the entire rally up from the 2022 low of 3502. From there we drop hard the rest of the year.
Have a blessed day.


