

What a disaster for the bulls last Friday. I thought we would rally back up as the technicals where getting down in a zone where "turns" back up commonly happen, but it instead we took another large move down. I have to now rethink what is happening here. But first, let me share another FP on the QQQ that appeared Friday morning before the open.
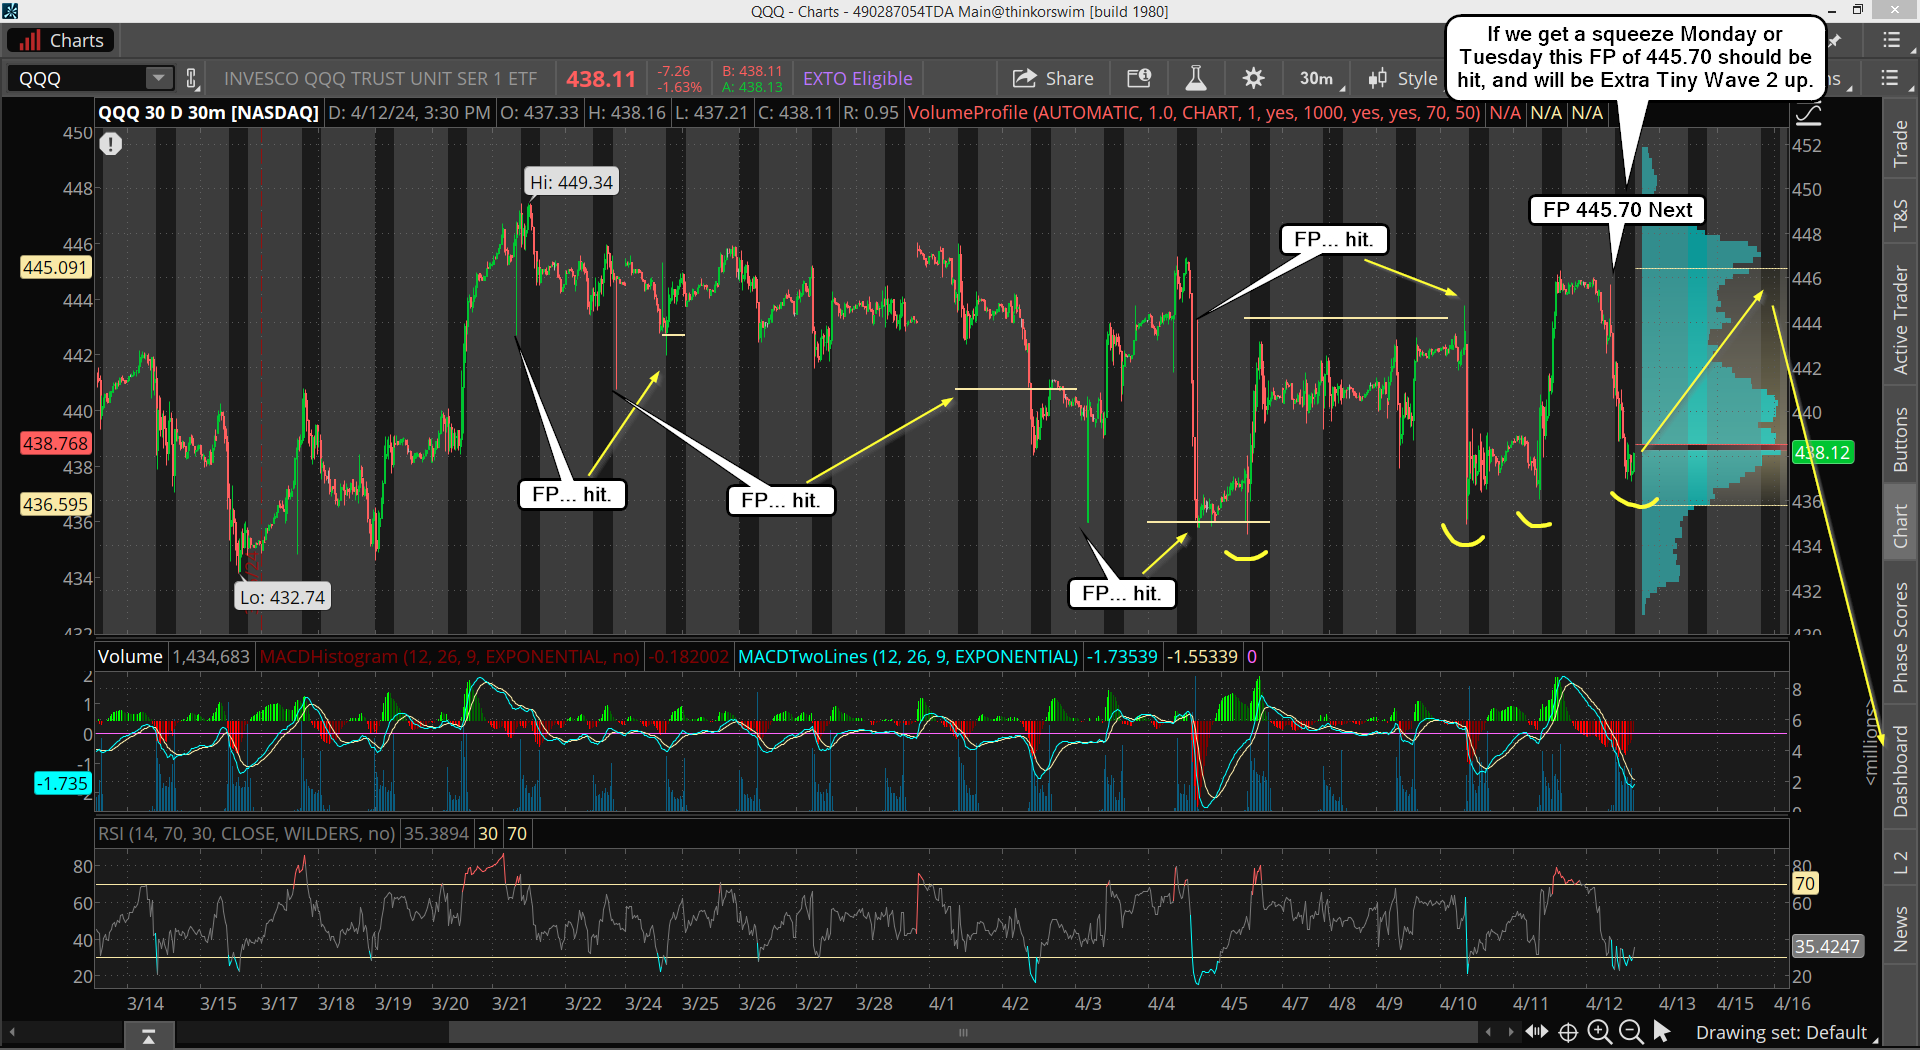
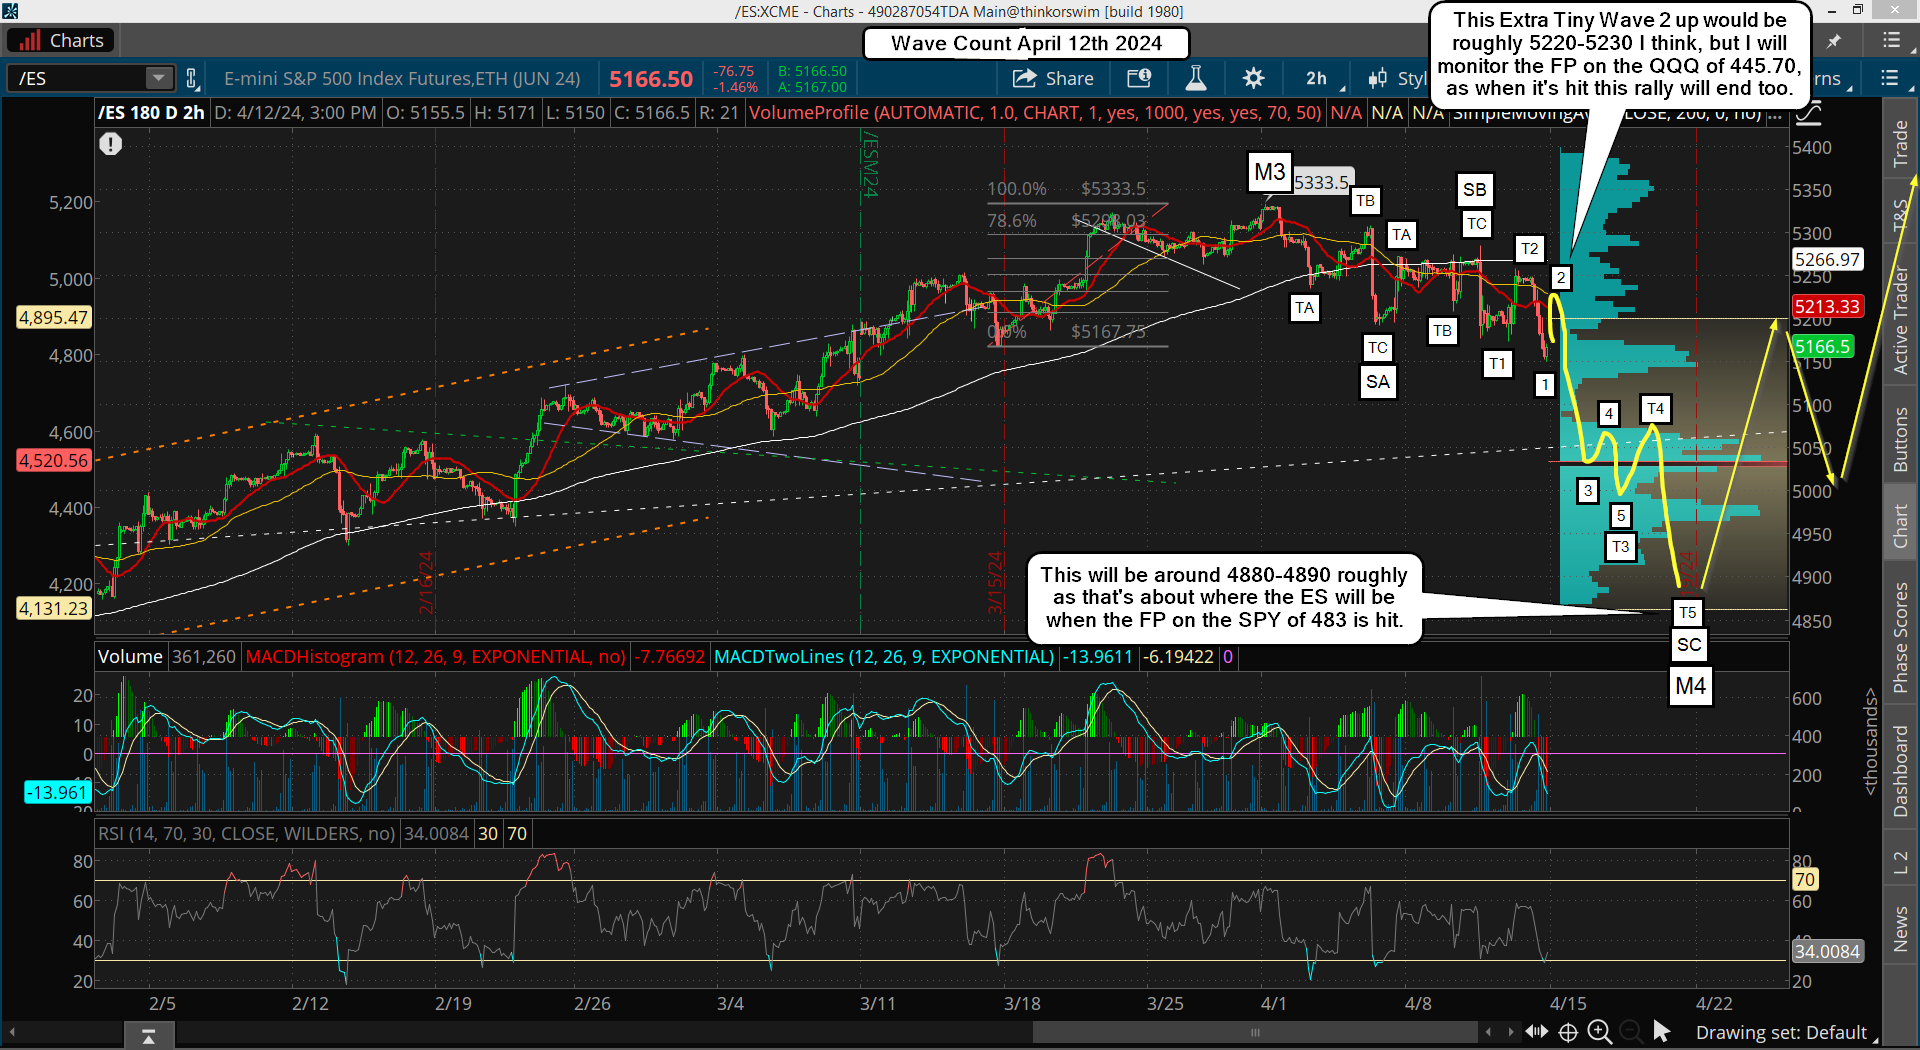
This FP is for 445.70, and pretty much is a full reverse (about 95%) of the drop on Friday. Now that's ONLY on the QQQ, and it's stronger then the ES, so if this happen I don't think the ES will recover as much... maybe 75-80% of the move down? The ES is in a falling channel, whereas the QQQ (Nasdaq) is in more of a sideways channel. If the FP is hit early this week on the QQQ I think we might reach 5220-5230 on the ES, but not all the way back to the 5245 zone where it spent the premarket session at Friday.
Ok, so I said I have to rethink everything... which I have. I was stubborn and thinking that we'd only get a small pullback (which we have... so far) and then we'd go back up again and continue the grind like we've done for months now. But over the weekend I stepped back and re-thought about everything, and I've concluded that it's very likely that we are now in the 5-10% correction after all.
My FET of 5334 was a direct hit with the current all time high being just one point shy of it, so why would I think that a target that important would just produce a minor dip? I should have woke up and slapped myself and said "hey dummy, it's time for the 5-10% correction now", but I guess I've been so used too all the dips being bought, and new all time highs following, that I couldn't see the forest for the trees.
However, God gave me a good wake up last week with a second FP on the SPY that only lasted one day before disappearing. Guess where it was? The same 483 zone as the prior one back on March 1st.
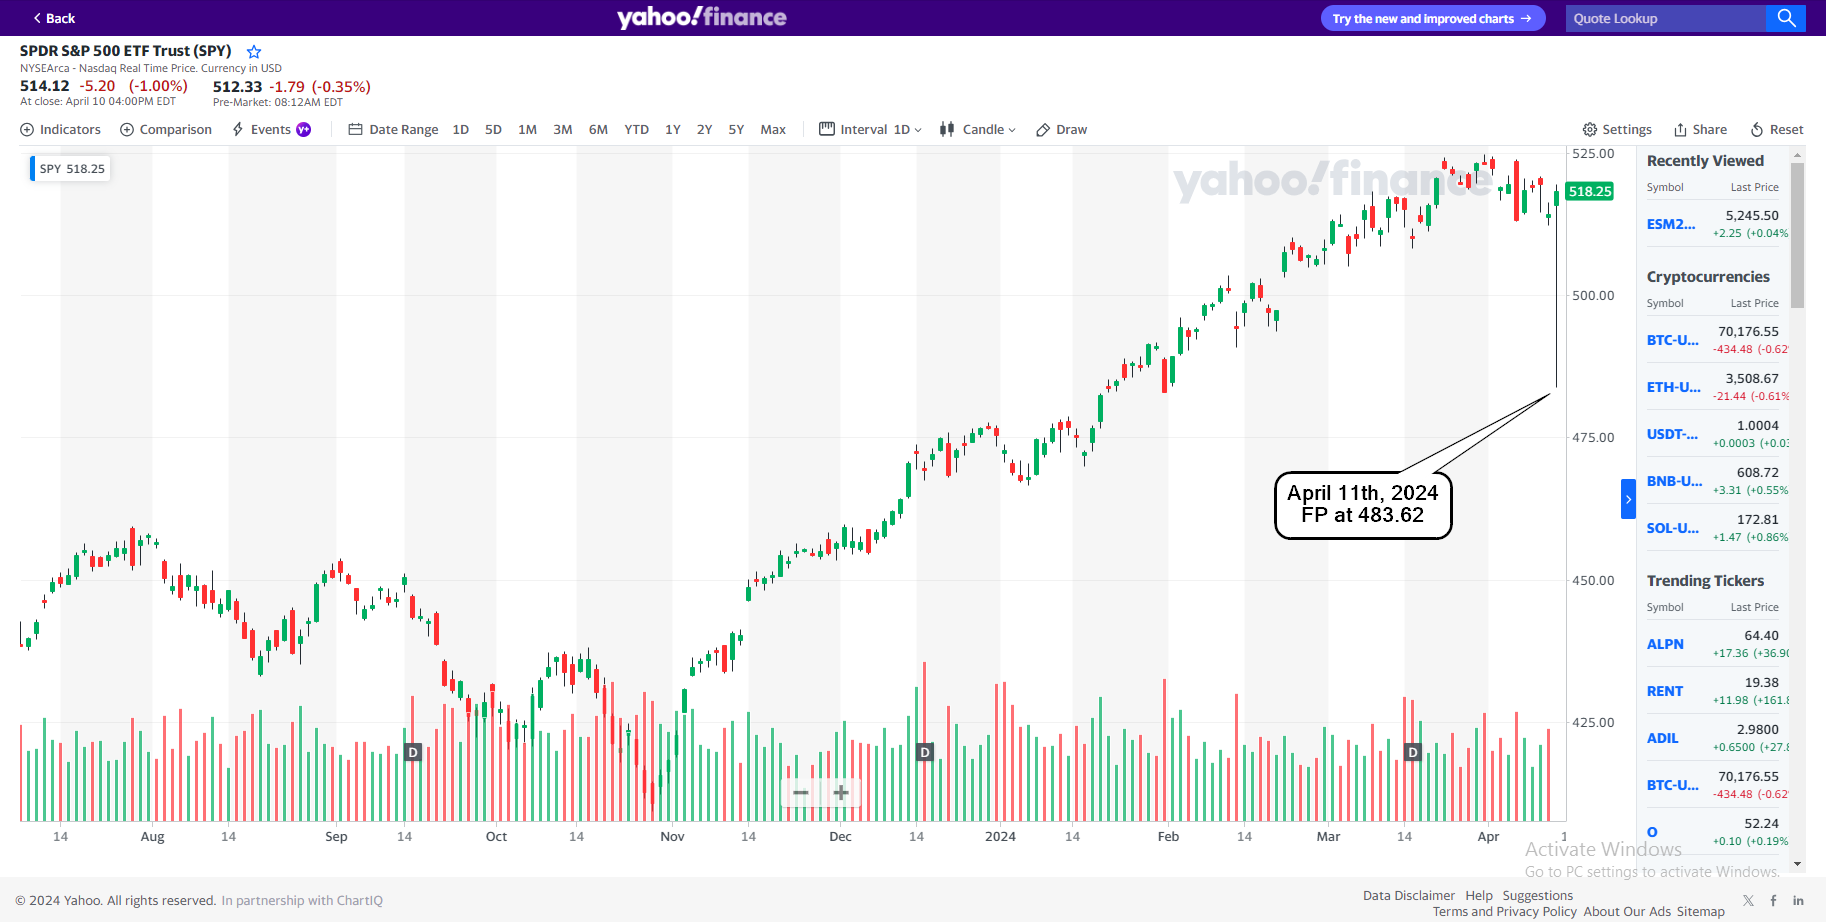
Here's the first old one from March 1st below...
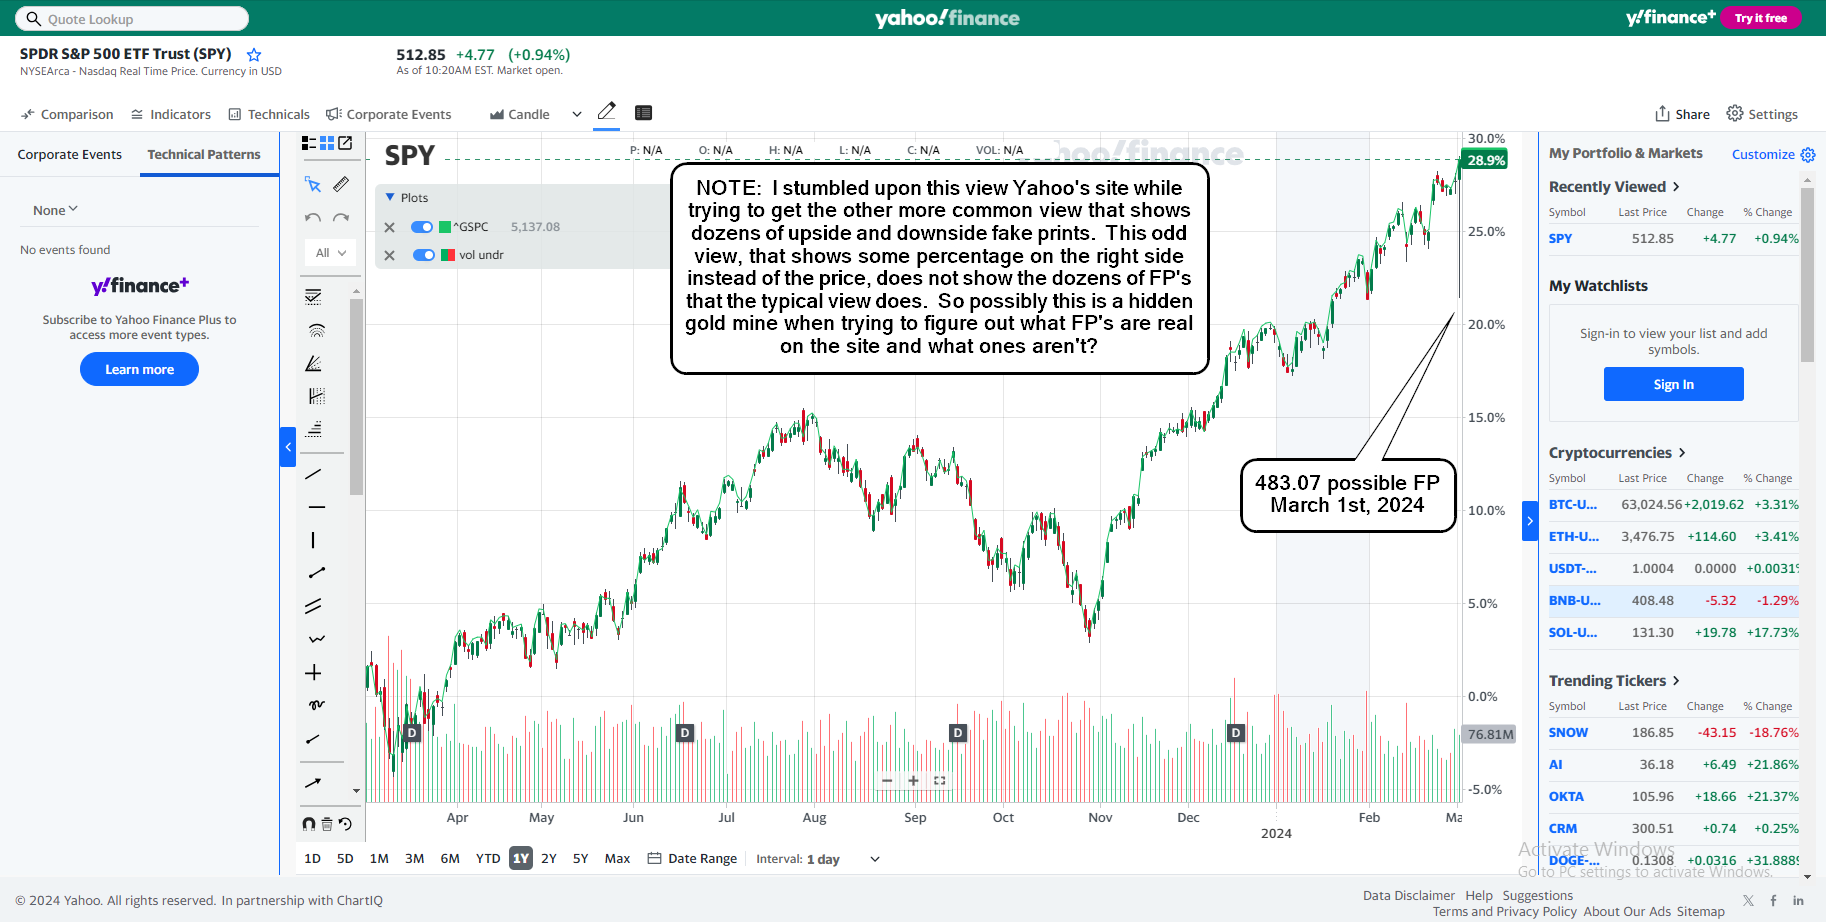
Now that's 2 Fake Prints showing the same level that disappeared within one or two days. Isn't that interesting?
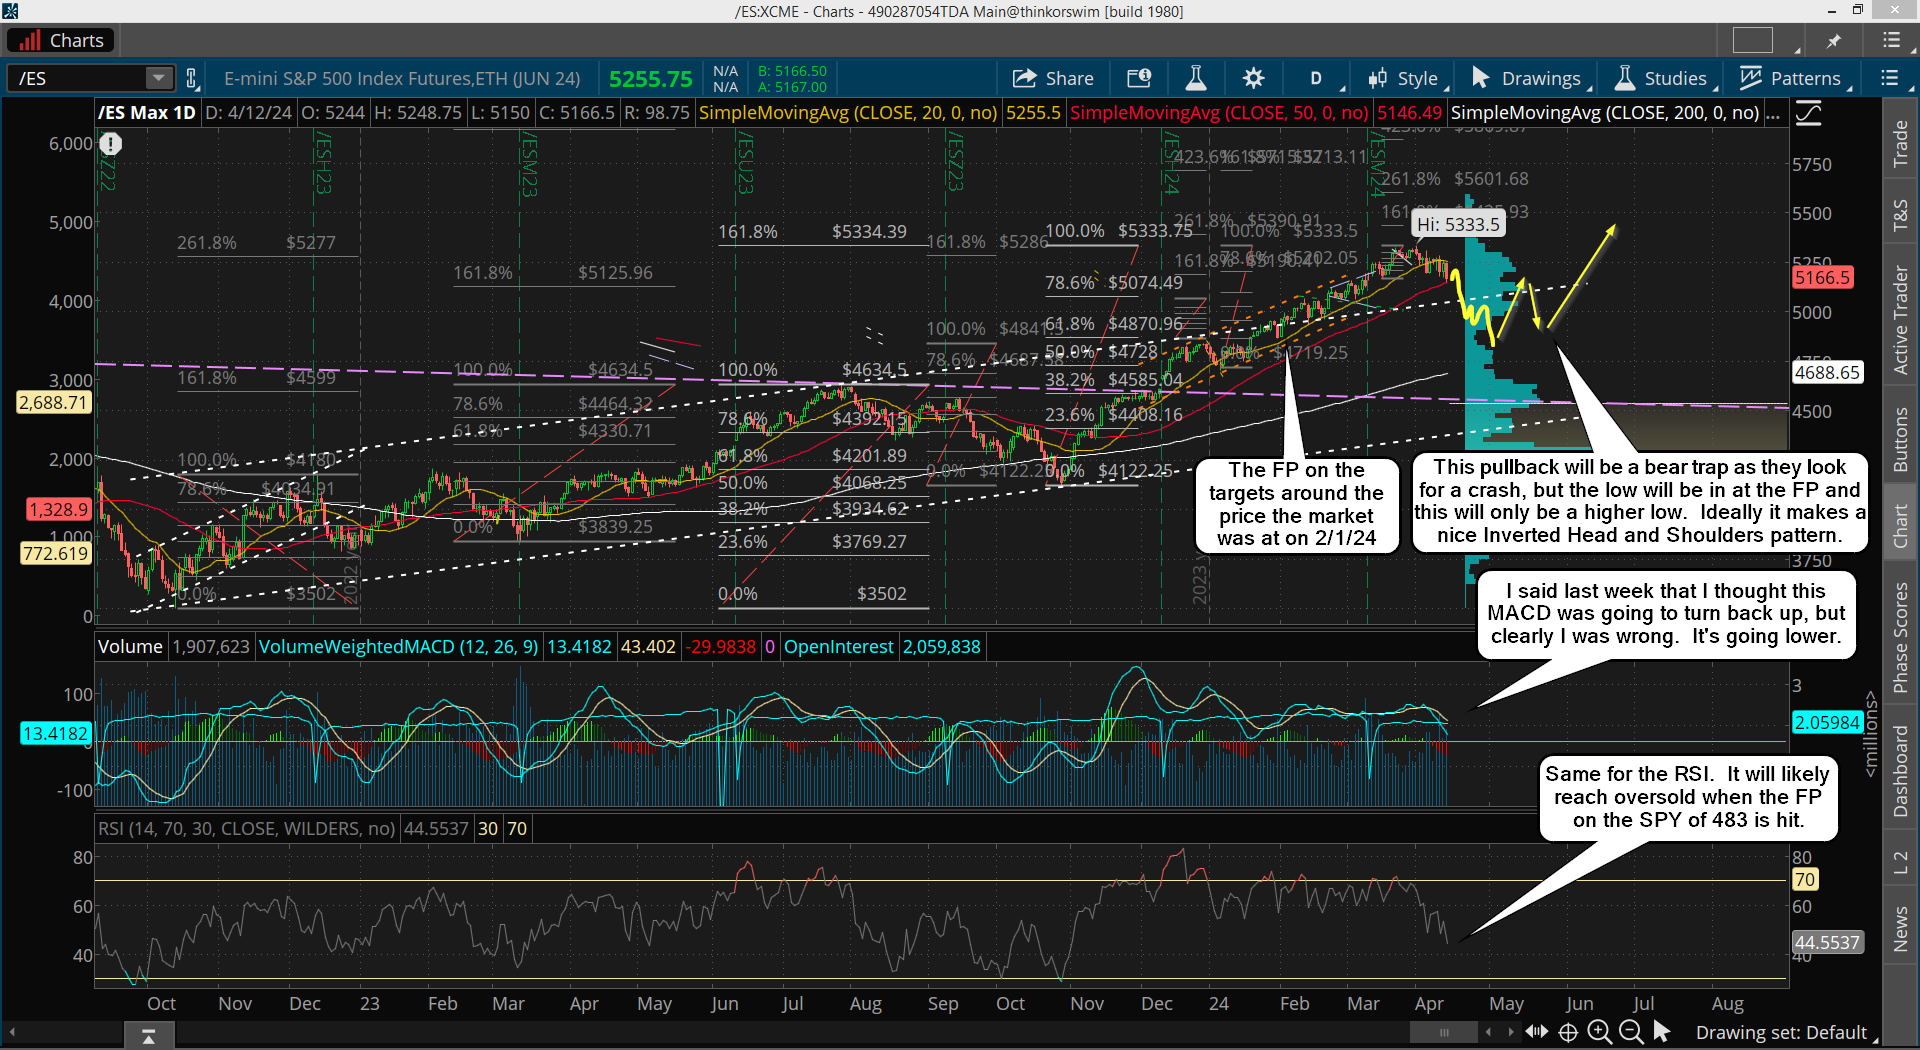
Of course it's a signal that's telling all the insiders where the market will bottom at whenever the correction starts. So are we in the correction now? I have to think the odds are good that we are indeed in the 5-10% correction right now, and "if" we get some move up to the QQQ FP of 445.70 early this week I think it will be the last strong bounce before we have what will probably be a C wave drop (non-stop) that will hit the 483 SPY FP, which will be roughly 4880 or so on the ES (4830 or so on the SPX).
I've been clearly wrong on this pullback as it's more then that... it's the correction that everyone has been waiting for now for months. We could just go straight down to the SPY FP this week without any bounce back up to the QQQ FP, but the last 2 weeks the QQQ's have been a gold mine for FP's and they have all been hit within a few days, so I have no reason to believe this one won't be hit to. I just don't know the "when" part, but if it happens Monday it will NOT likely be the start of a big squeeze up to new all time highs as the history of those FP's don't support that, but instead they have all marked a "turning point".
Just look at all of them. They all got hit, pierced, and the market reversed back up the other direction. Why would this one be any different? When it's hit it I do think we'll turn back down again from it. The market will likely show NO FP whenever it's really going to run up and breakout to a new high and start the next multi-month grind higher, but that could be a month away.
The very fact that this FP appeared last Friday is proof to me that we are not ready for another trend move up. It will only be another short squeeze that ends and gets reversed back down again. How low we go is anyone's guess? Maybe the market isn't in the 5-10% correction now? But the second 483 FP is telling me we are indeed in it, and all of these wild swings up and down look a lot like a whole bunch of wave 1's down and 2's up before a wave 3 of a 3 of a 3 (or A's and B's and then a C of C.... you get the idea). Here's what I see as possible with the waves...
Yes, we could be setting up a nasty crash like wave down coming this week, and it might be over with by mid-week. I really am kicking myself for not seeing this but I'm human and make mistakes, and this market is not easy to figure out. But if we do get one more move up early this week I think it's the ideal short before we drop to the 483 FP on the SPY later this week.
Here's the bigger picture wave count on the daily chart of the SPX cash...
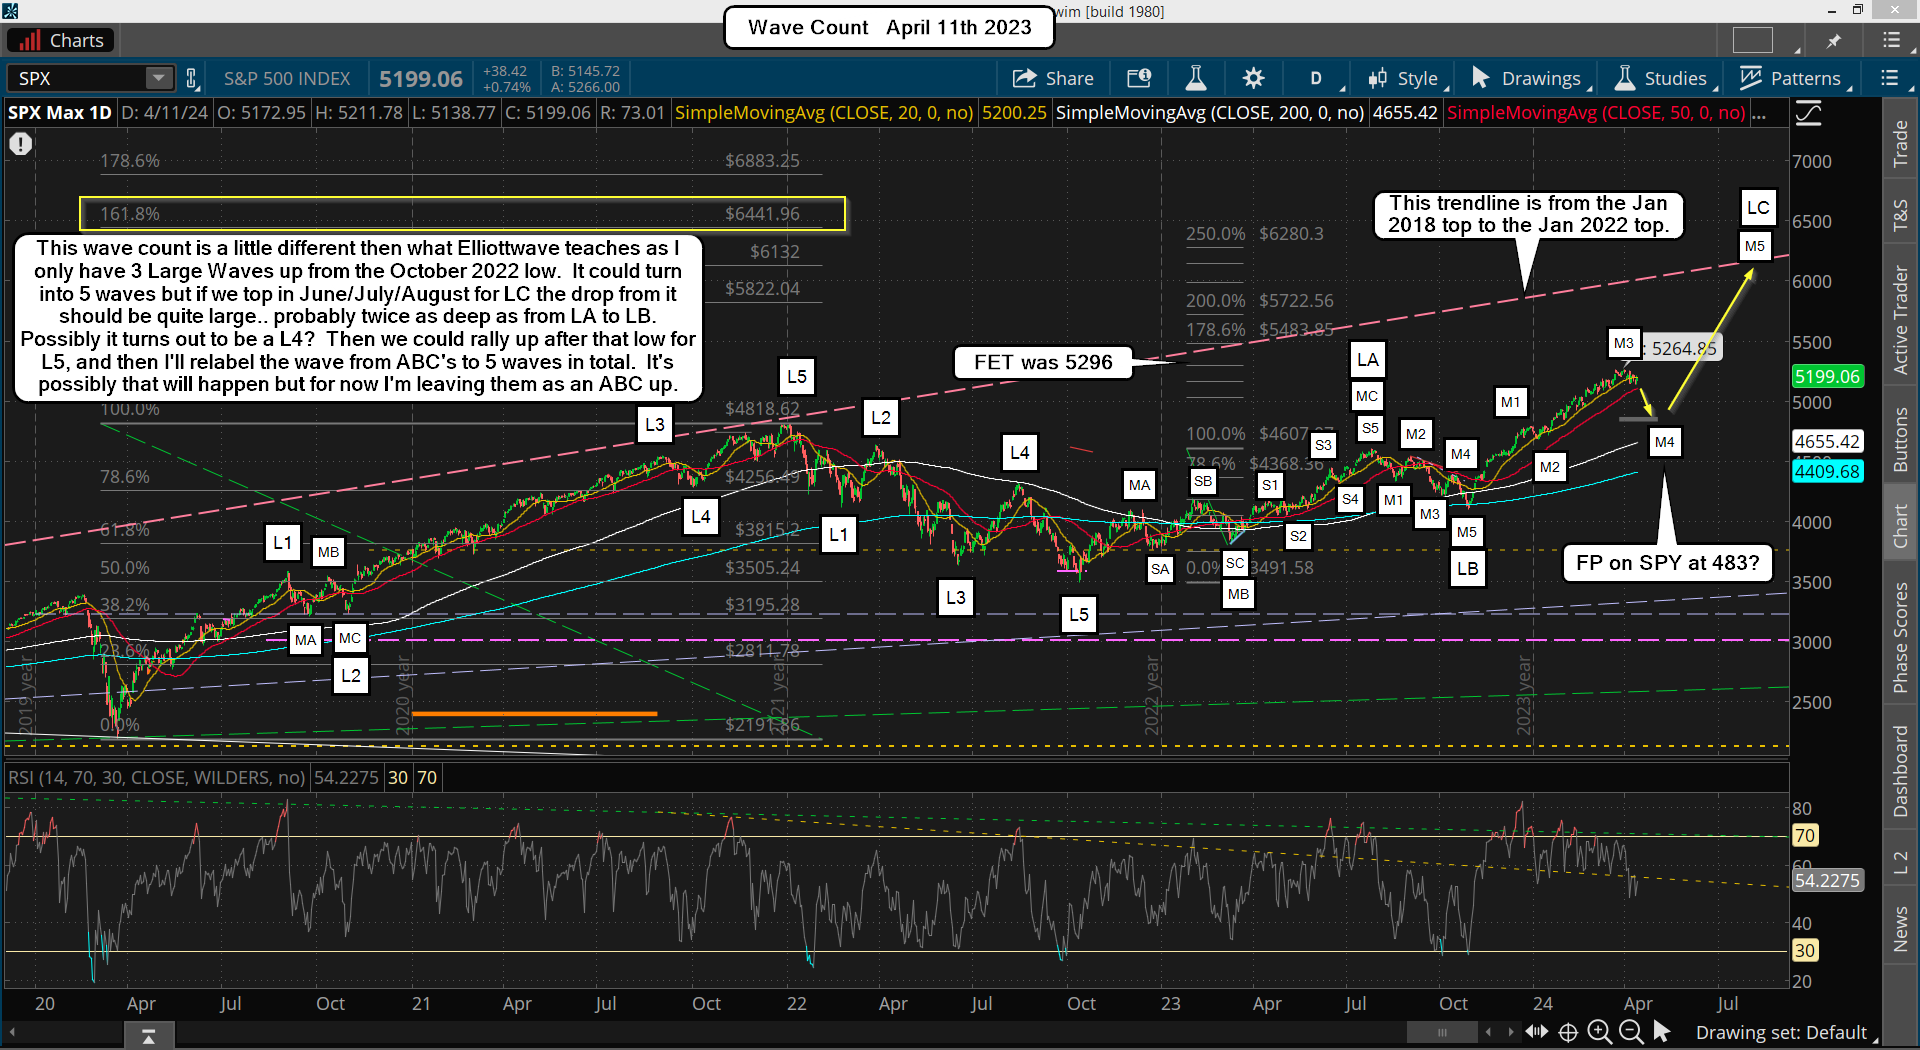
That dashed pink rising trendline will be strong resistance when it's hit this summer/fall, and it might mark the final high for Medium Wave 5? The biggest Fibonacci Extension Target is at 6441.96, but who knows if that final leg up gets hit or not? But I'll certainly be excited to ride that long out as it will be a huge money maker, and way easier then this correction.
Have a blessed day.


I have sell signals galore now. The strongest one (and confirming) occurred on Friday with a certain indicator breaking to new lows. The question now is, will the 100 day average stop the decline or the 200 day average?
I’m still looking for the FP on the SPY as the low, but it sure isn’t going there in any hurry it seems. Very frustrating to see all these drops and bounces. It’s stairstepping its’ way there.