

The Typical Scenario...
No time was wasted yesterday as it put in the bottom for my smaller B wave, which I thought might carry into today where the final low would be but it didn't take that long and just turned back up and grinded higher the rest of the day with a big squeeze after the close. We are clearly in the C wave up now, inside a bigger B wave. The chart below was posted in the chatroom yesterday and it's playing out nicely.
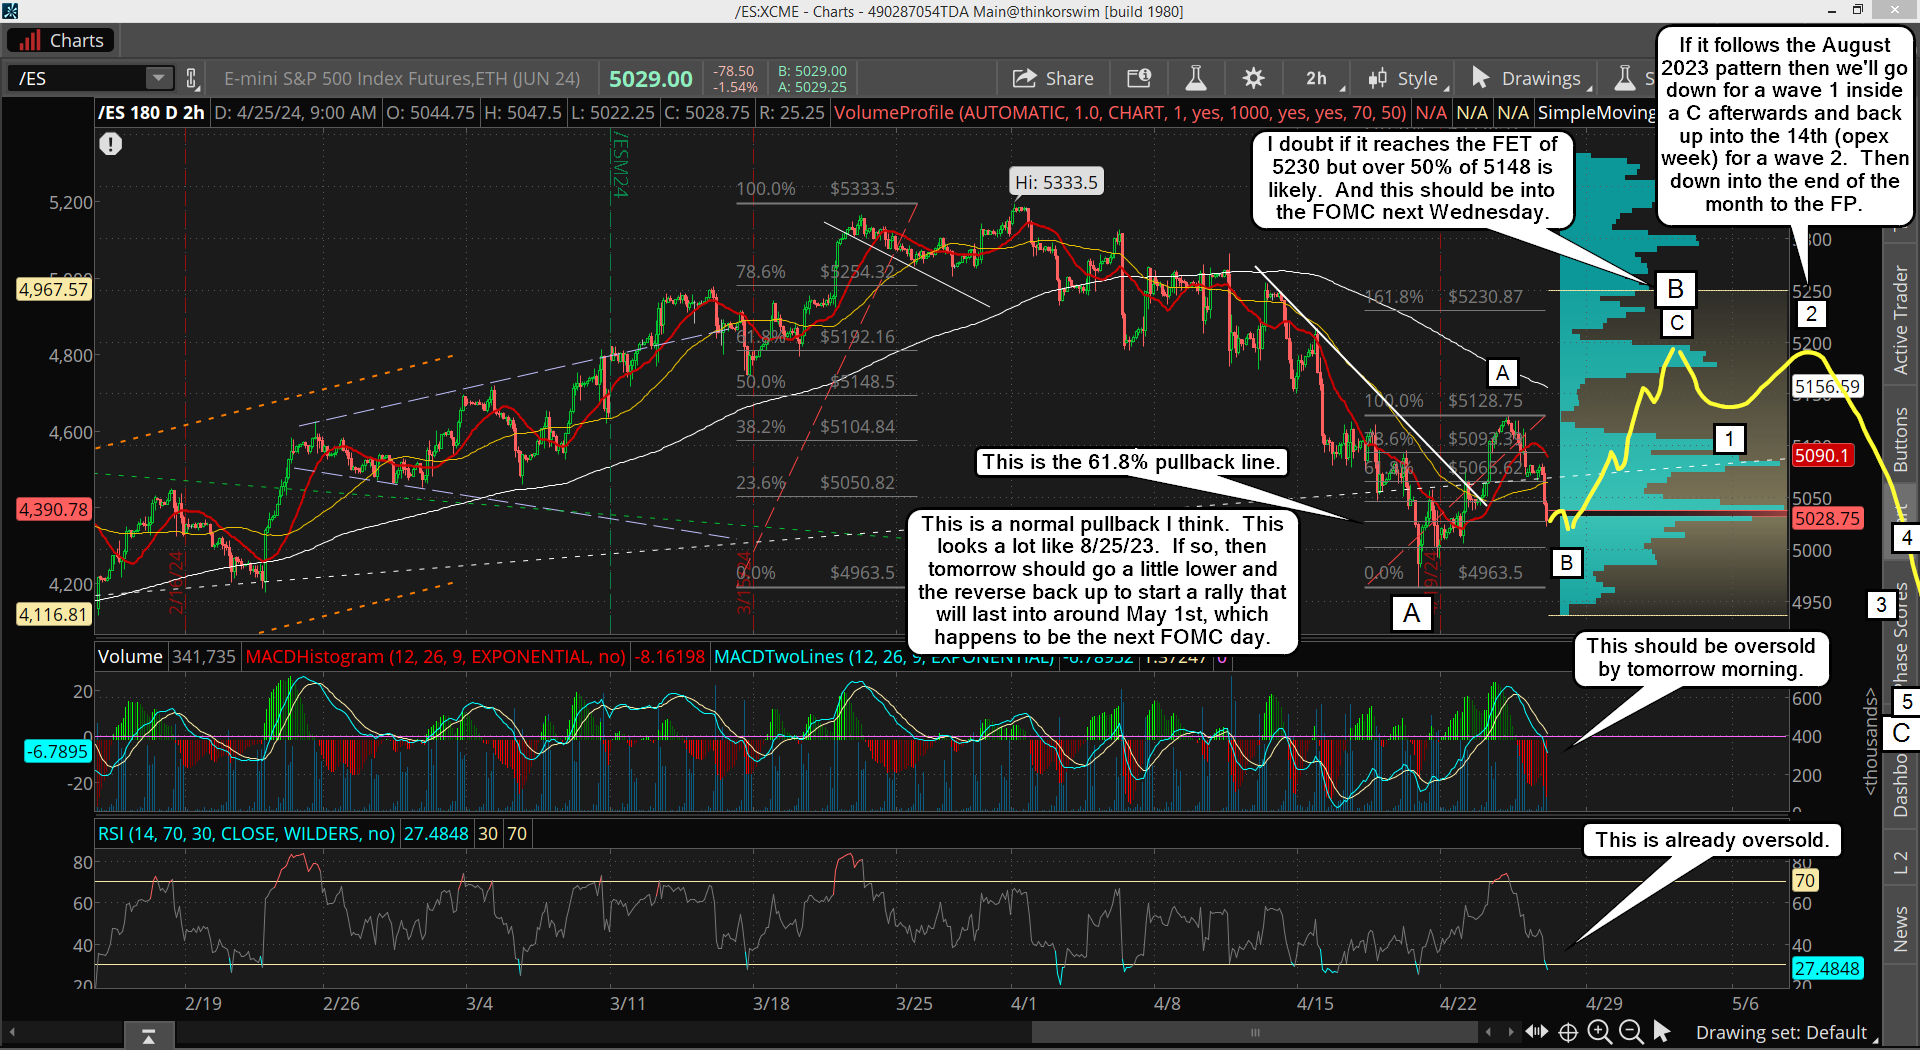
I thought we would only go up about half of the down move and then pull back one last time today for a higher lower (or slightly lower low) but that part was completely wrong as we just took out the 5128 high of the smaller A wave in the afterhours session.
I'm sure that the smaller C wave will unfold in 5 waves but I'm not sure where we are in it right now. The afterhours squeeze sure felt like a wave 3 of some degree, and there was a pullback around 2:00-2:30 pm EST yesterday, which could have been a wave 2? It's hard to figure out the smaller waves but it's clear that we are inside the smaller C wave up in the bigger B wave.
I think it will end between 5192.16 to 5230.87 going into next Wednesdays FOMC meeting. Then I think we drop for the bigger C wave over the following several weeks. It could end up being a fast drop, but it could also drag out in time and last into the end of the month. Yes, that would stink as it's very hard to trade when it has so many up's and down's, which is exactly what the bigger A wave had. It drove me nuts in the beginning with all the fast one day drops that got reversed back up hard the next day. Hopefully the bigger C wave won't do that and will just drop non-stop with next to nothing for bounces and hit the FP on the SPY within the typical 8-10 days that these patterns commonly play out with.
As for today, it's a Friday so I'd expect it to close green. There could be some kind of pullback today but usually they hold the market up and go sideways after doing powerful squeeze like they did after the close yesterday. Then Monday and Tuesday should be choppy too as the market waits on the FOMC. Somewhere in there we'll see the wave 4 down and then the wave 5 up into Wednesday ideally.
The Wild Card Scenario...
I give this equal odds of playing out. We have got really close to the 50% retrace from the bottom compared to the all time high, which is 5148.50, and we are super close to it now. If it's hit today I will have to short it and look for the drop the FP to happen into the FOMC next week to put in a low, not a high.
Bulls do NOT want to see this happen if they plan on going up to 61.8%+ into next week. Bulls will want to go sideways to build a base after such a strong move up. That means they will want to just hold this zone today and NOT rally up to the 50% retrace zone today, as if they do that then the 61.8%+ is likely off the table.
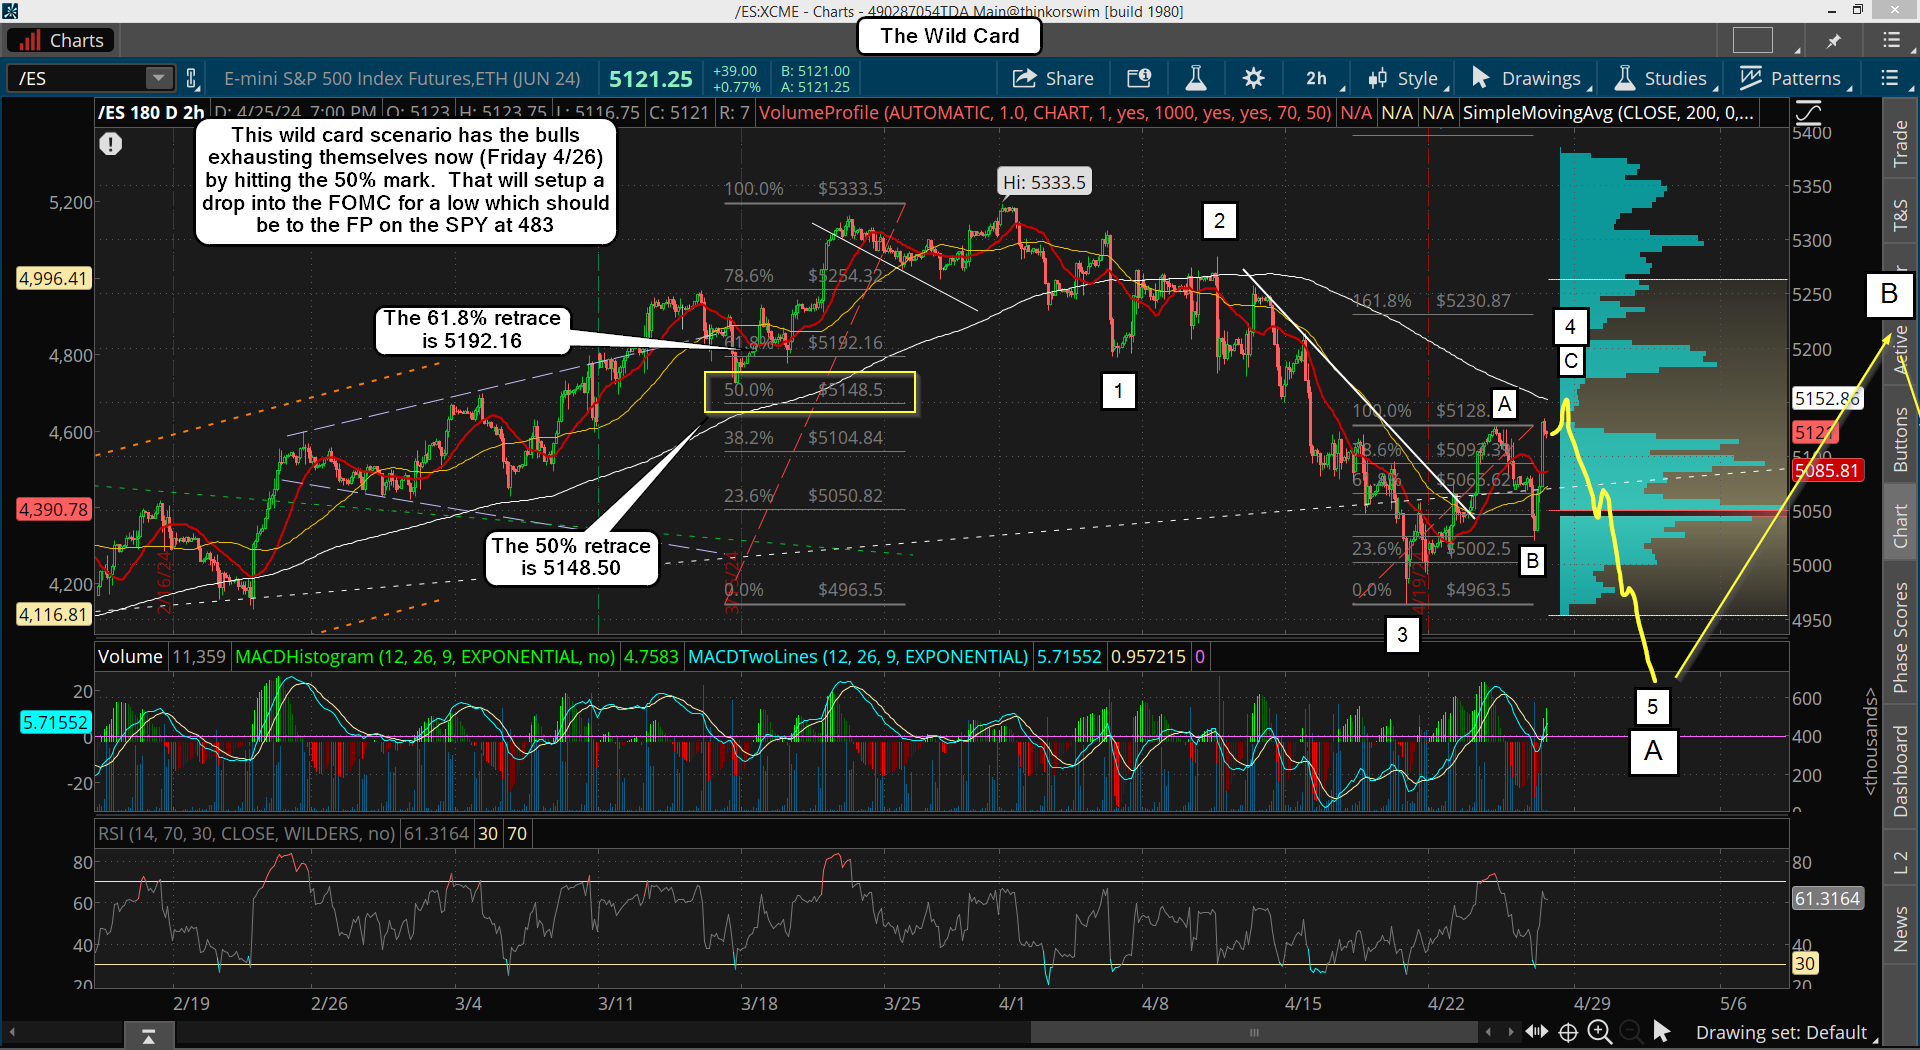
It means the entire rally up from the 4963.50 low is just a wave 4 and that we'll have that last move down to the FP on the SPY afterwards, which will be the 5th wave of course, and should bottom into the FOMC next week.
If we see a rally up to the 5148.50 level I will get bearish and will short it looking again for my FP on the SPY of 483 to be hit next week, and likely right into the FOMC meeting.
In conclusion...
The market is either going up to 61.8%+ into the FOMC, which would require today to be a "rest day" where the market does NOT go up much higher, and stays under the 50% retrace level... or the market will exhaust itself with a last squeeze up to the 50% retrace level today, which will kill the 61.8% target and result in a drop to the FP into the FOMC instead of a high.
Have a great weekend.


We probably put the top in today instead of a low. It’s six and nine months from the July 27th top and October 27th bottom from last year. There is another 41 week cycle coming up though.
They probably gap it down on Monday and leave everyone behind. There is some nasty astrology that involves Mars this time on Sunday. (which includes its conjunction to Neptune) Then it probably runs down for the entire week since it wasn’t a down week this week. But we’ll see how the week starts and how the misdirectors predict.
Some of the leading indices were down today like the Transports and financials.
The SP 500 and Nasdaq also tagged the 20 day average yesterday. It was a classic bounce off the lower Bollinger band to the middle band move. Usually happens earlier in the decline. This happened in September 1987 but we’re not following 1987.(that move would have already happened.) We’re also back to the zero line on $nymo.
I’m in agreement with you. I think we drop this week to hit the FP on the SPY.