

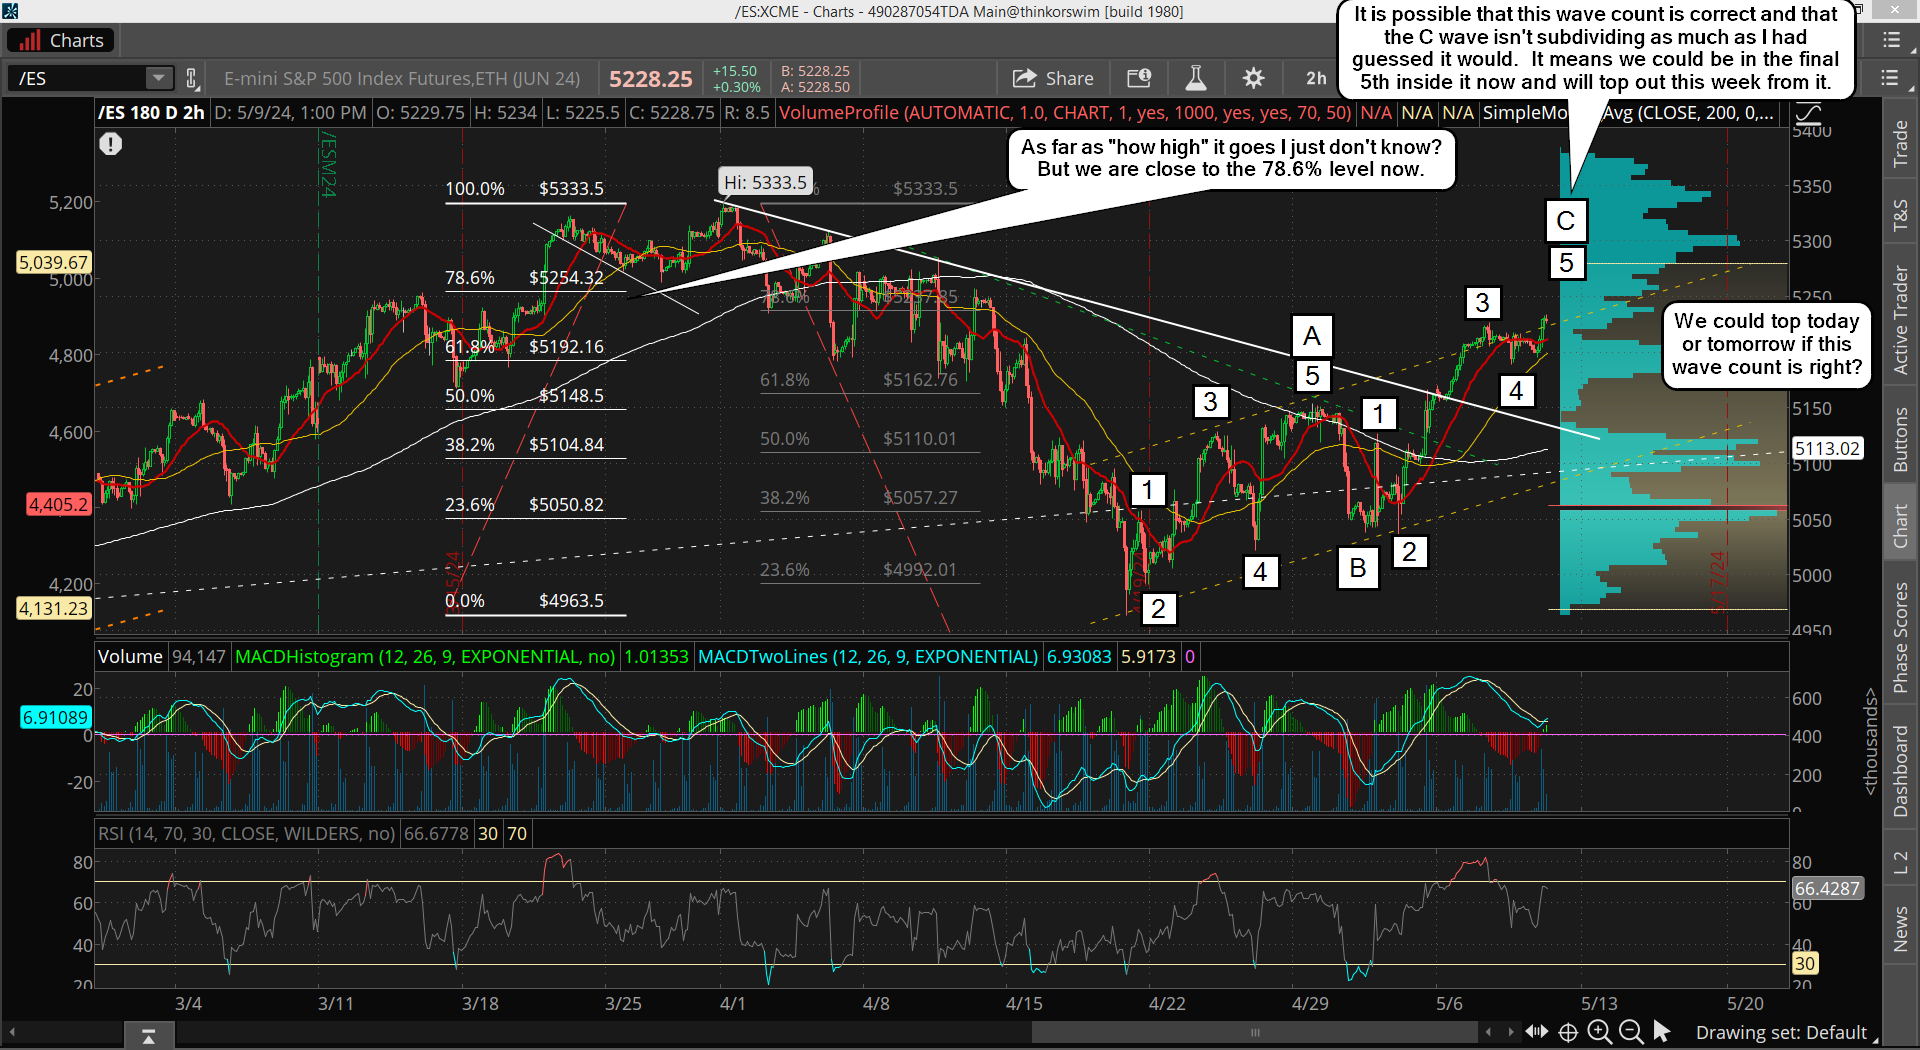
The market failed to due the pullback for small wave 4 yesterday that I was expecting, so it suggests that I'm wrong about the subdividing waves inside of Large Wave B up. I posted an updated chart yesterday in the chatroom and on twitter. I've just taken out the Tiny Waves basically, which should put us in Small Wave 5 up now inside Medium Wave C of Large Wave B.
It speeds things up basically and suggests we top faster, like today possibly. Then the first move down next week should be part of the Large Wave C, and any bounces back up should not make higher highs but a lower high. It's went a lot higher then I thought it would as I thought it would stop at the 61.8% retracement level but we are at the 78.2% level now. Will it stop here? I just don't know? I only can say that we are overbought fully now on the 2hr and 6hr charts and a turn down can come at any time now. Here's yesterdays updated chart...
I didn't put Large Wave B on the chart but it's where Medium Wave C and Small Wave 5 are at. We are there now, and into strong resistance from the 4/5 to 4/10 chop zone. Will it get through that zone? I don't know? It's possible that they us the CPI number next Wednesday morning (or PPI on Tuesday morning) to "run the stops" above that level, and then drop. It would be a double top basically as running the stops above there would get us to 5300+ I'm sure. We've seen the CPI cause big turns in the past, so this could happen again. In fact it's been awhile since we seen it used like this, so we are due for it to happen again. If that is the plan then I'd only look for a small pullback on Monday and Tuesday, which must stay above the prior 5200 level of support. It would be a subdividing Small Wave 5 I think, and the chart below explains it.
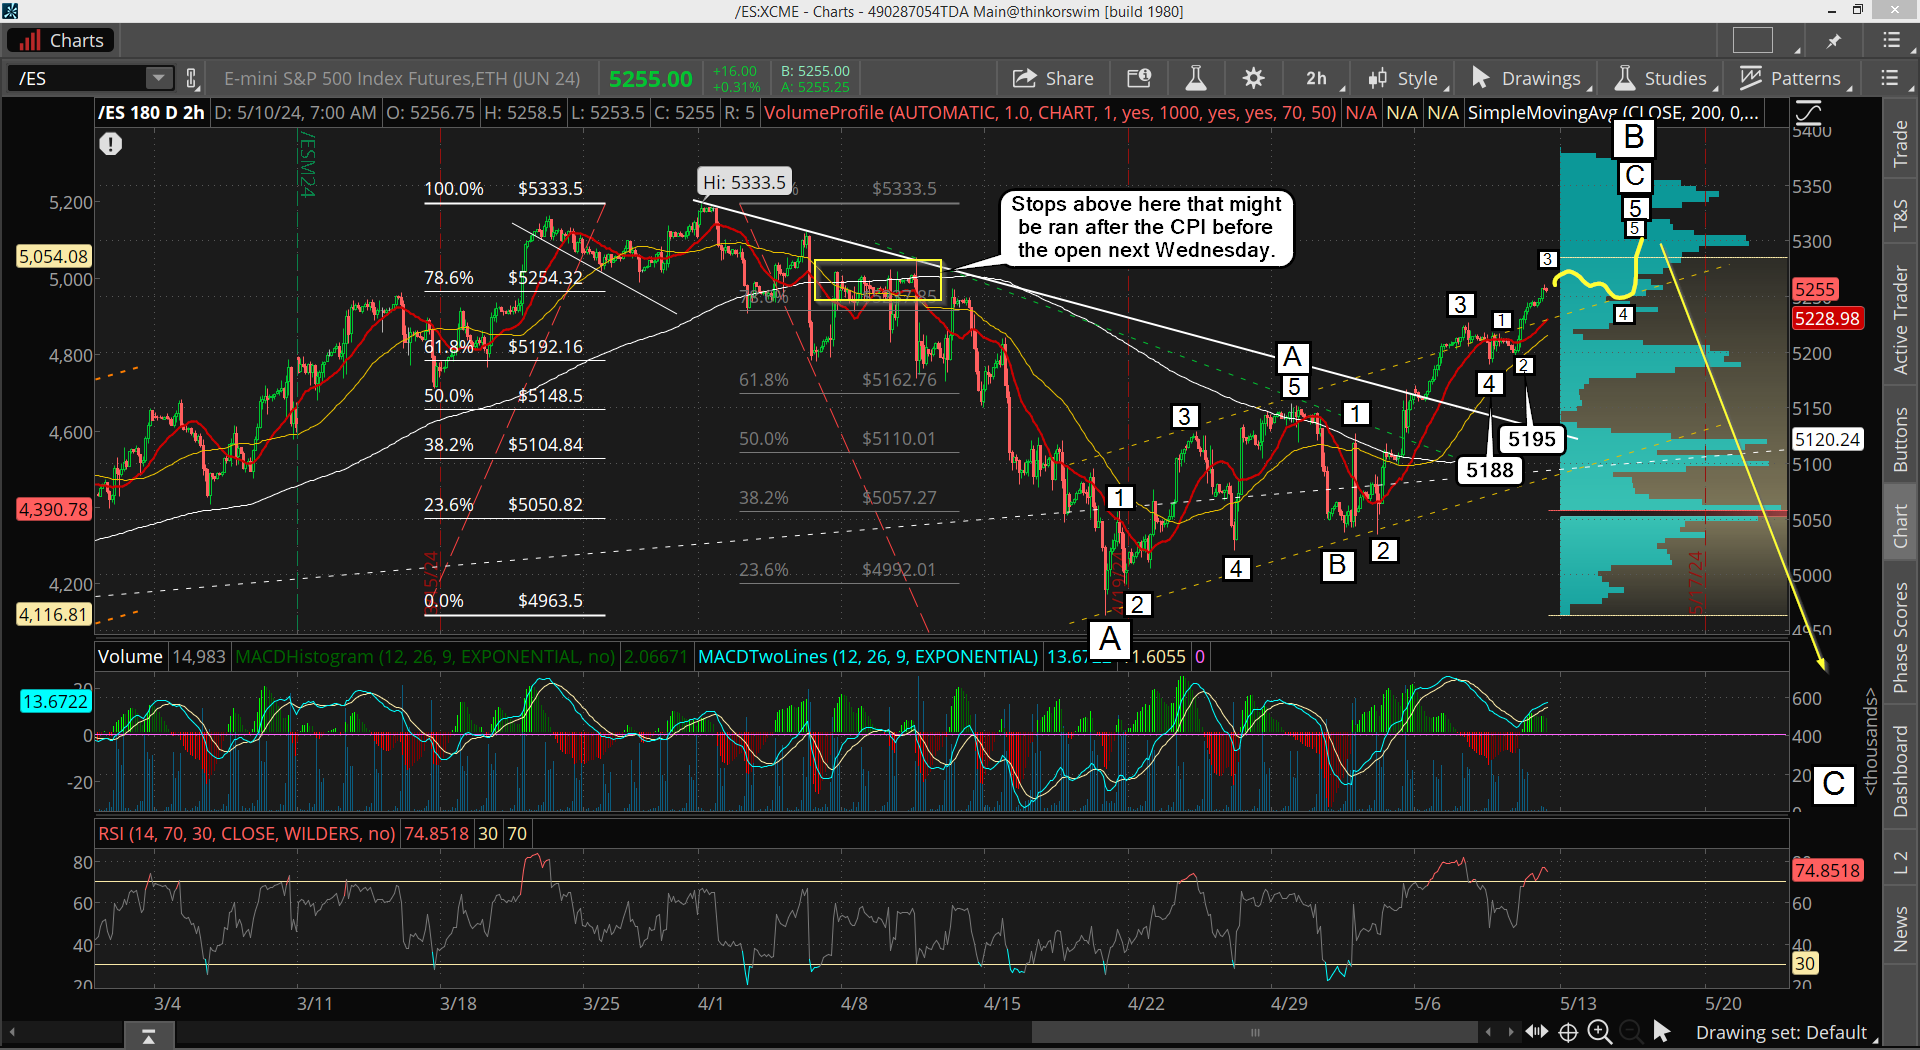
As you can see I've labeled the move up as either completing Tiny Wave 1 up or Tiny Wave 1, 2 and 3 up. Hard to say which but if we go with the market being in Tiny Wave 3 then we should have a little more upside today and likely do an ABC down for Tiny Wave 4 into Wednesday morning. Then the CPI can "run the stops" for Tiny Wave 5 up, which will complete Small Wave 5 inside Medium Wave C of Large Wave B.
If not, then we could be topping today as the Small Wave 5 won't subdivide into next Wednesday and will end today or possibly Monday. It could subdivide, as it's likely that the low on 5/9 before the open at 5195 would be Tiny Wave 2 down, meaning Small Wave 4 ended before the open on 5/8 at 5188... which is what I think is accurate.
I guess I could say that the 5195 low was a "truncated" wave C in an ABC down for Small Wave 4 with the wave A being lower at 5188, and that could be accurate? That would then have the current rally up from the 5195 low being just Tiny Wave 1 inside Small Wave 5 up. That is possibly but it looks more like a wave 3 and not a wave 1, but in the end it's not important if the CPI number is going to be used to put in the last high.
I can go back and figure it out after the fact, so I'm not too worried about it. My goal here is to just let today, Monday and Tuesday play out, as even if we top today and drop into early next week the CPI number will still (very likely) be used to produce a stop run above. Maybe it's only back up to the current high and point lower? If so then we will have a Small Wave 2 up inside Large Wave C down as the pullback in front of it would be Small Wave 1 down from some top today. Either way it looks like next Tuesday by the close or Wednesday morning after the CPI will be the ideal short. That's all the possibilities that I see.
Have a great weekend.


I’m changing up my forecast a little. I don’t think this will be the major decline. $nysi is too high and there isn’t enough time for it to unravel extensively. We should still get a decline down to the 200 day average and the weekly lower Bollinger Band. It might start off a little slow-mo but pick up into the second week. The first down day could be a big one though.
I revised things based on past historical epochs in this time period. It is 666 weeks from the 2011 mini meltdown which was a mid year affair. I also discovered that my birthday had a 666 connection to another historical event and we’re at 2x later as of late April. Which makes…..? Something that I have long considered an ideal date for….
Maybe this decline extends into early June when the Venus Sun inferior conjunction occurs. It is the same location of the great Venus eclipse of the sun 12 years earlier. The Fahrenheit 451 eclipse but the monthly cycle due soon says the bottom should be in earlier. The 41 week cycle (this week) is tied in to the Venus Sun conjunction cycle.
The 20 day ema is approaching the 50 sma day and other inicators are getting into the exhaustive territory that I was looking for.
It’s went a lot higher then I thought it would, that’s for sure. If I didn’t have the FP’s on the SPY I’d be looking for just a higher low in the coming 2-3 weeks. But since I have the FP’s I have to be open for them to be hit on the decline. I think most everyone is given up on a lower low and is just looking for a higher one, like maybe 50% of the rally up?
That could be a good indicator that they will go make a lower low and hit the FP, as now no one is expecting it to happen. As long as the decline isn’t too big or fast in the beginning everyone will keep buying the move down expecting the higher low.
I know that’s exactly what I would do if I didn’t have the FP, but since I have it I think we will hit it on this next pullback. It will be important to see it go slow though as we don’t want anyone to get bearish until it breaks the low and flushes to hit the FP.
Now if it doesn’t happen I’ll have to conclude that Yahoo FP’s aren’t valid and only the one’s I get on Think or Swim are. But I just find it hard to believe that both of those FP’s are not real ones. They only lasted one day and both pointed to the same zone. I haven’t seen anymore of them and I’ve been checking ever day now. So this will be a test for Yahoo, and if it fails I’ll stop looking for them there.