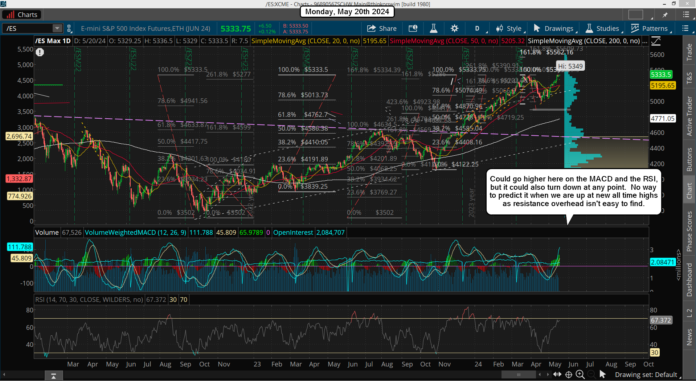
This has been a huge failure for the two FP's on the SPY from the Yahoo site as I'm still scratching my head as to "why" they were put out if they aren't going to hit them. It's been super frustrating to miss this big rally and to short it many times on the way up, only to see it go higher.
I'm sure we will have a pullback soon but with so many bears that are toast now, and all the bulls that missed the move up, it will be bought when it comes. And the technicals are still not overbought on the daily chart yet. That doesn't mean it has too get fully overbought before it pulls back, but it does mean that it could continue higher first before we see any pullback.
However, the 6hr chart is overbought so the upside should be limited now. We can see that is already happening as after the ES made a new high we've just been grinding sideways to slightly up.
I could make a case that it's "basing", making a bull flag, and that is true, but I think for that to work again I'd estimate that we'll need a week or more of "basing" to have another strong breakout leg higher. For example, back on 12/29/21 it went sideways until 1/5/22 to "base", which was after a new all time high too. But it failed to breakout and rolled over to start a year long correction. Now I'm not expecting that to happen again as the technicals aren't the same now as they were back then.
Technicals are closer to the 11/8/21 to 11/29/21 period, which produced a pullback to hit and slightly pierce the 50 day SMA, which is around 5205 currently. So from a technical point of view a pullback to the 5200 zone seems likely, and I think many others are looking at the same scenario. Of course if too many people see the same thing happening then odds are it won't be that simple.
I think I'm dreaming here, or just "wishful thinking" but if everyone buys that zone then we know it must go lower, so maybe it still does go down to the FP? I'm sure that's just a dream but I'm going to just let the technicals talk to me. If and when the 6hr chart gets oversold again I'll look for a strong bounce.
Then I'll look at the daily to see if it's oversold, or if it can go lower. Lastly I'll look at the weekly chart to see what it tells me. Right now it's trying to turn back up, but the moving averages have not done a bullish cross yet. That's not a "must happen" requirement as long as the monthly chart is still bullish and support the market, which it is.
But it's getting extended for sure, and I doubt if it can go more then another 4-6 months. The volume peaked on that chart in March and since then it has been declining. Back in 2021 the volume peaked in August and the market went higher into a top early January of 2022, which was was 4 months basically. If this repeats then we should top in August, September at the extreme, but could top as early as July. It's not some exact pattern that will repeat the same every time but it is a "sign" that the final high is just months away. You can't keep going higher and higher on lower volume forever.
It will end soon, and the average is about 4 months from the highest volume. Now if this month makes another higher high on the volume then that technical pattern will be reset from a March volume monthly high to a new on in May. With still half the month left it could make a higher volume bar, but right it's not happened. I don't have much else to talk about right now as until we get a turn down there's not much to say or do.
Have a blessed day.


