

The market is certainly not giving up easily... but neither am I! It's "do or die" time now, as every chart I can find, on all the different time frames, is now set up for a Wave 3 Down. From the smaller time frames to the larger time frames... we have a whole lot of wave 3's coming up next. That's what I see in Elliottwave term, but I also see the same charts forming Bear Flags from a Technical Analysis standpoint. Let's go over the Technical Analysis first...
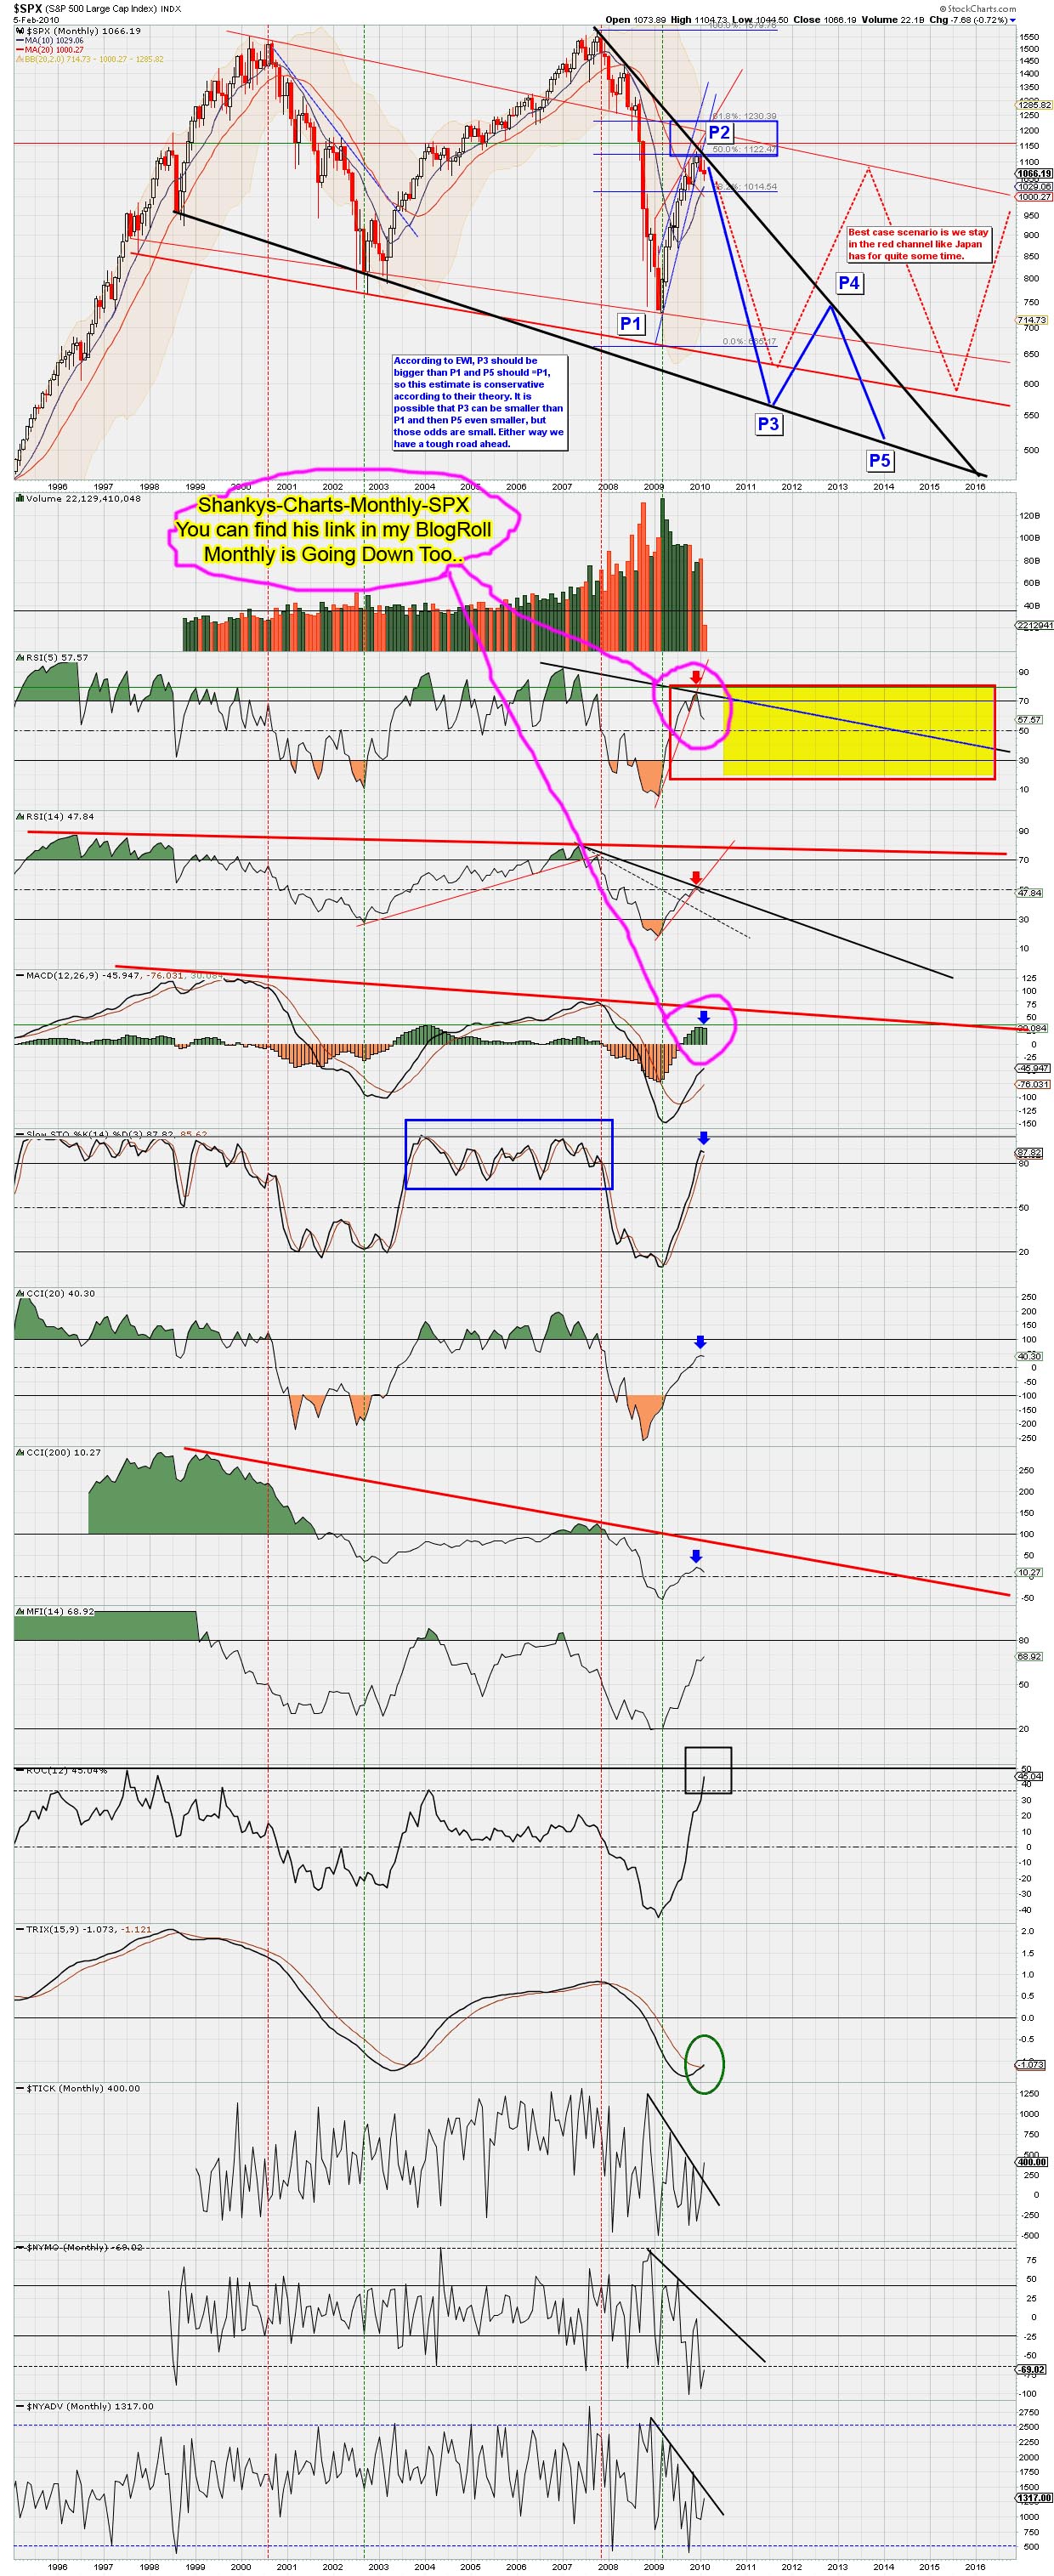
Technical Analysis point of view... first up, the Monthly Chart

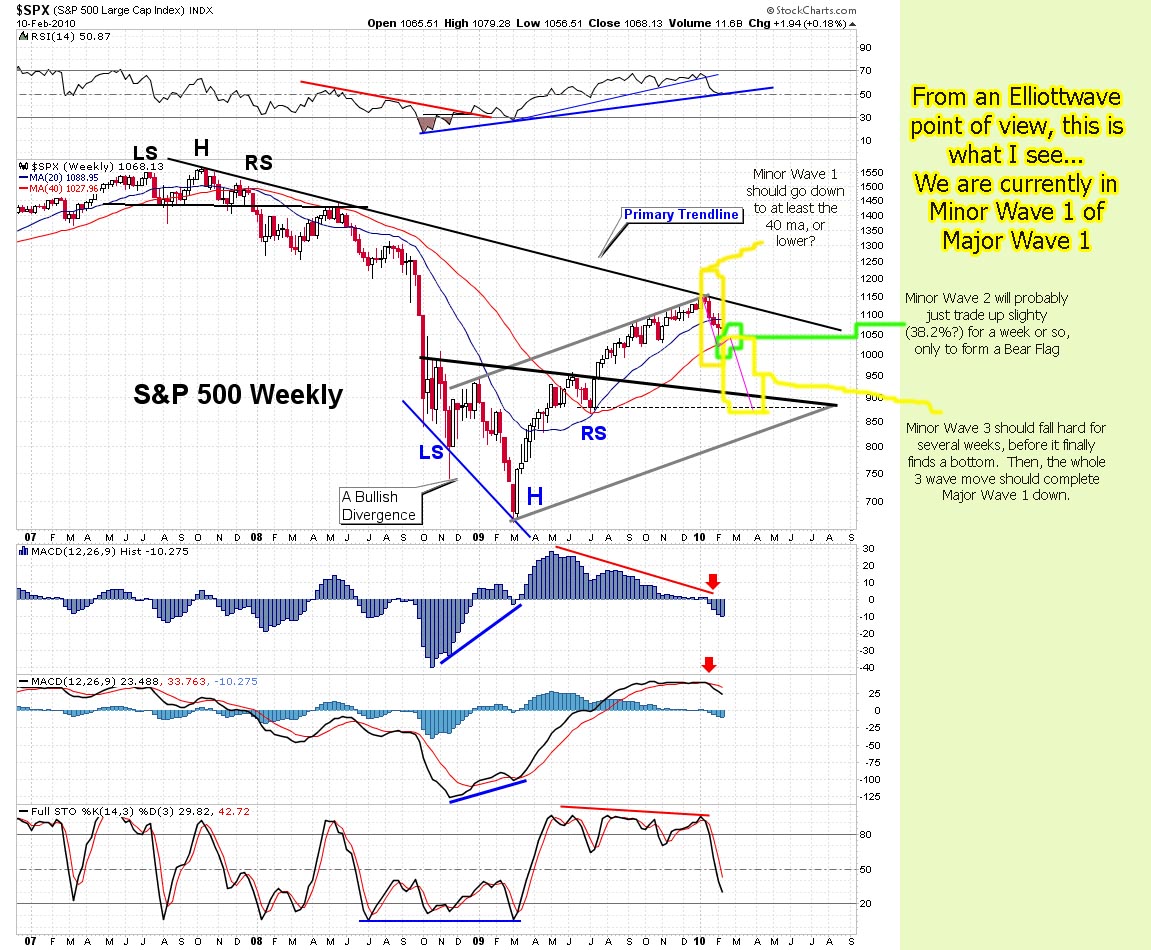
Technical Analysis point of view... second up, the Weekly Chart

Technical Analysis point of view... third up, the Daily Chart

Technical Analysis point of view... fourth up, the 60 Minute Chart

Technical Analysis point of view... last up, the 15 Minute Chart

Now, let's tie all the Technical Analysis charts into Elliottwave, and try to figure out the next move, as well as what wave we are now in?
Elliottwave point of view
The Monthly Chart has us in Primary Wave 3

Elliottwave point of view
The First Weekly Chart has us in Major Wave 1

Elliottwave point of view
The Second Weekly Chart has us in Minor Wave 1

Elliottwave point of view
The Daily Chart has us in Intermediate Wave 3

Elliottwave point of view
The 60 Minute Chart has us in Mini Wave 3

Elliottwave point of view
The 15 Minute Chart has us in Micro Wave 3

So, that means we now are starting down into (from the larger wave to the smaller wave) Wave 3,1,1,3,3,3... Whew! That's a lot of 3's! If you don't know how powerful wave 3's are, go do some research on it and you'll get the big picture. I'll really be excited when they all turn into Wave 3's! That should start this late September, and will truly be a "Once in a Lifetime" experience.
So what's up for tomorrow you ask, and why am I still holding my put spread? Because I'm expecting a move down to at least 1020 to start as early as tomorrow. I must admit that this has been a learning experience for me, as I'm only now starting to see how all this all ties together. I didn't see that last week, and missed several important pieces to the puzzle.
That doesn't mean I'm going to get every call right... of course I can't do that. But, as I learn more and more about how TA's, EW's, and news events... all tie together, I'll start getting much better entry points. I wasn't able to see that last week, and missed out on all these smaller wave patterns developing. I could have waited until today to go short, and would have been in a lot better position.
Now, my current position is underwater due to the time decay, and the small move up. I purchased a 106/101 vertical put spread on Friday when the market was around 106 (spy), and now we've moved up a point, and lost 4 days of time. I would have caved in and sold them for a lost a month ago, when I didn't understand the charts as well as I do today. But not now, as the more I learn, the more patience I become.
Since I'm learning how to read these charts much better, I hope to get a whole lot better entry point in a couple of weeks, when Minor Wave 3 starts down. Timing in this game is everything. The TA's tell me which direction, and then I try to match the EW patterns up to match with that. I believe it's easier now, as we have started a new trend down. During the sideways market time periods, you had might as well throw EW out the window, and use only TA's. But, for now, they are both lining up perfectly.
It's up to you to make your own decision as to "how to trade" this market of course, and I'm only showing you what I see. I was wrong on calling Monday a big down day, and wrong again on Tuesday and Today. This isn't easy you know... if it was, everyone would be rich. I putting more and more pieces of the puzzle together, which should allow me to narrow down the exact time to get in short... at least for the next time I hope.
I do appreciate all you who visit, and I'm glad you have patience with me while I learn. Study the charts above and come to your own conclusion. Let me know what you see... as I see a big down move coming, starting tomorrow most likely.
If I didn't believe in what the charts tell me, I'd have already bailed on my position now. In fact, a week ago I would have! Why? Because I've been studying my ass every day now for the last week, and I've learned a lot more about the market in that short time period then I learned in the last 6 months. Whether I'm right or not, I don't know? But, I feel like I'm able to assemble this puzzle much better today, as everything was scattered out in pieces months ago.
Anyway, I'm just rambling now. Best of luck to all of us tomorrow... and a big thanks goes out from me to all the great chartists that I read regularly (and borrow their charts from them... hope they don't mind?)
Red


Leo,
Nice post.
I can't help but wonder if the start of the drop to 1020 could wait until end of day Friday. That would line up with the New Moon Trade (new moon is Sunday), when I usually load up on TZA.
Futures are running up so far this evening.
You never know exactly when Earl, but the charts I posted above clearly show that we are going down on Thursday. I do expect it to continue into Friday and next week too.
I see the 1044 being tested first, then 1020, 1000, and maybe even 980. Not sure if we will fall that far before opx, but it is possible, if a panic sets in?
So much work went into this post Red. I truly appreciate it as I don't have the time to do the in depth analysis and this really helps me learn. Hopefully the answer really is in the charts. Tomorrow looks at least like it is going to open higher and I guess we'll have to wait and see what happens next.
Thank you Monica…
I normally write my posts in about an hour or so, but this one took me 5-6 hours last night. I would normally do a post like that on the weekend, but we are at a crossroads, and I felt it was really important for people to understand why I'm still extremely bearish.
So, I spent the extra time showing all the reasons why a big sell off is coming ASAP… and will reward those who stay short and ride out the small turbulence.
Thanks for the link to INO. It's been awhile since I watched him. He see's the same thing I see… DOWN.
Red,
I am sorry to say that on Wall Street, white is black and black is white. Market is not going down because crooks are going to squeeze shorts, then same crooks squeeze bulls by pulling markets down. This is a game only a few will win. Tonight, Futures are going up the moment markets closed, you know how it works. They ramp futures huge, shorts pile on covering markets move up, bulls and fund managers jump-in fearing market is taking off. Market moves up another leg. This game is going on for several months, and nothing will stop this game, except a 3 of 3, if there is one to believe.
Good luck…
Fear and in-decision is how they get everyone to bail on their positions… just before they take the market in that direction. I've lost all fear now, as I only listen to what the technical analysis tells me… and that is still that we are going down.
GREAT SITE AND GOO INPUT. I am learning quite a bit from your blog and look forward to trading the same wave with you!!
Thank you Henry, I'm learning too…
Hi Red
Are you no longer expecting a sell off before the weekend then and more upside into Opex next week?
I'm still expecting the sell off Crash. I believe it will start today, and carry over into next week. First target is to retest the 1044 low, then 1020, 1000, and maybe even 980?
At this point, I don't see us going up into opx, as this move down coming will last longer then the 2 days left that we have in this week. It should carry over into next week too.
I appreciate your efforts, but if this doesn't go down it speaks of the effectiveness of technical analysis. I'm not saying throw in the towel but I've seen EW blow up in your face many times. It should….it should….it should….but didn't
I don't use EW as my primary means to trade. I use the TA's first, and then try to see if I can figure out an EW pattern that matches. There is a big difference there….
I still see us selling off hard, and I really expect that to start Thursday. I will post when I'm getting out, and at what level. If we start down today, I might be holding over the weekend. I'll have too see what the charts tell me.
I'm sure those puts you bought are underwater big time now, so just don't panic and sell them too early. Many people sell just as soon as they break even.
As I told you previously, you should have NOT bought straight put with a strike price so far out of the money, but there is hope, as the first target down is 1020, then 1000, and maybe 980? I see the move starting down today, and going until we hit those levels or opx.
If we make it down to 980, and you recover your money (and hopefully make some too), don't ever put straight puts again. Get your account setup so you can do spreads… Please.
So little money. Only one bullet left in my gun. My “research” told me that a steep correction or crashette was imminent. The most bang for your buck when the market crashed is out of the money puts.
What type of spread? do you write options?
I currently have a 106/101 vertical put spread. That means I bought the 106 put and sold the 101. The money I received for the 101 helped finance the cost of the 106. The goal is for the market to go down to 101, and stop by opx. That way, I wouldn't have too buy back the 101's as they would expire worthless, and the 106's would be worth 5 points per contract.
If the move down goes below 101, then I'll have to buy them back. I can't lose money on the 101's as I own the 106's. But, I'm capped at a maximum of 5 points profit. However, that's a safer way to play options then to buy straight puts. Yes, it could go down further, but you never know? So, it's best to do spreads. Hope that makes sense to you?
Hmm. There were comments here yesterday. Anyone eat them?
Comments are still here Earl… refresh your page. This comment I'm now making to you should bring the comment count to 14.
Yes indeed! And Good Morning, Leo.
Good Morning Earl…
I believe the Retail Sales, Job's Number's, and the Greece bailout news will be enough to push this market over the edge today. The elevator should be heading down soon!
From Carl Futia's blog
March S&P E-mini Futures: I am going to bet on an upside breakout today. My range estimate is 1064-1082. If I am wrong and the market spends an hour below 1064 I will conclude that the ES is headed for 1045 before a sustained rally can start. I still expect the 1041 low to hold and think that a move to 1200 is underway.
I made forecasts like that too… before I started putting all the pieces together. We are headed down to at least 920, if not 875 area.
The monthly charts have turned down, and turning them back up is like trying to park a 747 in downtown New York. It's ain't going too happen. Down for several months… 1200 is out of the question for now.
He was right about the breakout, but wrong about the range. Pretty impressive, still.
Something happened. Futures are tanking.
I love it when a plan comes together…
Out of TZA. Running with the money.
Back in TZA at 11.04
I got some at 11.17 and going to add more.
Tic Toc, Tic Toc… time is coming near!
red i hope u got out of your puts this morning
be very very careful things are going to come fast
my volume indicator is registering a 60 pt SPX move coming 1130 or 1010, don't get caught on the wrong side
market is coiled like an snake
nice call
I'm still short, and staying…
don't forget this chart, SPX 3 min gap 1085.89
http://www.flickr.com/photos/47091634@N04/43434…
Me too. I know it will happen but the time decay sucks.
Yes, it sucks… but that's trading. It's never easy. But the charts still say down.
Stopped out of TZA at 10.97
Earl, That was a tight stopped that worked out for you. I am still in, but have not added anymore.
I'm a bit concerned that Carl might be right about a breakout here.
Added Tza at 10.81
In TZA at 10.81, starter
That's scary we are buying at the same price and etf.
Must be a good idea 🙂
I plan to add at 10.70 if it gets there
Earl, SI at 10.66.
I had S1 at 10.69 (calculated manually, so might be off)
Next add at 10.56
I wanted it to go down!
Is this a good example where fundementals (Greece) override technicals? It seems you can't take your eye off the fundementals.
this is the 3rds “Greece is ok” rally. Haven't gotten far up
I can kiss my ass goodbye
This run up is clearly a short squeeze on the bears. I know it's tough hanging in, and hoping for a fall, so I don't blame anyone who bails… but I'm staying.
We still have a Big Bear Flag on the Daily chart, with 5 days of sideways to slightly up movement from last Thursdays' big sell off. When this move breaks to the downside, the move will be just as large…
Trading isn't for the emotional person. I know that because I used too sell out during shake out times like this. I let my emotions dictate my trading. I stick with my TA's now, and they are telling me that this is just a back test of the upper trend line on the daily chart.
I still see us falling soon… it will come.
Leo,
Nerves of steel, man 🙂
Earl, If vix goes below 24 I am bailing
Gcocks,
Interesting. I've never traded (bought or sold) based on the VIX.
Just Added TZA at 10.56
I think you're a bit early. I'm waiting until I see this pennant finish, followed by short squeeze to consider any sort of short. 1092 is within the realm of possibility.
You were right on that call Dreadwin… I missed it, and got in early. But, I'm still holding short.
dreadwin,
I also think I'm a bit early. End of day gyrations are a big concern. Unless we go down 🙂
We're at 24.03 right now. Hold tight, this might be a fake out. If the previous high of the day gets taken out for more than 15 minutes, it might be a real move.
Thanks, Dread I have not sold anything yet.
Hey Leo.
$VIX action is playing out pretty much as I expected. We seem to be painting out a pennant. As we head into close, I expect the MM's to engineer a nasty squeeze.
for those with bearish positions the market should turn down here if we're going lower, fate will be determined shortly
http://www.flickr.com/photos/47091634@N04/43494…
Nice chart
Thanks Sun… I think we are at the top now.
update 2:30 est
hourly just printed a slight violation per the earlier chart i posted
will need a close on the SPY below 108.06 by 3:30 otherwise the markets have left the station for good
a breach of 1085.89(SPX 3 min gap) will open the door to 1104 and a breach of 1104 will equal 1127.38 (60 min gap from 1/21/2010)
Sun, Thanks for the update
update 3:30 est
per my 2:30 update SPY 108.06 level was the line in the sand for the 3:30 print and actual SPY 3:30 print was 107.96 so market is still contained
6-9 pt SPX move is likely during the final 30 minutes
This Bear squeeze is really hurting my puts, but I'm hanging in here. That 1080 area is the top of the downward sloping channel on the daily charts, and that's what I'm looking for to hold back the bulls.
This rally is all retail traders buying on the Greece bailout news. No Big Institutions are participating in this rally. When will they come in? I don't know, but it needs to be soon…
I will cover if we get to 1092
I'm inclined to agree with you Monica. Still holding… for now!
Sold my SPG calls (mostly broke even). In TZA calls.
$VIX closed above 24, by a hair. I think the $VIX goes back up to flirt with the 200 MA tomorrow, and closes the week there. This would provide minimal direction for market participants, and let their options die a slow death over the long weekend (markets are closed Monday for Presidents day).
Just another Bear frattin', if you know what I mean.
a flat last 30 minutes means a 6-9 pt gap is coming
here's an update to a chart i posted earlier
you'll see a gap is how this dancing gets resolved
http://www.flickr.com/photos/47091634@N04/43497…
That's interesting. The question is which way?
a gap down will mean they'll close the SPY @ 107.15 for the week and a gap up means they'll close the SPY @ 109.68
all this dancing for the last 5 months is because of the crash gap created back on the first week of oct. 2008
http://www.flickr.com/photos/47091634@N04/43490…
we currently have 2 consecutive gap downs on the SPY so a 3rd in a row tomorrow would be too much of a tell for the coming gap on tuesday because the SPY rarely ever gaps down 4 straight days
Sun, I appreciate your information. Thanks
TNA closed up 5.0% today.
Volume today for TNA was normal.
We are in a Full Moon Trade, generally positive for TNA.
This trade ends at the close tomorrow.
[ After ten days, the trade is DOWN 1.4% ]
Tony (man has no last name) says this Full Moon bullishness is canceled out by the Jan 15th Solar Eclipse, creating a Panic Cycle. His Panic Cycle seems played out (particularly today), but runs until the close tomorrow.
RVX (VIX for RUT) fell all day, closing 8.6% lower.
Based on the very large green candle today, closing near the high, there looks to be more upside for TNA tomorrow. (Looks lately have been the opposite of what actually happens)
“Looks lately have been the opposite of what actually happens” …ain't that the truth!
World events dominate 🙂
Earl, What are you in now? I have a position in TZA with cost of 10.93. I might add a little more.
I have TZA at $10.67 average. I am trying to buy more at $10.22, which is the bottom of the unfilled gap below the close. It hit once already, and might hit again.
Boy, I did not see that drop coming today. Maybe I will put a limit order in for some. I think it is interesting that dread is doing calls.
Gcocks,
Seems you have to be on top of your game (other than the earnings announcements) to use calls.
Calls on TZA has got to be exciting. I'm already fairly excited without them 🙂
I somehow feel better holding TZA knowing he has calls on them.
I agree, That gives me some comfort also. On my chart I did not see it dip to 10.22.
5:00-5:05 PM Eastern, low of 10.21
no?
Not according to GOOG's chart. I saw it hit as low as 10.25. Anyway, the AH session is closed. Did you add more TZA?
It just ramped higher after that low point, so I ended up not getting any after hours.
Might be able to get it cheaper that that tomorrow morning. Never know.
Earl and Dread,
I see a gap to fill on TZA. on 2-3 closed at 10.23 and on 2-4 it opened at 10.46. If it hit 10.21 and 10.25 AH does that quailify as filling that gap?
Nope. Market has to be open for a gap to be considered filled.
Thanks, I did not know that, Ever watch Johnnie Carson show? He used to say that “I did not know that” to ed all the time.
Actually, I do remember. And, since Johnny is no longer saying that, seems no one says it. He kind of owns the phrase, until a new generation comes along.
Well, I'm glad you feel better about that 🙂 I think tomorrow's maximum TZA price is 10.77. See my other comment for chart and reasoning.
TZA looked really beaten down, and I was able to grab calls near the LOD. Annoyingly, it has gone down even more in AH. Still, I think I got a pretty good price.
If I can find some time, I'll do a chart.
Thanks Dread
Chart posted!
Great post Red – love how you tied this all together !!!!!
Can you share how you are “learning” this ?
School of hard knock…
LOL 🙂
Is there a book / reference etc that you use to tie these charts together for the MACD, stochs etc knowing what to look for on the weekly etc to predict what will happen on the daily ?
TIA …
No girl, just lot's of studying other people's charts, and reading their blogs. Plus watching video's… the chart pattern trader is great at teaching. His link is in my blogroll. Check him out… he's goodl
Red, there is no easy way to learn it.
LOL… How true is that my friend!
OK – will check him out 🙂
Any other videos of people great at teaching ?
He's about the best one I've seen, but there might be other's that I haven't heard of?
From Tony's site, but this ain't Tony, so it's no-name guy:
I am short and increased my short position at the close. I am calling for a pullback into the channel and trade below 106.50 tomorrow. Tony will have more to say but I suspect it will include a move down beginning tomorrow or Tuesday at the latest.
Yesterday, I posted a couple of charts about $VIX and $RUT. I predicted the $VIX would go down, which meant that $RUT would need to spike up.
(yesterday's $RUT) http://www.screencast.com/users/dreadwin/folder…
As you can see, I'm big on fractals playing out. This one looks like the Nov. fractal (until it doesn't). Tomorrow?
http://www.screencast.com/users/dreadwin/folder…
'big white candle' is followed by 'itty bitty candle' with a higher low and a similar close. From Yahoo's historical data, I have determined that the low of 'itty bitty candle' is 1.3% lower than the closing high of 'big white candle'. Applying this to today's TZA closing price suggests that tomorrow's maximum TZA price is 10.77. If the fractal plays out, if this isn't P3, etc. etc. etc.
I bought calls in TZA today (Feb. 11 strike) for $0.27 per contract. I've programmed my sell order for $0.38 per contract.
Dread, thanks, I would be happy at 10.77 tomorrow. I may pick up some in the am to bring my average down.
Okay I like the viagra reference, still laughing from when I opened the second chart. Kind of like the little engine that could. Why do you think rut had such a great day today. I also notice several gaps on my two day chart on Rut.
Yesterday I noted that for the fractal to play out, $RUT really needed to get going. Hence the viagra reference.
The dollar was fairly strong today, which works out well for $RUT.
Red,
When market is not doing the way it is supposed to, one must understand there is something else going on.
My view is that this market is not going down because so many of us thought we nailed the top and positioned on the short side. I have never seen this many retail investors loading up with short ETFs and waiting for market to fall. You notice this pattern at every blog as everyone is a bear. Big guys know all this and sure to squeeze all bears out of market. IMO, this market is going to new high based on prevailing bearish sentiment.
Another point I noticed is Goldman and other big guys follow Elliott Wave Prechter and his team just to know what bears are saying. For example, if Elliott Wave guys say market should not cross a certain level that is where exactly Wall street crooks take market just to squeeze out bears. This is happening often because after Lehman collapse Wall Street is just one firm show, that is Goldman. If Goldman is not positioned on short side then market is not going down. No wave theory is going to work, please understand this and never bet your farm based on convincing charts.
Well… at least it's only a small farm. I can always go on welfare, and live off the crooks for awhile. LOL
Michigan-How do you know what GS is doing?
Everyone knows and GS CEO admitted that they are doing God's work, meaning if they don't manipulate market America is in trouble (which I disagree). America is never in trouble because of stock market. America will be in trouble if banksrters and politicians are unchecked.
Here is another news today about GS trading software that can be sued for market manipulation…
“Sergey Aleynikov, the former Goldman programmer, who was arrested by the FBI in July last year on virtually a day's notice after Goldman told the FBI the Russian had stolen secrets that could be used to manipulate markets, has just been indicted on charges he stole computer codes used for proprietary high-frequency trading programs. The specific charges include theft of trade secrets, transportation of stolen property in interstate and foreign commerce and unauthorized computer access.”
So, this is public news now. GS only can keep market manipulation software.
MID-DAY MINUTE BY MIKE PAULENOFF:
By Mike Paulenoff, http://www.MPTrader.com
The headline in the WSJ (online) reads: “EU Leaders Agree on Support for Greece,” but the sub-header tells us that “Euro-zone countries will provide coordinated action if needed to preserve stability.” Ok, then… Let's look at the reaction of the Euro to this “agreement” to provide a financial assistance package to Greece: where IS the reaction? I certainly don't see one. Technically, EUR/USD remains in its 5-session range between Fri.'s low at 1.3585 and the high for the recovery rally at 1.3840, which right now has the look and feel of a sideways, bearish congestion area ahead of downside continuation. Bullish for the PowerShares DB US Dollar ETF (UUP). At this juncture, only a sustained climb above 1.3840/50 will trigger initial signals that a near-term low is in place. Otherwise, the EUR/USD likely will head considerably lower, which WILL get the attention of EU leaders AGAIN, and will compel them to actually DO something. Unfortunately, politicians ONLY spring into action WHEN FORCED — and that usually occurs when the markets are into panic mode. Let's see when that starts, with the EUR plunging towards 1.3400.
what I'm getting at is a lower Euro “usually” correlates with a lower S&P
Also, A lower Euro with a low volume rallies in stocks doesn't place much confidence in the Greece job.
If the retail sales comes out rotten. could get a big downday?
Would they finally get the Greece thing fixed over the 3 day weekend and then we rally big? Toni Hanson states the market tends to change direction at 2pm, as it did last friday. Will we change direction tomorrow at 2pm for a rally into tues?.
I've read in one of Red's sites that friday before Presidents day has a 80% chance of neg close for the day.
Thanks, Nice insight
We tend to believe what we see so be careful what you look at. You must in fact restrict what you look at in order to be successful.
Roguewave
Red,
Please comment on the following:
1) Goldman CEO admitted that they are doing God's work.
2) Goldman trading software that can be used for market manipulation…today's news is …
“Sergey Aleynikov, the former Goldman programmer, who was arrested by the FBI in July last year on virtually a day's notice after Goldman told the FBI the Russian had stolen secrets that could be used to manipulate markets, has just been indicted on charges he stole computer codes used for proprietary high-frequency trading programs. The specific charges include theft of trade secrets, transportation of stolen property in interstate and foreign commerce and unauthorized computer access.”
That's old news now. The market does care that Goldman is cheating… they are too.
We tend to believe what we see so be careful what you look at. You must in fact restrict what you look at in order to be successful.
Roguewave
MID-DAY MINUTE BY MIKE PAULENOFF:
By Mike Paulenoff, http://www.MPTrader.com
The headline in the WSJ (online) reads: “EU Leaders Agree on Support for Greece,” but the sub-header tells us that “Euro-zone countries will provide coordinated action if needed to preserve stability.” Ok, then… Let's look at the reaction of the Euro to this “agreement” to provide a financial assistance package to Greece: where IS the reaction? I certainly don't see one. Technically, EUR/USD remains in its 5-session range between Fri.'s low at 1.3585 and the high for the recovery rally at 1.3840, which right now has the look and feel of a sideways, bearish congestion area ahead of downside continuation. Bullish for the PowerShares DB US Dollar ETF (UUP). At this juncture, only a sustained climb above 1.3840/50 will trigger initial signals that a near-term low is in place. Otherwise, the EUR/USD likely will head considerably lower, which WILL get the attention of EU leaders AGAIN, and will compel them to actually DO something. Unfortunately, politicians ONLY spring into action WHEN FORCED — and that usually occurs when the markets are into panic mode. Let's see when that starts, with the EUR plunging towards 1.3400.
what I'm getting at is a lower Euro “usually” correlates with a lower S&P
Also, A lower Euro with a low volume rallies in stocks doesn't place much confidence in the Greece job.
If the retail sales comes out rotten. could get a big downday?
Would they finally get the Greece thing fixed over the 3 day weekend and then we rally big? Toni Hanson states the market tends to change direction at 2pm, as it did last friday. Will we change direction tomorrow at 2pm for a rally into tues?.
I've read in one of Red's sites that friday before Presidents day has a 80% chance of neg close for the day.
Thanks, Nice insight
Red,
When market is not doing the way it is supposed to, one must understand there is something else going on.
My view is that this market is not going down because so many of us thought we nailed the top and positioned on the short side. I have never seen this many retail investors loading up with short ETFs and waiting for market to fall. You notice this pattern at every blog as everyone is a bear. Big guys know all this and sure to squeeze all bears out of market. IMO, this market is going to new high based on prevailing bearish sentiment.
Another point I noticed is Goldman and other big guys follow Elliott Wave Prechter and his team just to know what bears are saying. For example, if Elliott Wave guys say market should not cross a certain level that is where exactly Wall street crooks take market just to squeeze out bears. This is happening often because after Lehman collapse Wall Street is just one firm show, that is Goldman. If Goldman is not positioned on short side then market is not going down. No wave theory is going to work, please understand this and never bet your farm based on convincing charts.
Michigan-How do you know what GS is doing?
Everyone knows and GS CEO admitted that they are doing God's work, meaning if they don't manipulate market America is in trouble (which I disagree). America is never in trouble because of stock market. America will be in trouble if banksrters and politicians are unchecked.
Here is another news today about GS trading software that can be sued for market manipulation…
“Sergey Aleynikov, the former Goldman programmer, who was arrested by the FBI in July last year on virtually a day's notice after Goldman told the FBI the Russian had stolen secrets that could be used to manipulate markets, has just been indicted on charges he stole computer codes used for proprietary high-frequency trading programs. The specific charges include theft of trade secrets, transportation of stolen property in interstate and foreign commerce and unauthorized computer access.”
So, this is public news now. GS only can keep market manipulation software.
Well… at least it's only a small farm. I can always go on welfare, and live off the crooks for awhile. LOL
Yesterday, I posted a couple of charts about $VIX and $RUT. I predicted the $VIX would go down, which meant that $RUT would need to spike up.
(yesterday's $RUT) http://www.screencast.com/users/dreadwin/folder…
As you can see, I'm big on fractals playing out. This one looks like the Nov. fractal (until it doesn't). Tomorrow?
http://www.screencast.com/users/dreadwin/folder…
'big white candle' is followed by 'itty bitty candle' with a higher low and a similar close. From Yahoo's historical data, I have determined that the low of 'itty bitty candle' is 1.3% lower than the closing high of 'big white candle'. Applying this to today's TZA closing price suggests that tomorrow's maximum TZA price is 10.77. If the fractal plays out, if this isn't P3, etc. etc. etc.
I bought calls in TZA today (Feb. 11 strike) for $0.27 per contract. I've programmed my sell order for $0.38 per contract.
Okay I like the viagra reference, still laughing from when I opened the second chart. Kind of like the little engine that could. Why do you think rut had such a great day today. I also notice several gaps on my two day chart on Rut.
Yesterday I noted that for the fractal to play out, $RUT really needed to get going. Hence the viagra reference.
The dollar was fairly strong today, which works out well for $RUT.
Dread, thanks, I would be happy at 10.77 tomorrow. I may pick up some in the am to bring my average down.
From Tony's site, but this ain't Tony, so it's no-name guy:
I am short and increased my short position at the close. I am calling for a pullback into the channel and trade below 106.50 tomorrow. Tony will have more to say but I suspect it will include a move down beginning tomorrow or Tuesday at the latest.
Great post Red – love how you tied this all together !!!!!
Can you share how you are “learning” this ?
School of hard knock…
LOL 🙂
Is there a book / reference etc that you use to tie these charts together for the MACD, stochs etc knowing what to look for on the weekly etc to predict what will happen on the daily ?
TIA …
No girl, just lot's of studying other people's charts, and reading their blogs. Plus watching video's… the chart pattern trader is great at teaching. His link is in my blogroll. Check him out… he's goodl
OK – will check him out 🙂
Any other videos of people great at teaching ?