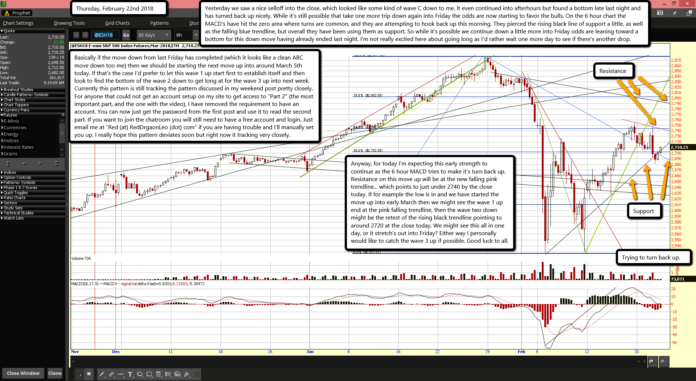
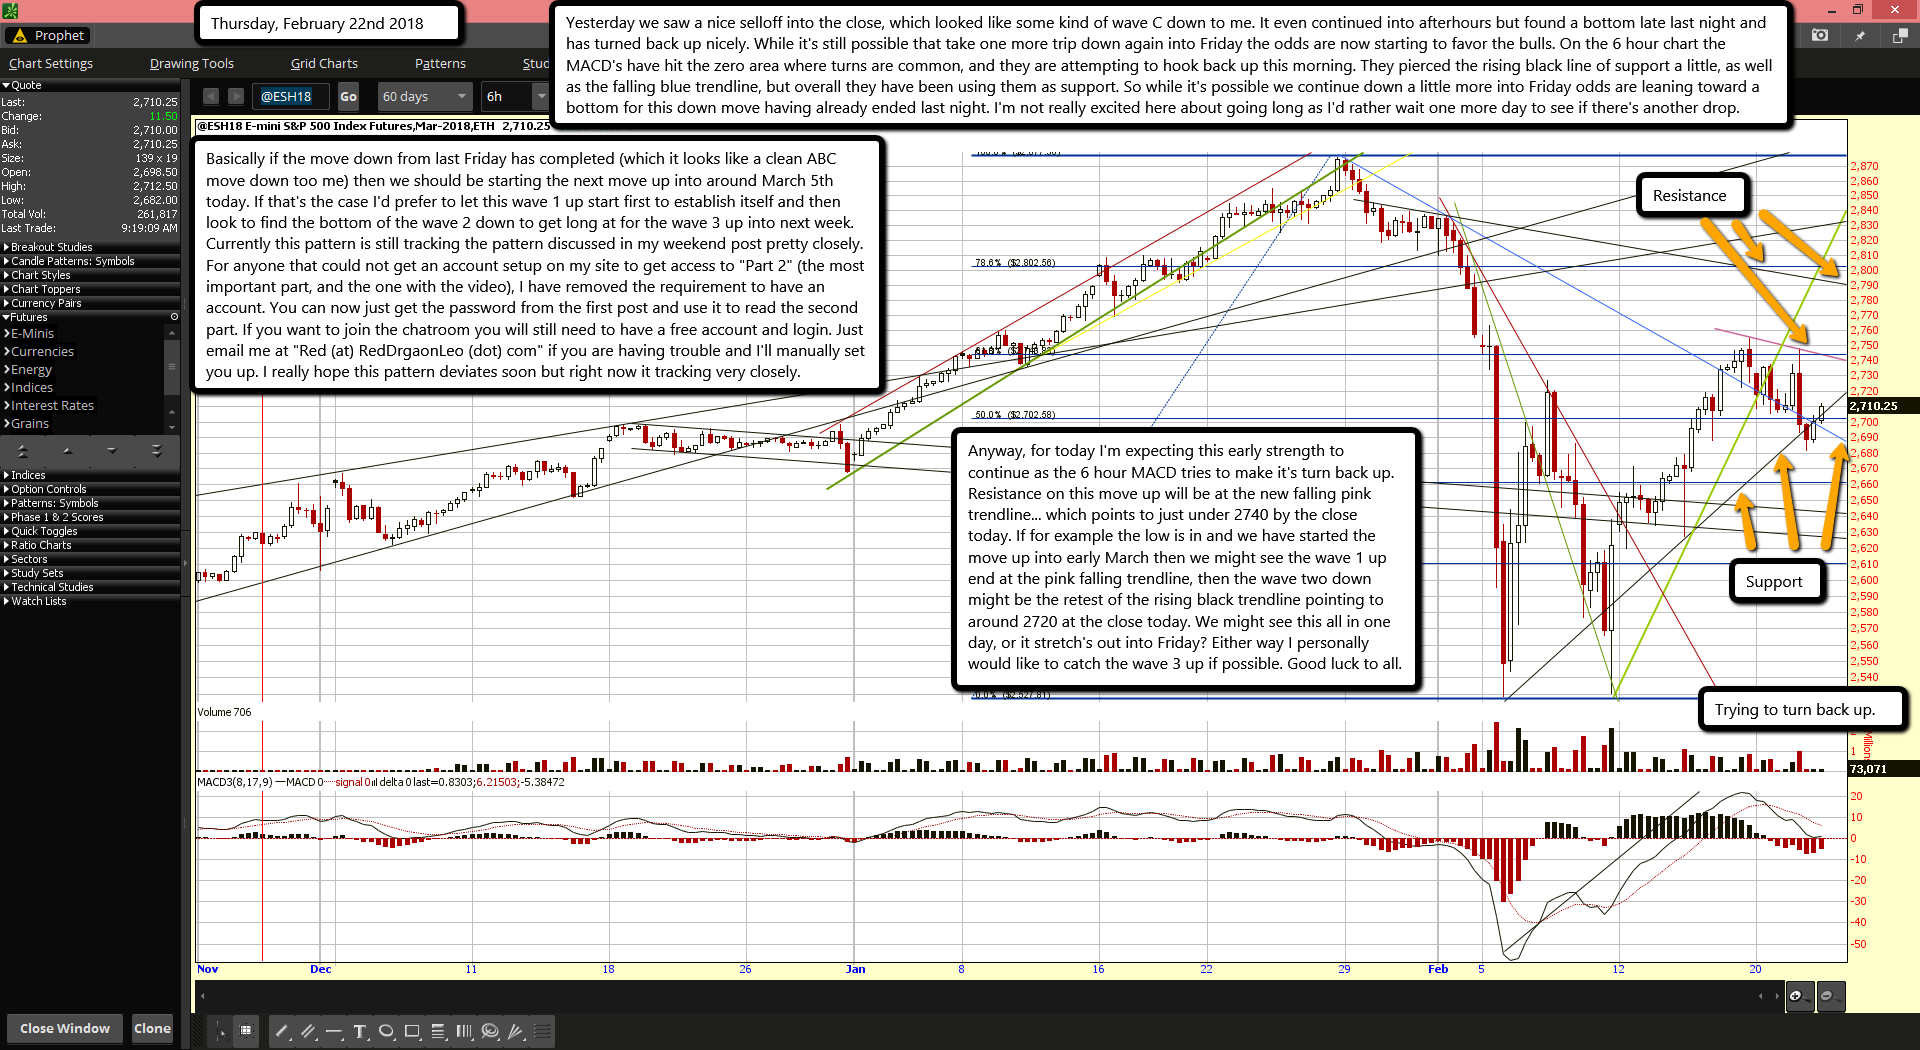
Yesterday we saw a nice selloff into the close, which looked like some kind of wave C down to me. It even continued into afterhours but found a bottom late last night and has turned back up nicely. While it's still possible that take one more trip down again into Friday the odds are now starting to favor the bulls. On the 6 hour chart the MACD's have hit the zero area where turns are common, and they are attempting to hook back up this morning. They pierced the rising black line of support a little, as well as the falling blue trendline, but overall they have been using them as support. So while it's possible we continue down a little more into Friday odds are leaning toward a bottom for this down move having already ended last night. I'm not really excited here about going long as I'd rather wait one more day to see if there's another drop.
Basically if the move down from last Friday has completed (which it looks like a clean ABC move down too me) then we should be starting the next move up into around March 5th today. If that's the case I'd prefer to let this wave 1 up start first to establish itself and then look to find the bottom of the wave 2 down to get long at for the wave 3 up into next week. Currently this pattern is still tracking the pattern discussed in my weekend post pretty closely. For anyone that could not get an account setup on my site to get access to "Part 2" (the most important part, and the one with the video), I have removed the requirement to have an account. You can now just get the password from the first post and use it to read the second part. If you want to join the chatroom you will still need to have a free account and login. Just email me at "Red (at) RedDrgaonLeo (dot) com" if you are having trouble and I'll manually set you up. I really hope this pattern deviates soon but right now it tracking very closely.
Anyway, for today I'm expecting this early strength to continue as the 6 hour MACD tries to make it's turn back up. Resistance on this move up will be at the new falling pink trendline... which points to just under 2740 by the close today. If for example the low is in and we have started the move up into early March then we might see the wave 1 up end at the pink falling trendline, then the wave two down might be the retest of the rising black trendline pointing to around 2720 at the close today. We might see this all in one day, or it stretch's out into Friday? Either way I personally would like to catch the wave 3 up if possible. Good luck to all.


