Tuesday, September 22, 2026
Home Blog

Is 2018 Setting Up A Stock Market Crash Or Inflationary Based Mega Rally?

0

February 18th 2018

A Strange Pattern Is Developing and so far I don't see anyone talking about it...

It's been over a year, maybe several years, since I've done a weekend post and video but I feel compelled to share what I've discovered recently. It's something I hope doesn't play out but so far is tracking out day to day almost perfectly.

Of course there are just as many diehard bears out there that are still calling for a stock market crash today, tomorrow, or soon... just like they have been for many years now. And there's the mega-bulls that are looking for the DOW to hit 100,000 or some crazy number. Which one is right, or are they both right? So far the crash callers have been wrong time after time as the market just keeps on going up and up and up.

The market has changed a lot in the last 18 years I believe with computer algorithms making up 84% of the trading each day, and with the Fed's injecting trillions of dollars into the system with one Quantitative Easing program after another to keep the market going up. That's at least until recently as they are now slowly rising interest rates and attempting to reverse the money injection, which some say caused the recent 10.8% drop in late January into February.

Others say that it was caused because Jerome Powell replaced Janet Yellen as the new Federal Reserve Chairman and the deep state that runs the stock market didn't like it... therefore they decided to tank the market to punish Trump for his decision. Some say he isn't Jewish as well and that the deep state always put a Jew in office as they are "one of them" and can be controlled. I don't know what to believe about that issue but certainly the market was super overbought from a technical point of view and needed to pullback anyway. The timing of it was and still is suspicious.

Anyway, what I have to show you deals with "codes" and "numerology" that the deep state (the elite, illuminati, cabal, skull and bones society, free masons, or whatever name they hide under?), use to tell their buddies on the inside what's going to happen next in the market. Now a true member (which I'm NOT) could read these codes perfectly and know exactly what's coming next, when it's coming, and when it ends... but I have to just guess at it and use the knowledge I've discovered over the last 9 years while writing this blog.

So, with that preface I must add that there is a super computer "AI" (artificial intelligence... I call it "SkyNet" from the Terminator movie) that reads every post, page, blog, website, tweet, chat, etc... on the internet and if certain things are said that "they" (the elite) don't like then it tends to get no traffic or worst the site gets attacked by "bot's" to slow it down to a point that no one can get it to load where they can read. In fact, SkyNet even watches youtube video's and converts them from speech to text so it can decide again if it gets traffic exposure or not.

Therefore I have to be careful on exposing this information to SkyNet as I only want to help a few fellow traders by giving them what I've discovered so they can be on the look out for it and not get caught on the wrong side of the trade should this actually happen? In order to keep this information away from SkyNet reading it I've decided to password protect it and require a real person to login to my site to get access to the password so they can read it. I apologize to those of you who think is too much trouble but I really must keep this information only in the hands of real people and NOT spread over the internet where SkyNet can read it easily. So I ask you NOT to copy the text or the video and repost it on the internet. It's free to view for all, so that's not too much to ask of you I think. I'm also putting the video up on Wistia instead of Youtube so hopefully it goes unnoticed by SkyNet.

To read the rest of this post and view the video you must create a new account and login to get access to the passworded page... which is located here:

Is 2018 Setting Up A Stock Market Crash Or Inflationary Based Mega Rally-Part 2

https://reddragonleo.com/2018/02/19/is-2018-setting-up-a-stock-market-crash-or-inflationary-based-mega-rally-part-2/

The password is: 1987
 

ES Morning Update September 18th 2026

0

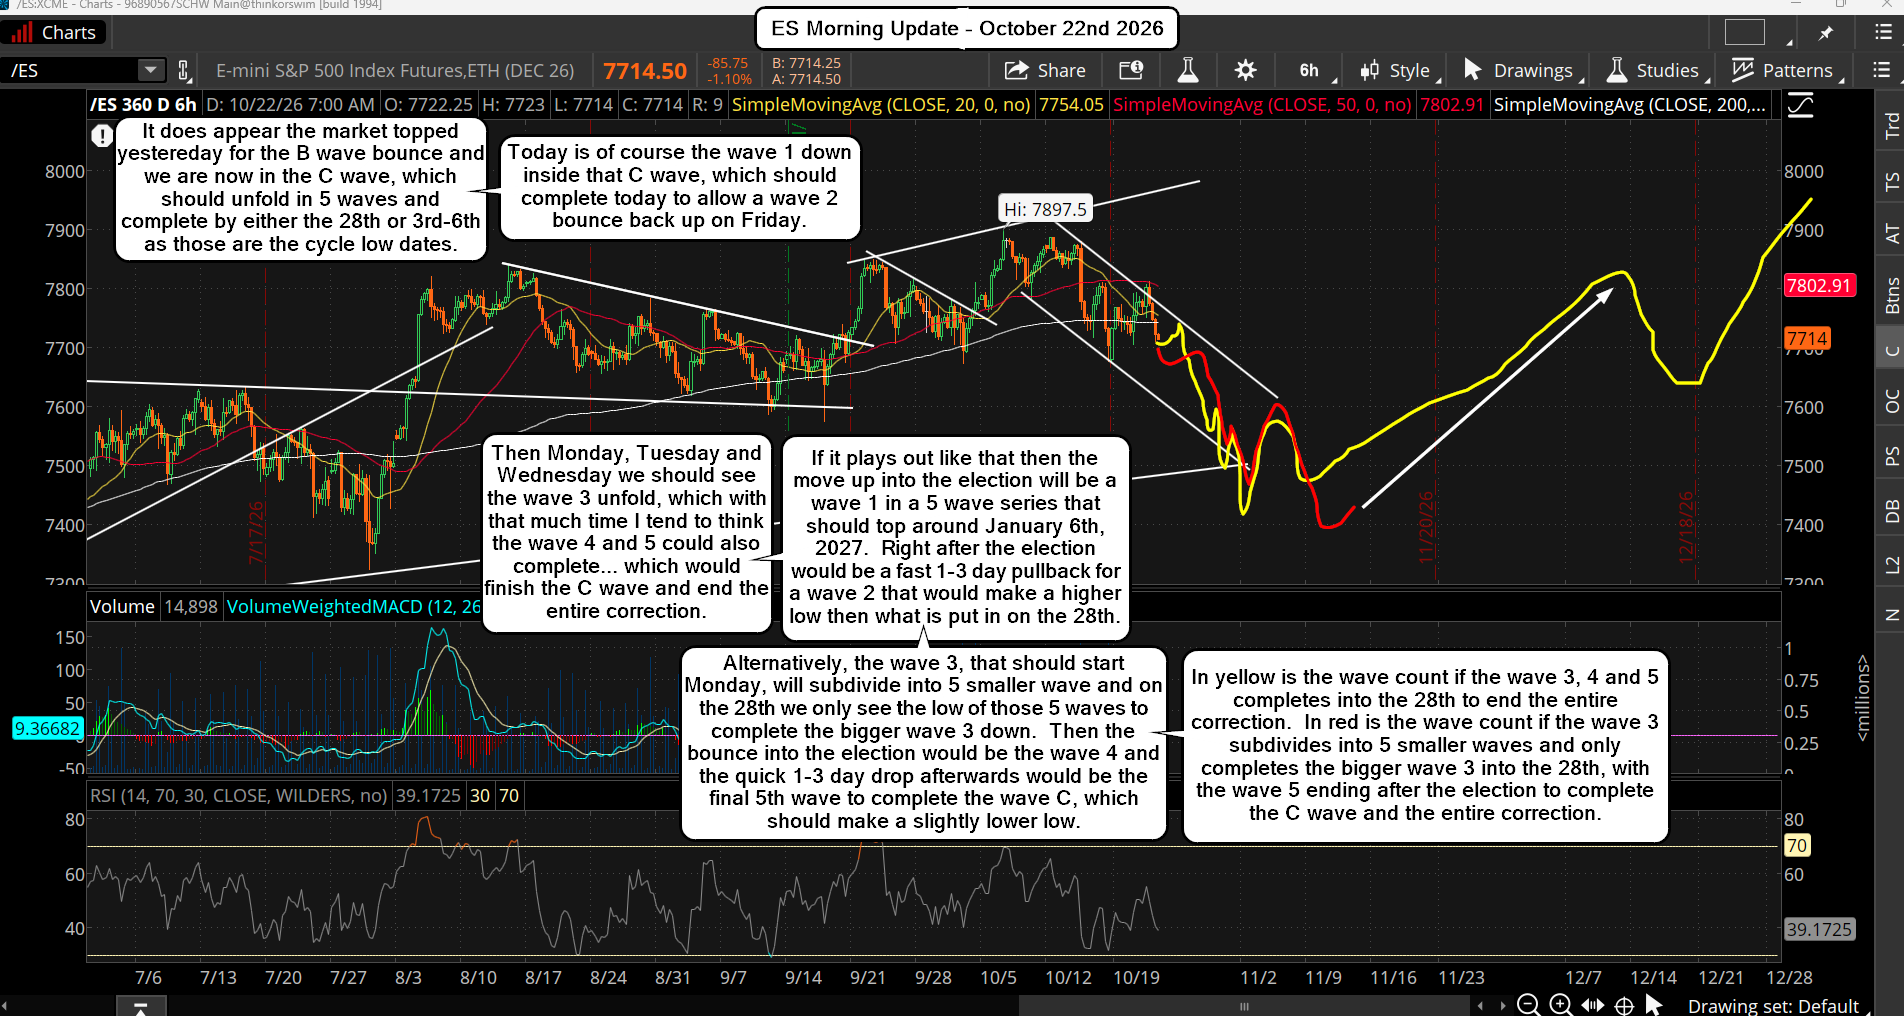
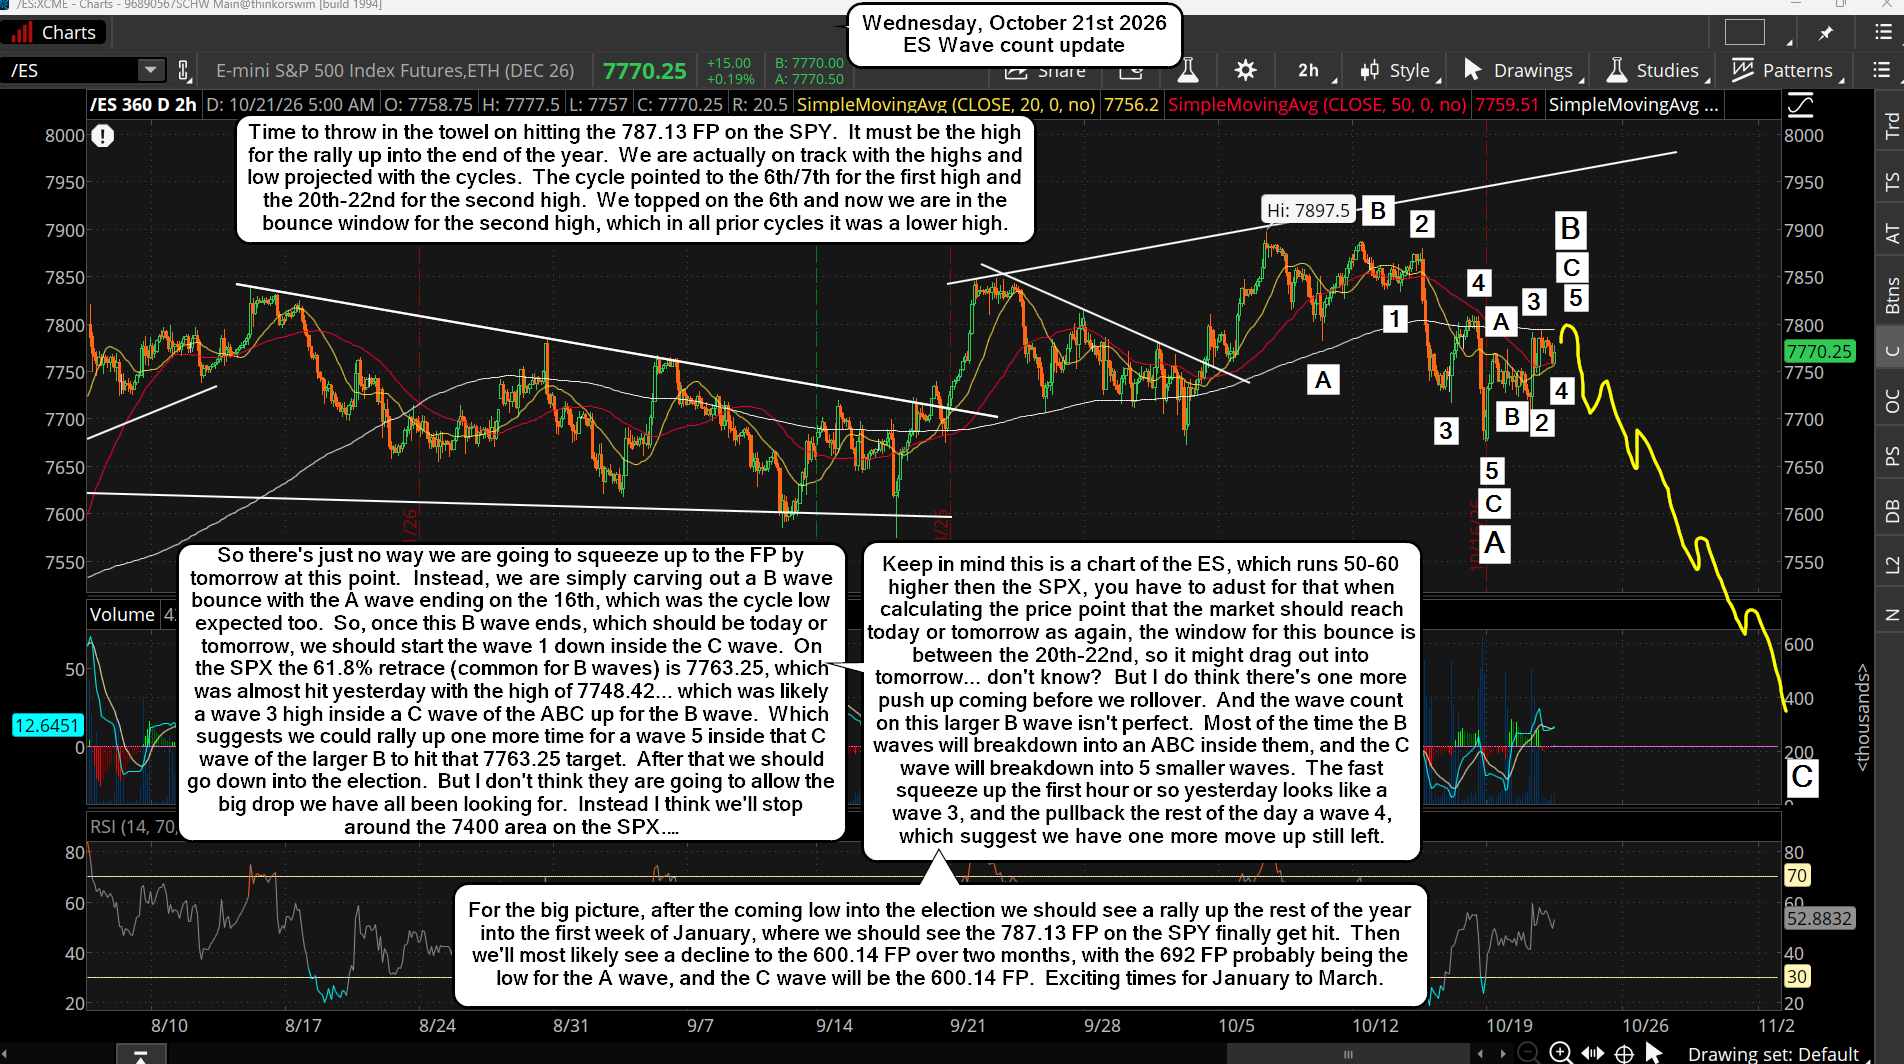
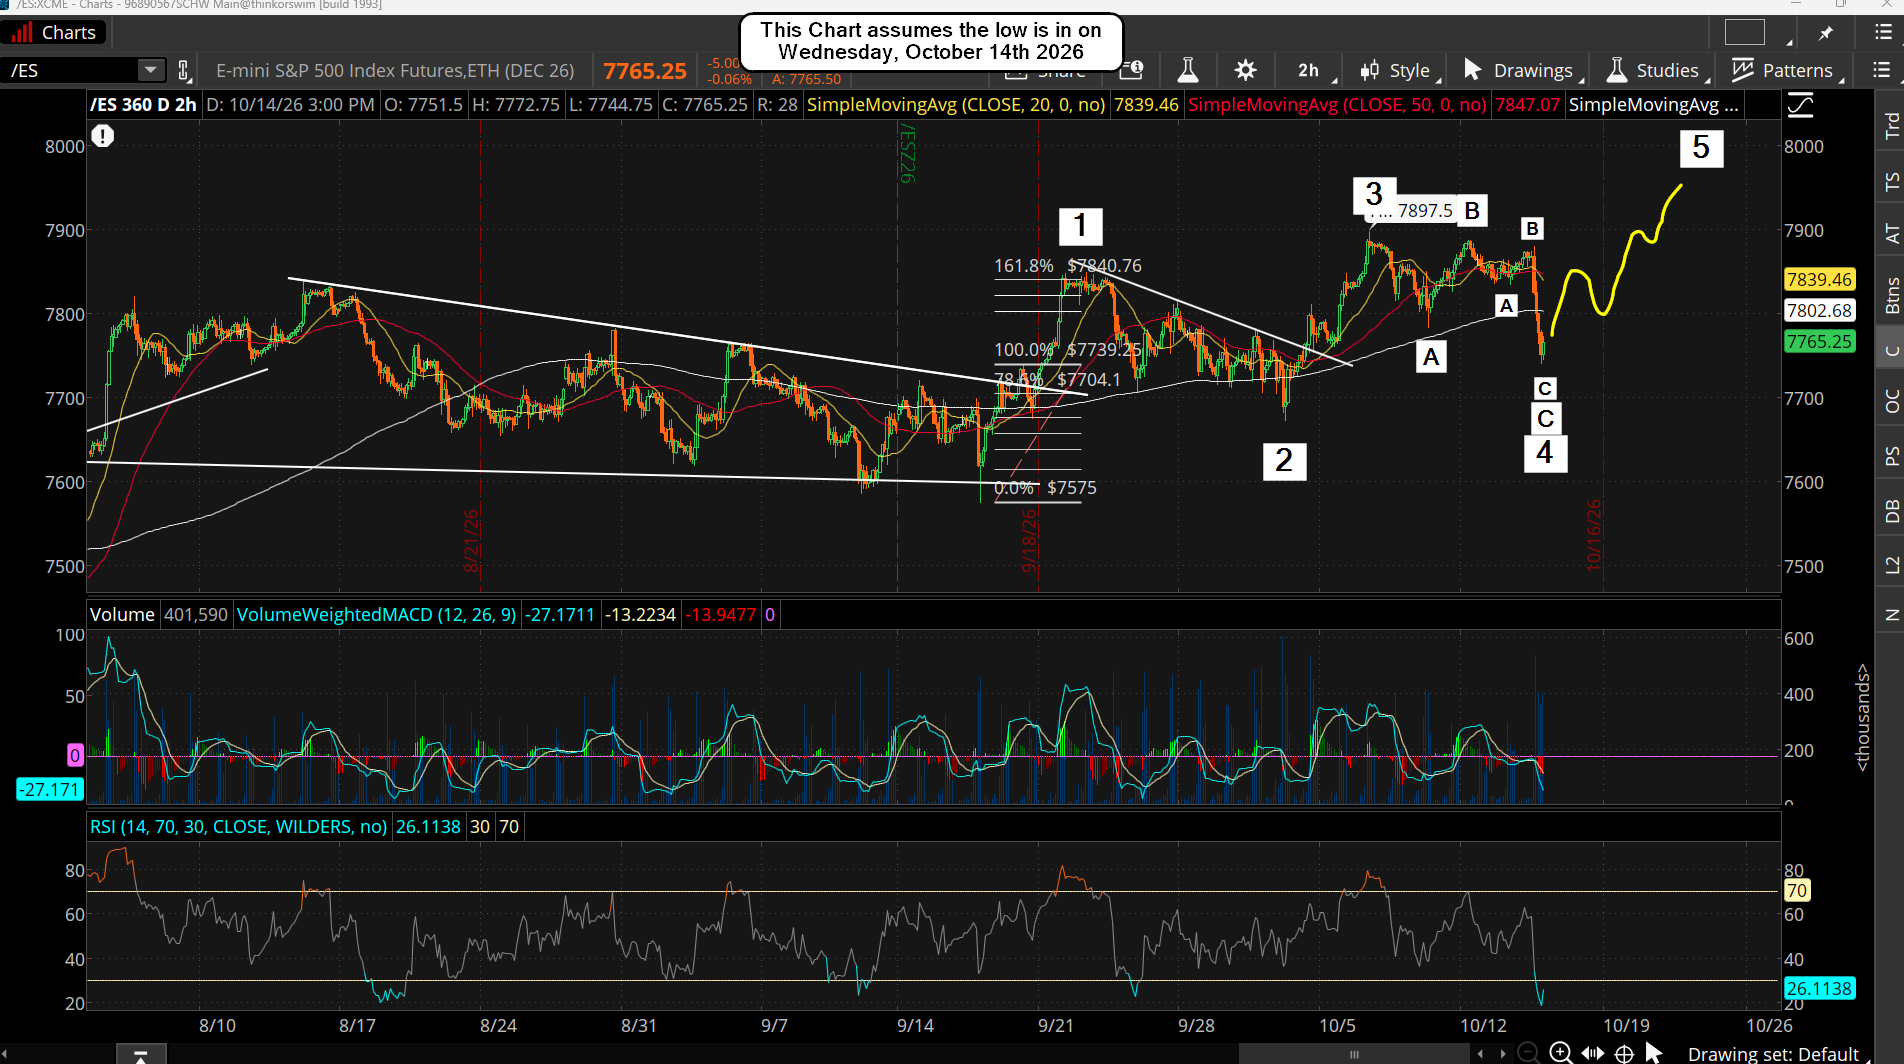
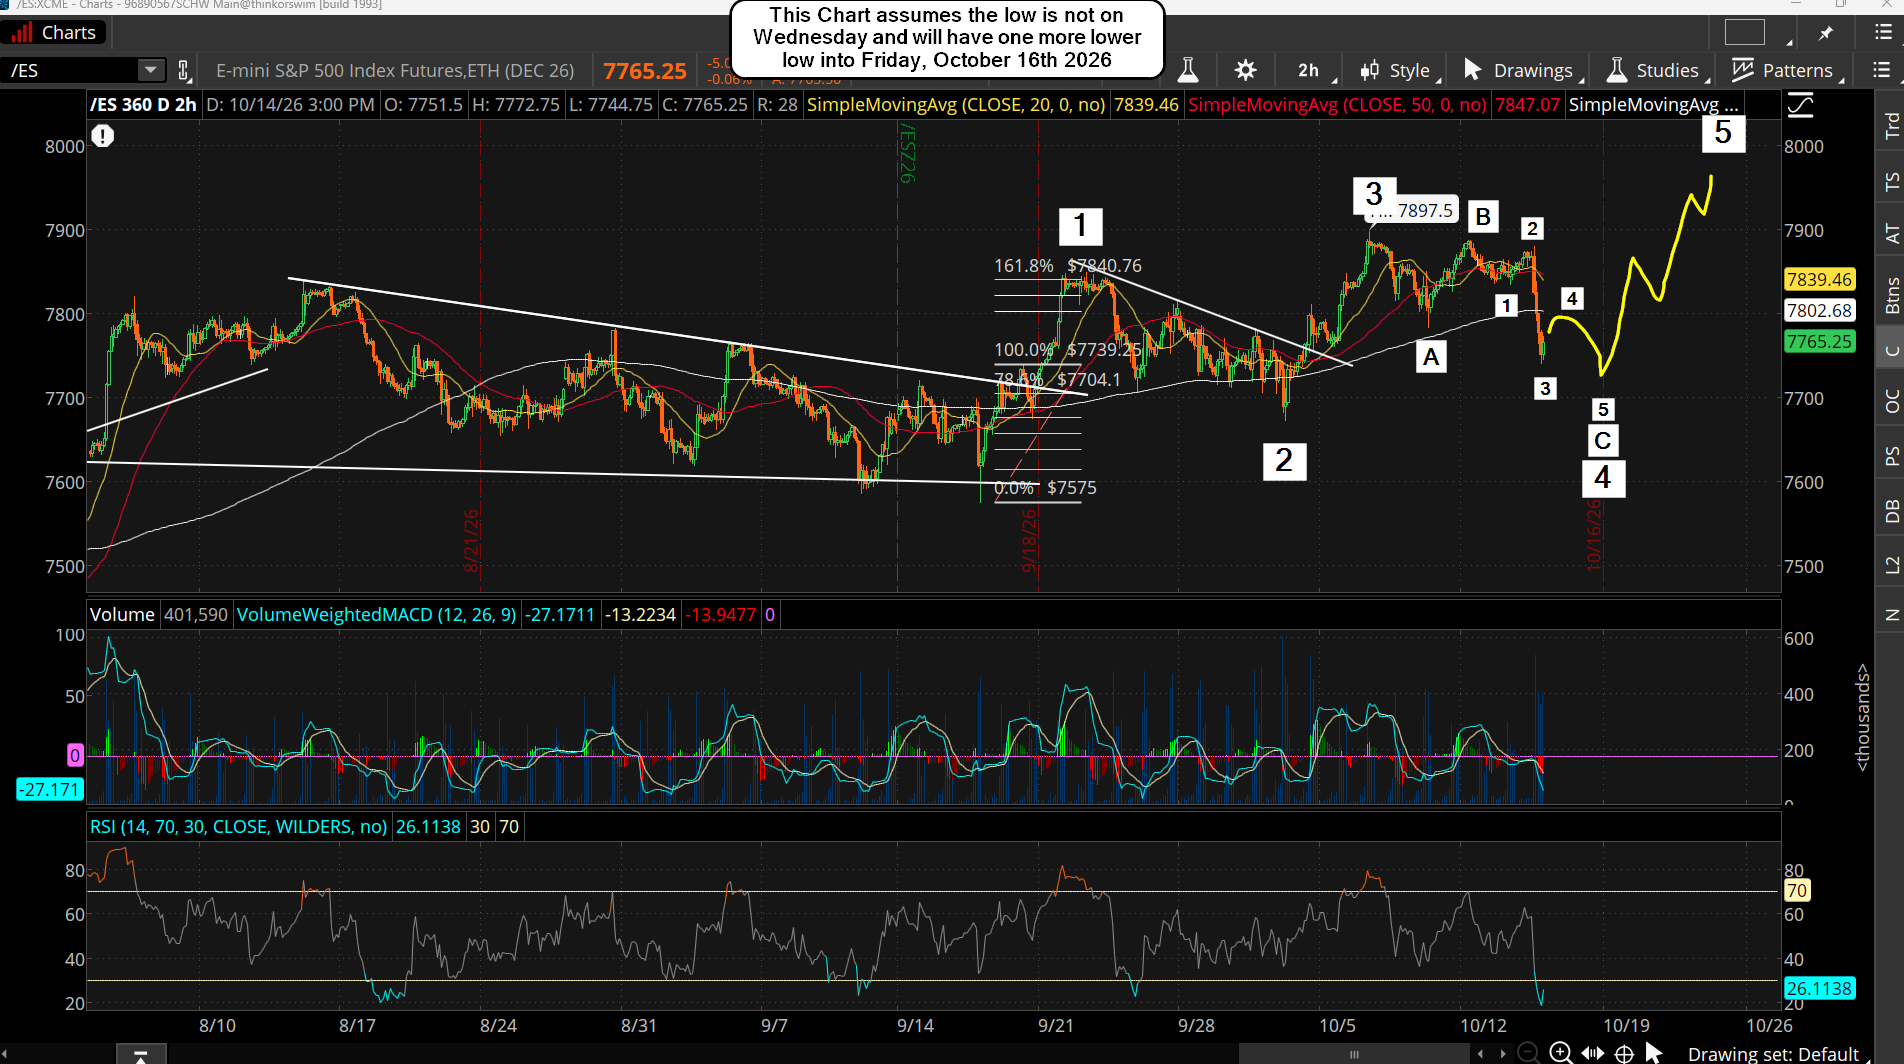
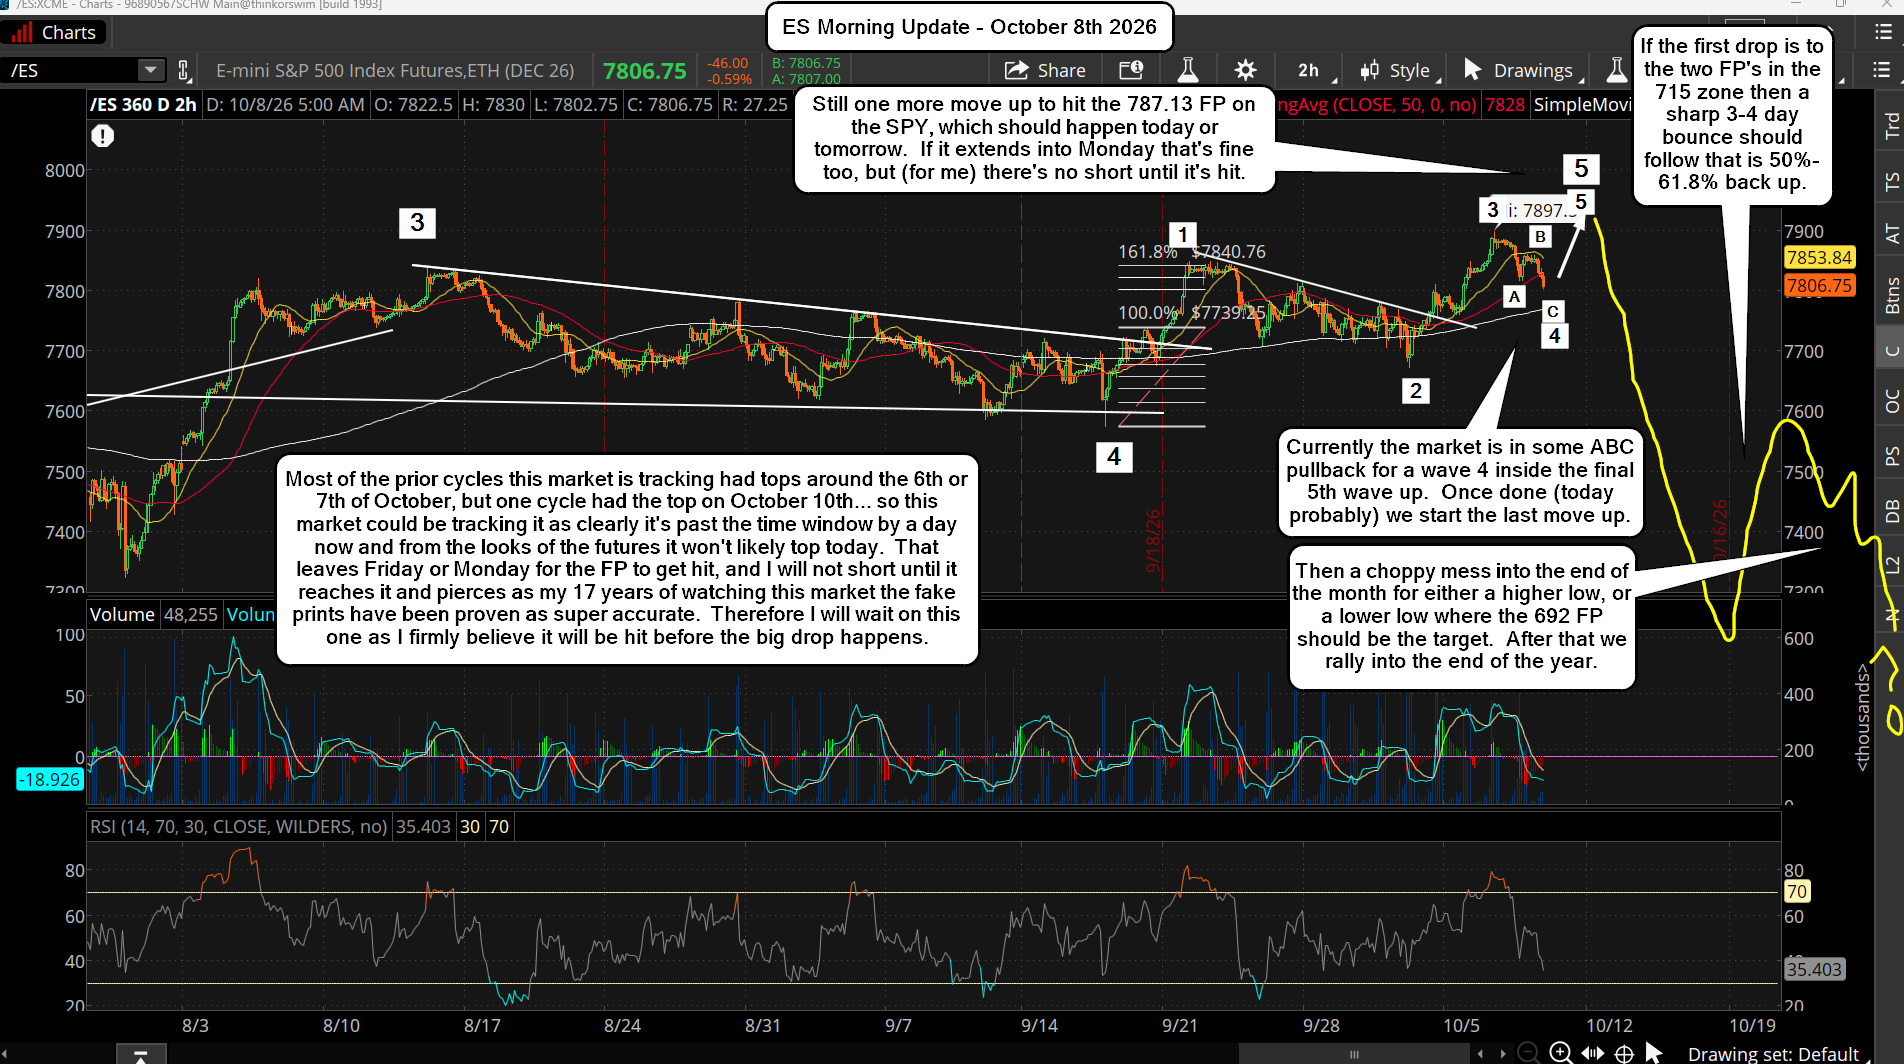
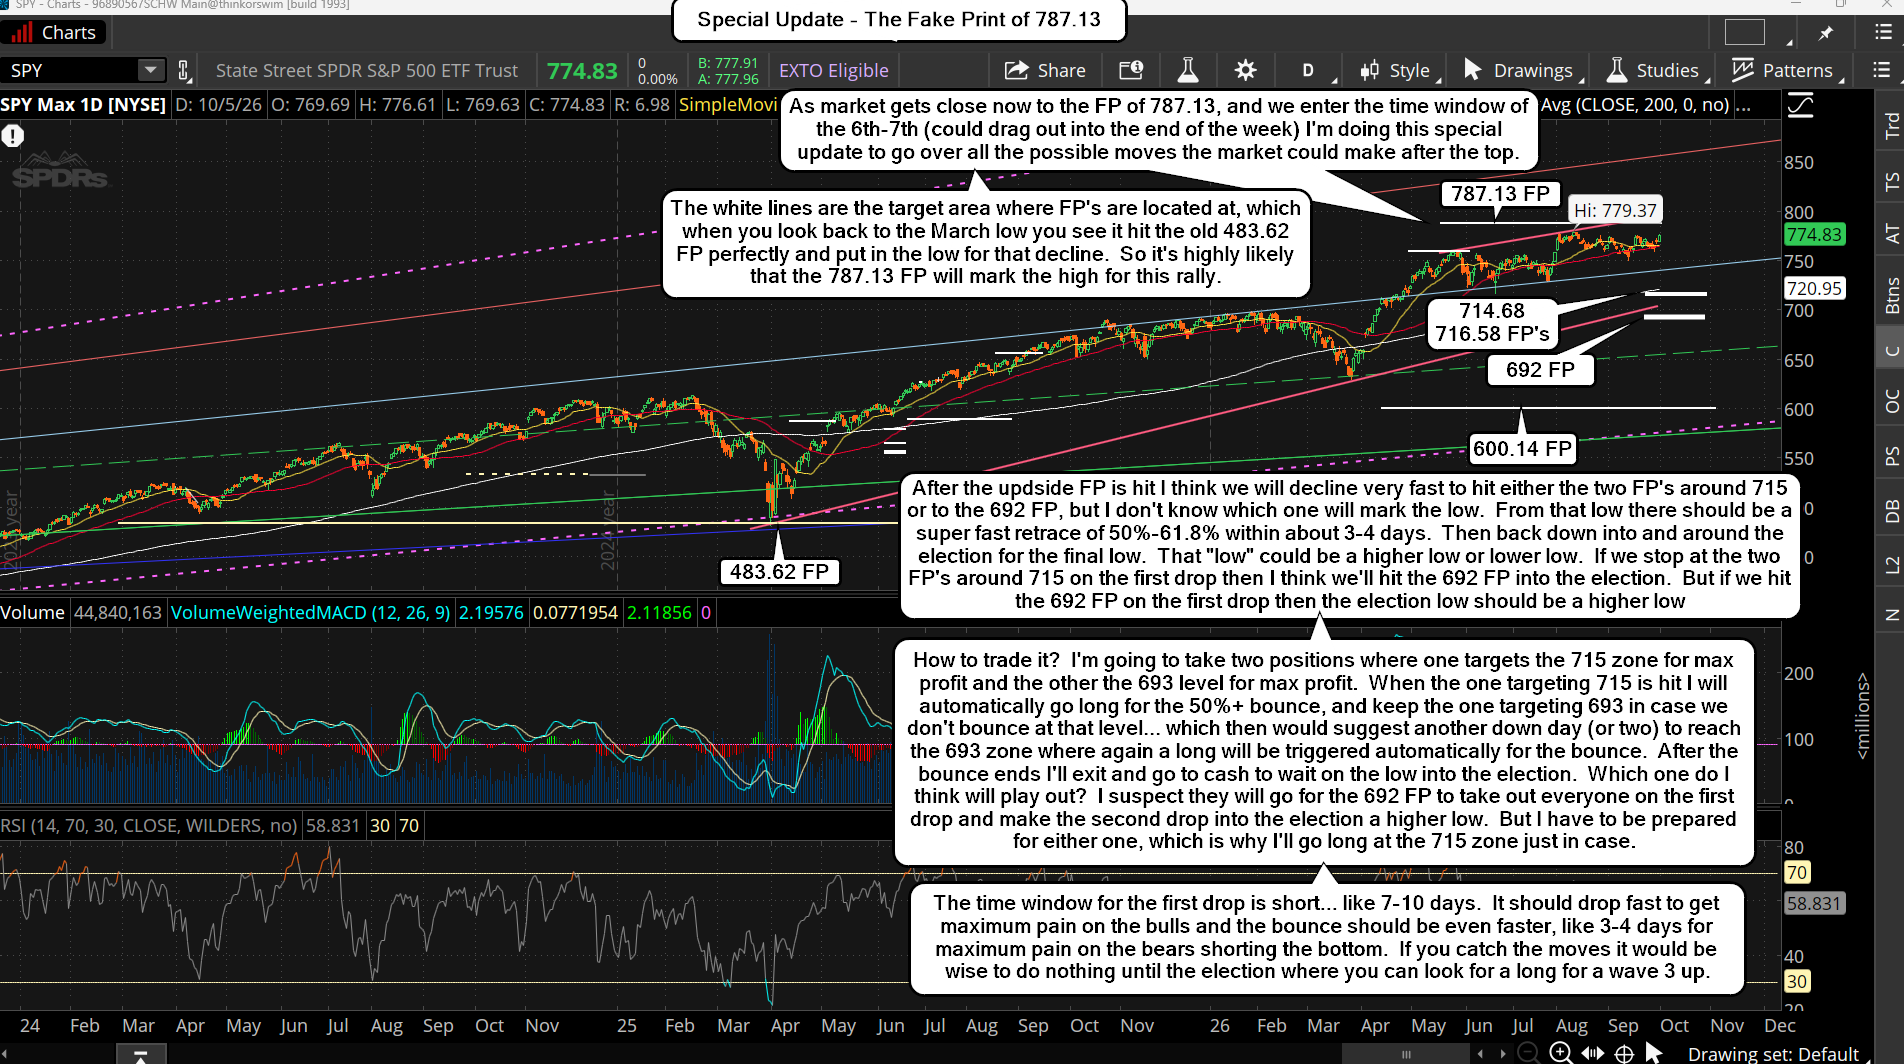
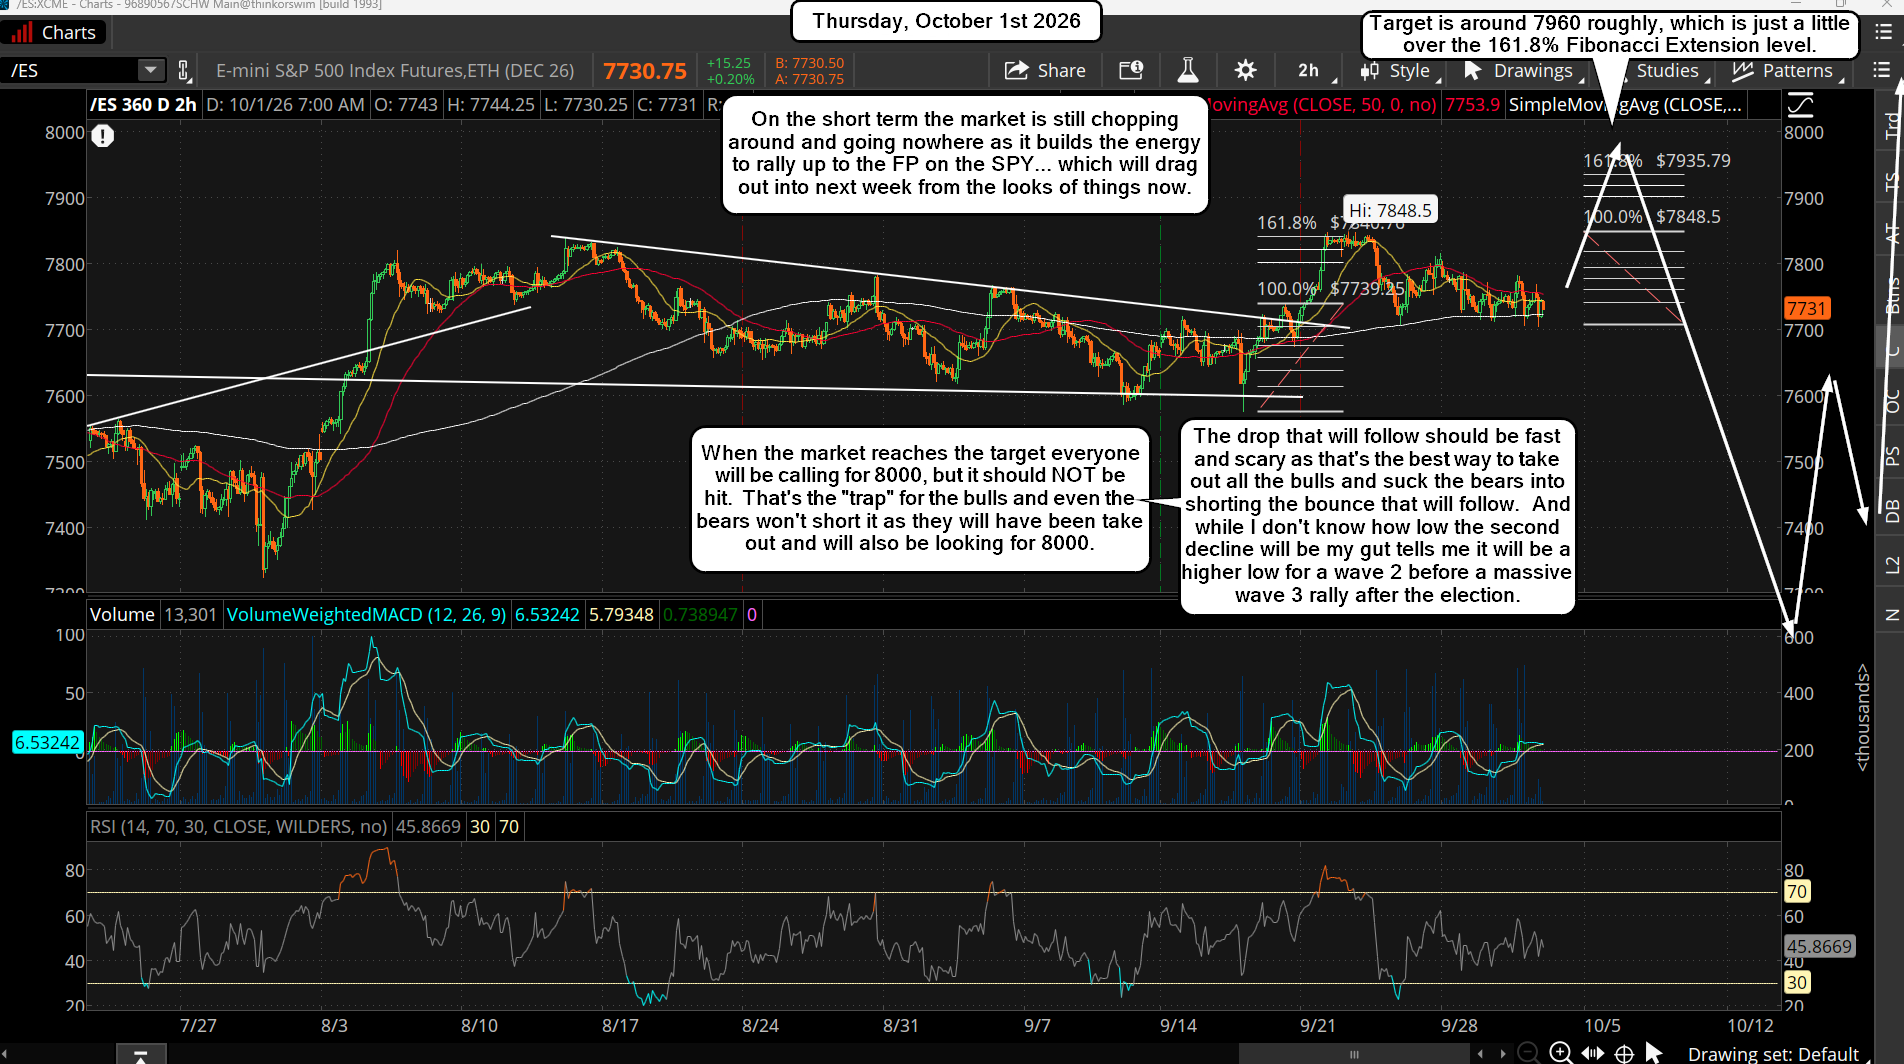
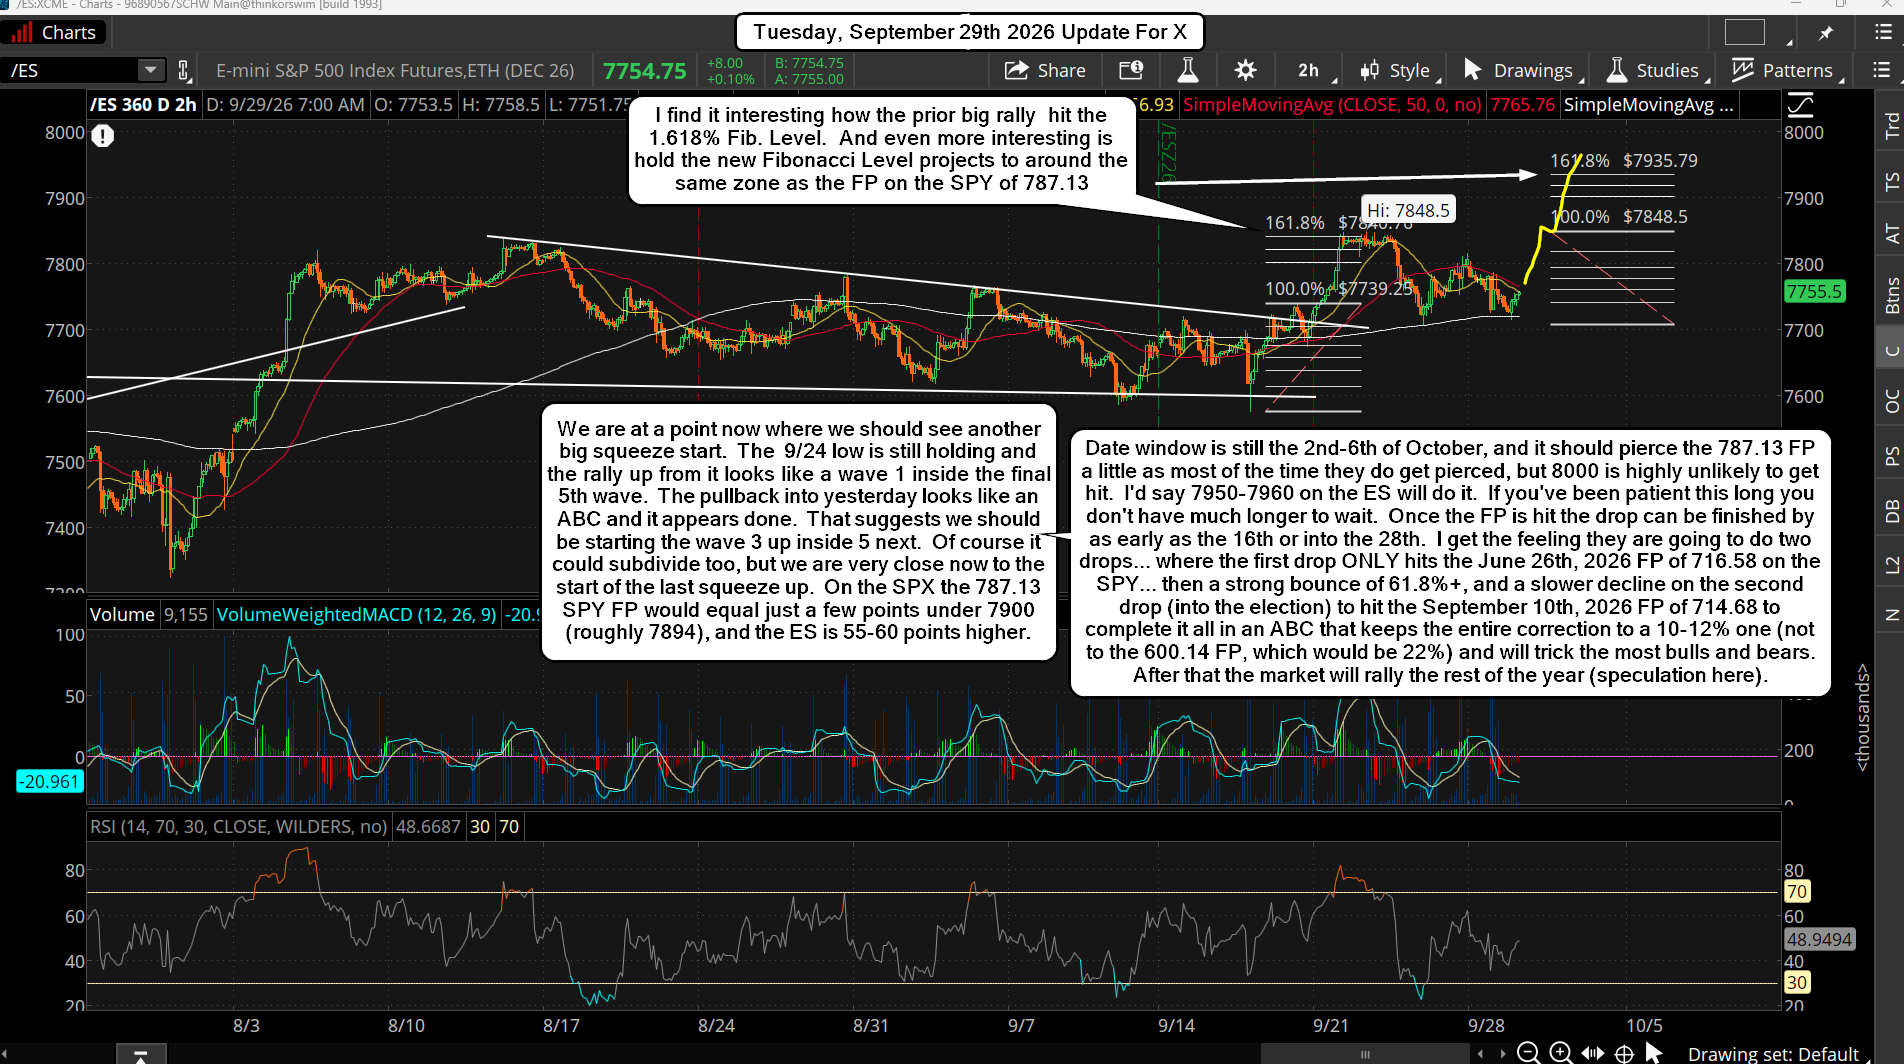
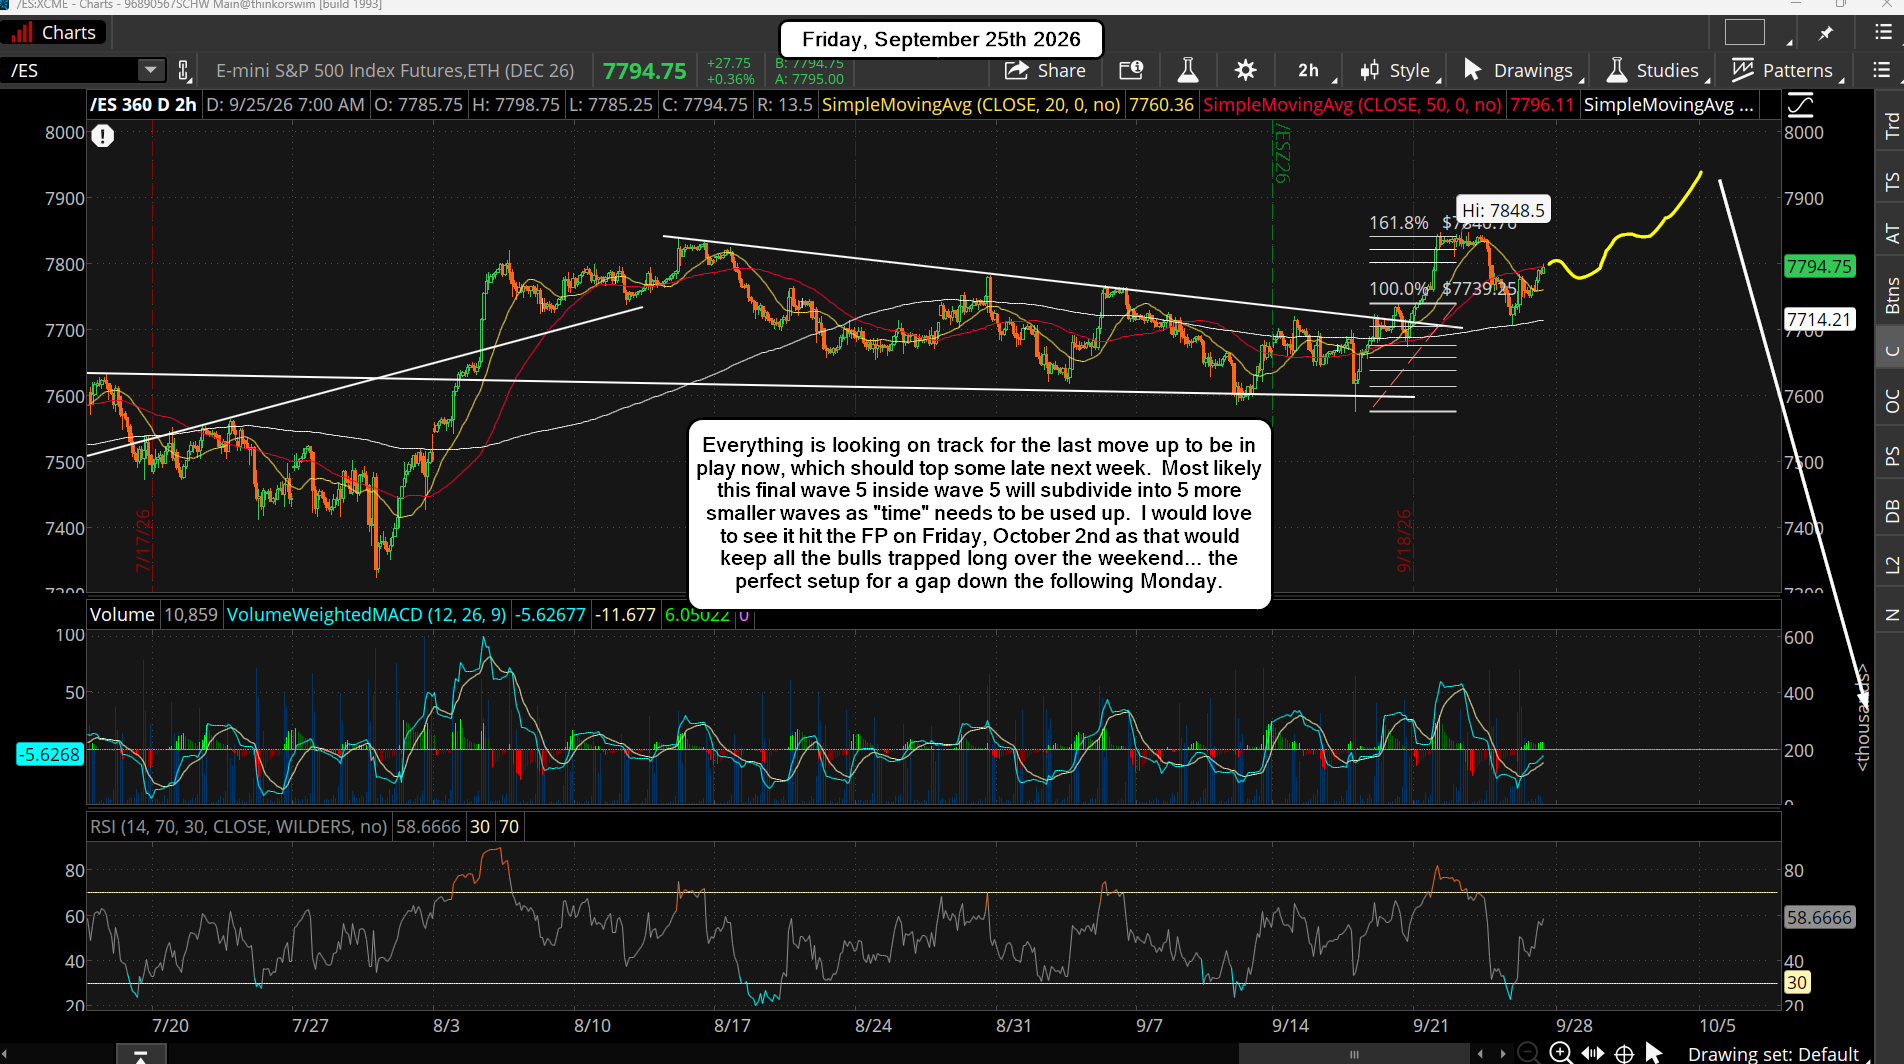
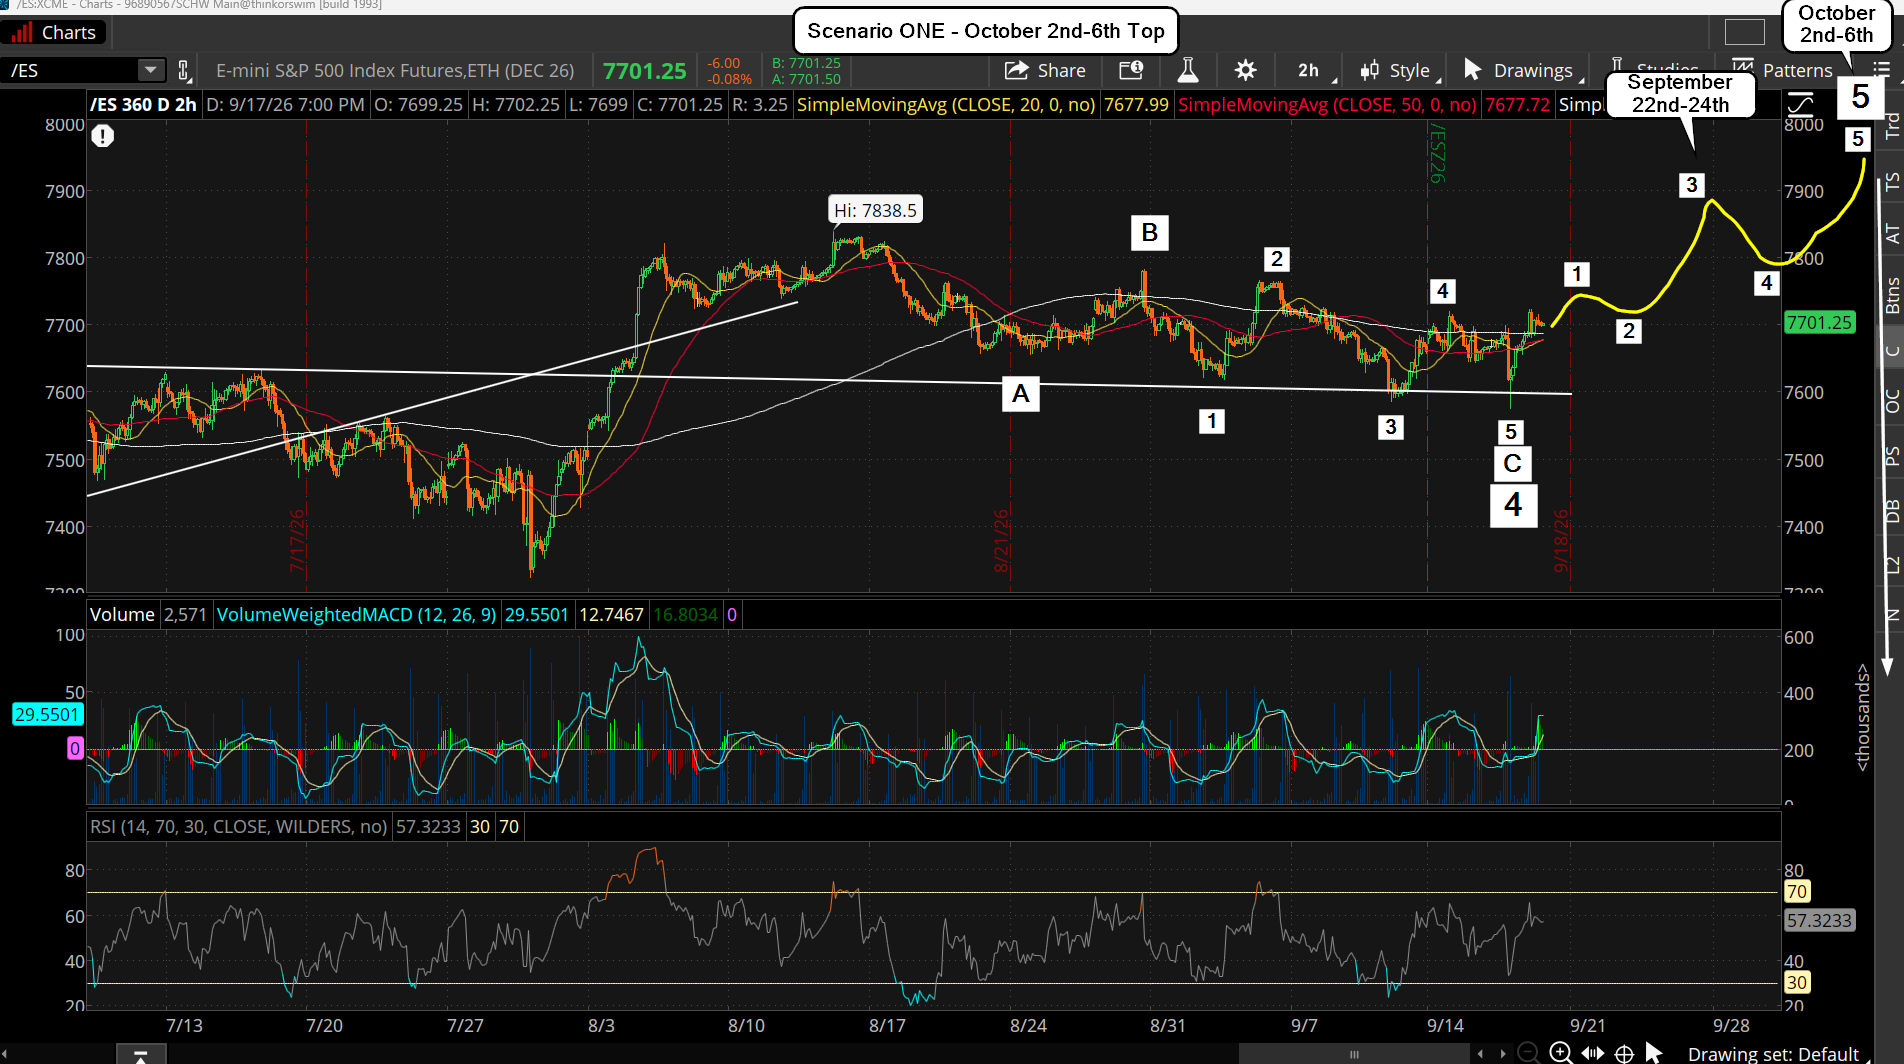
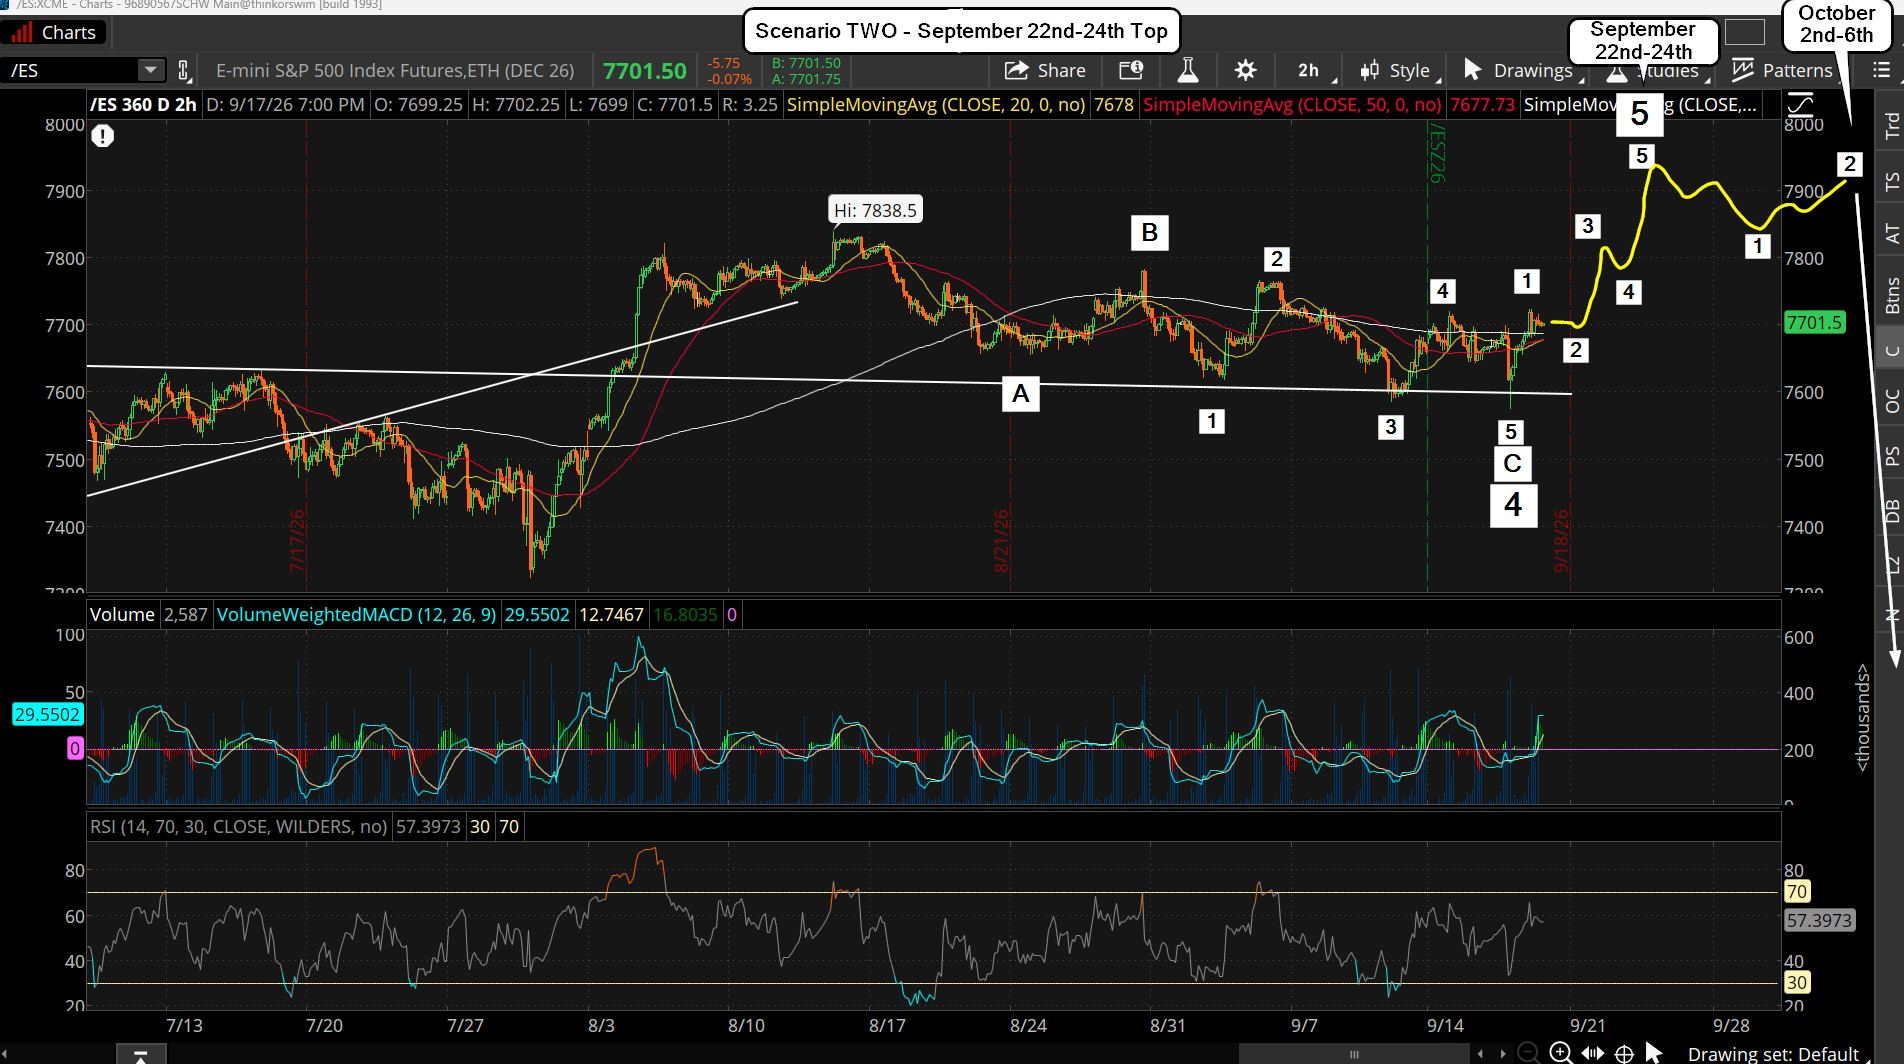
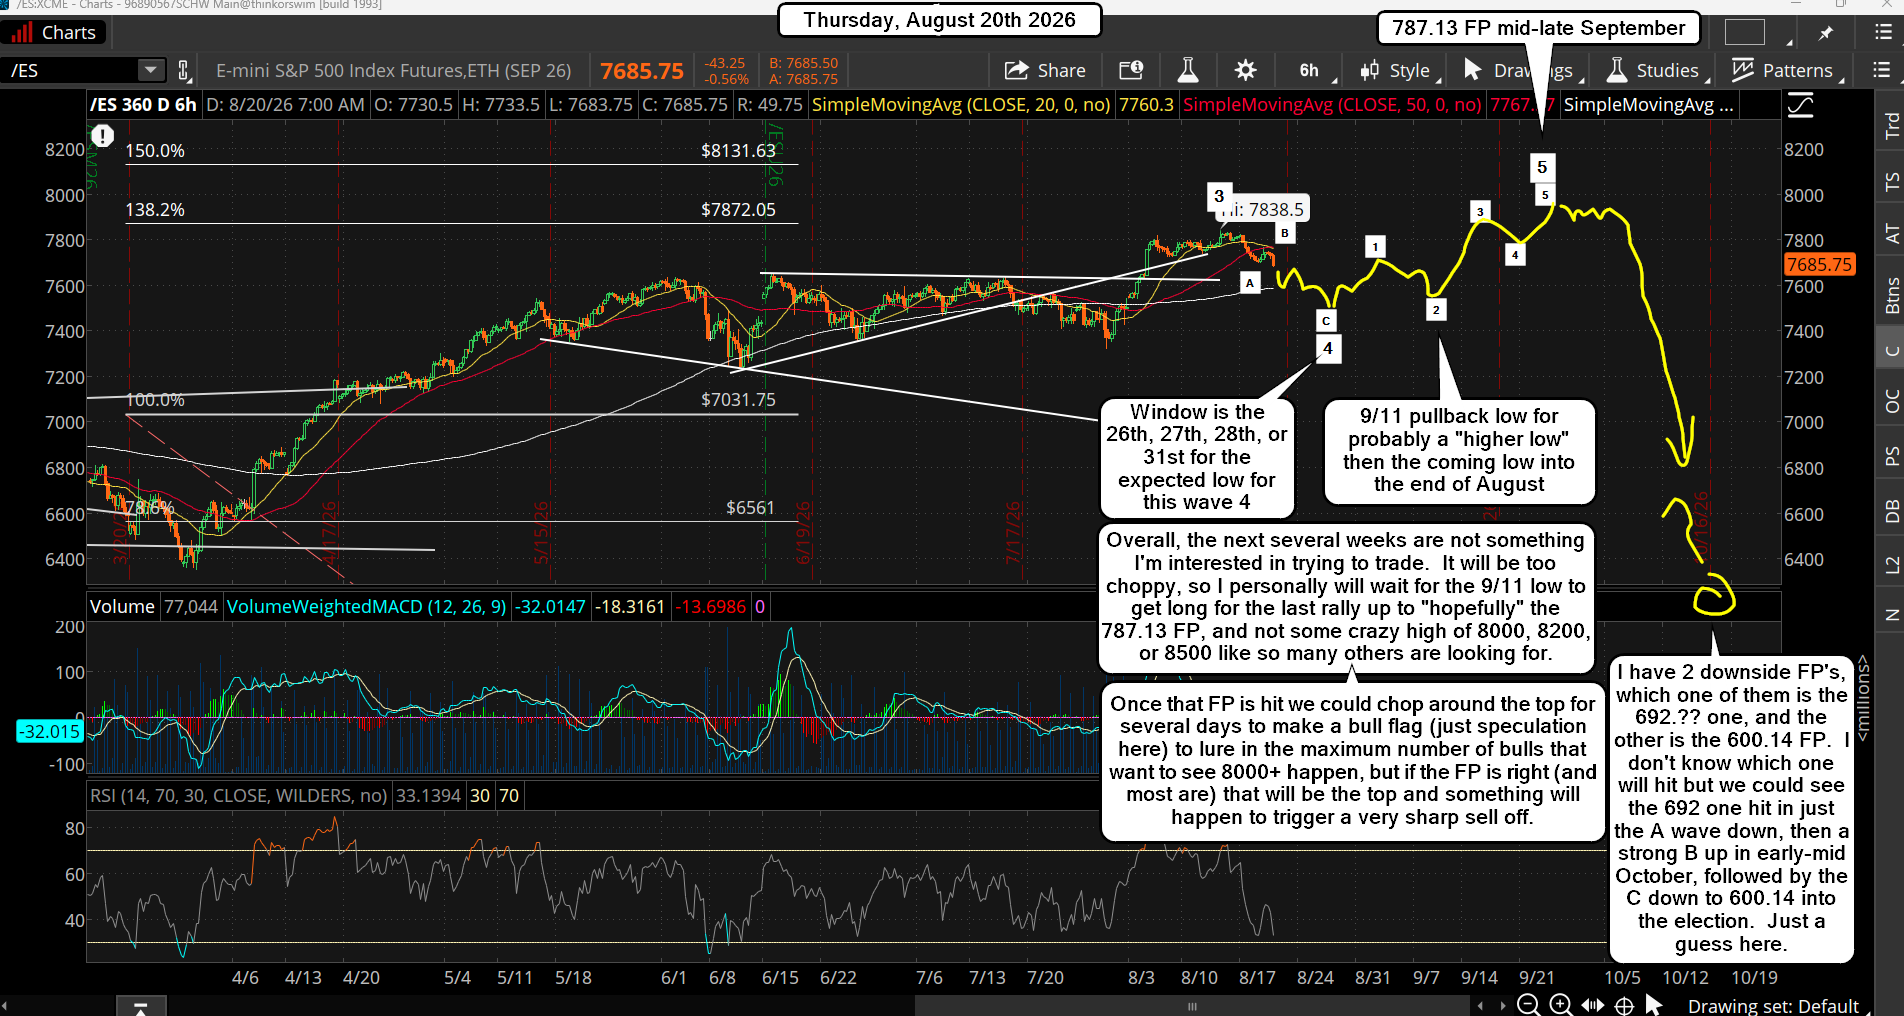
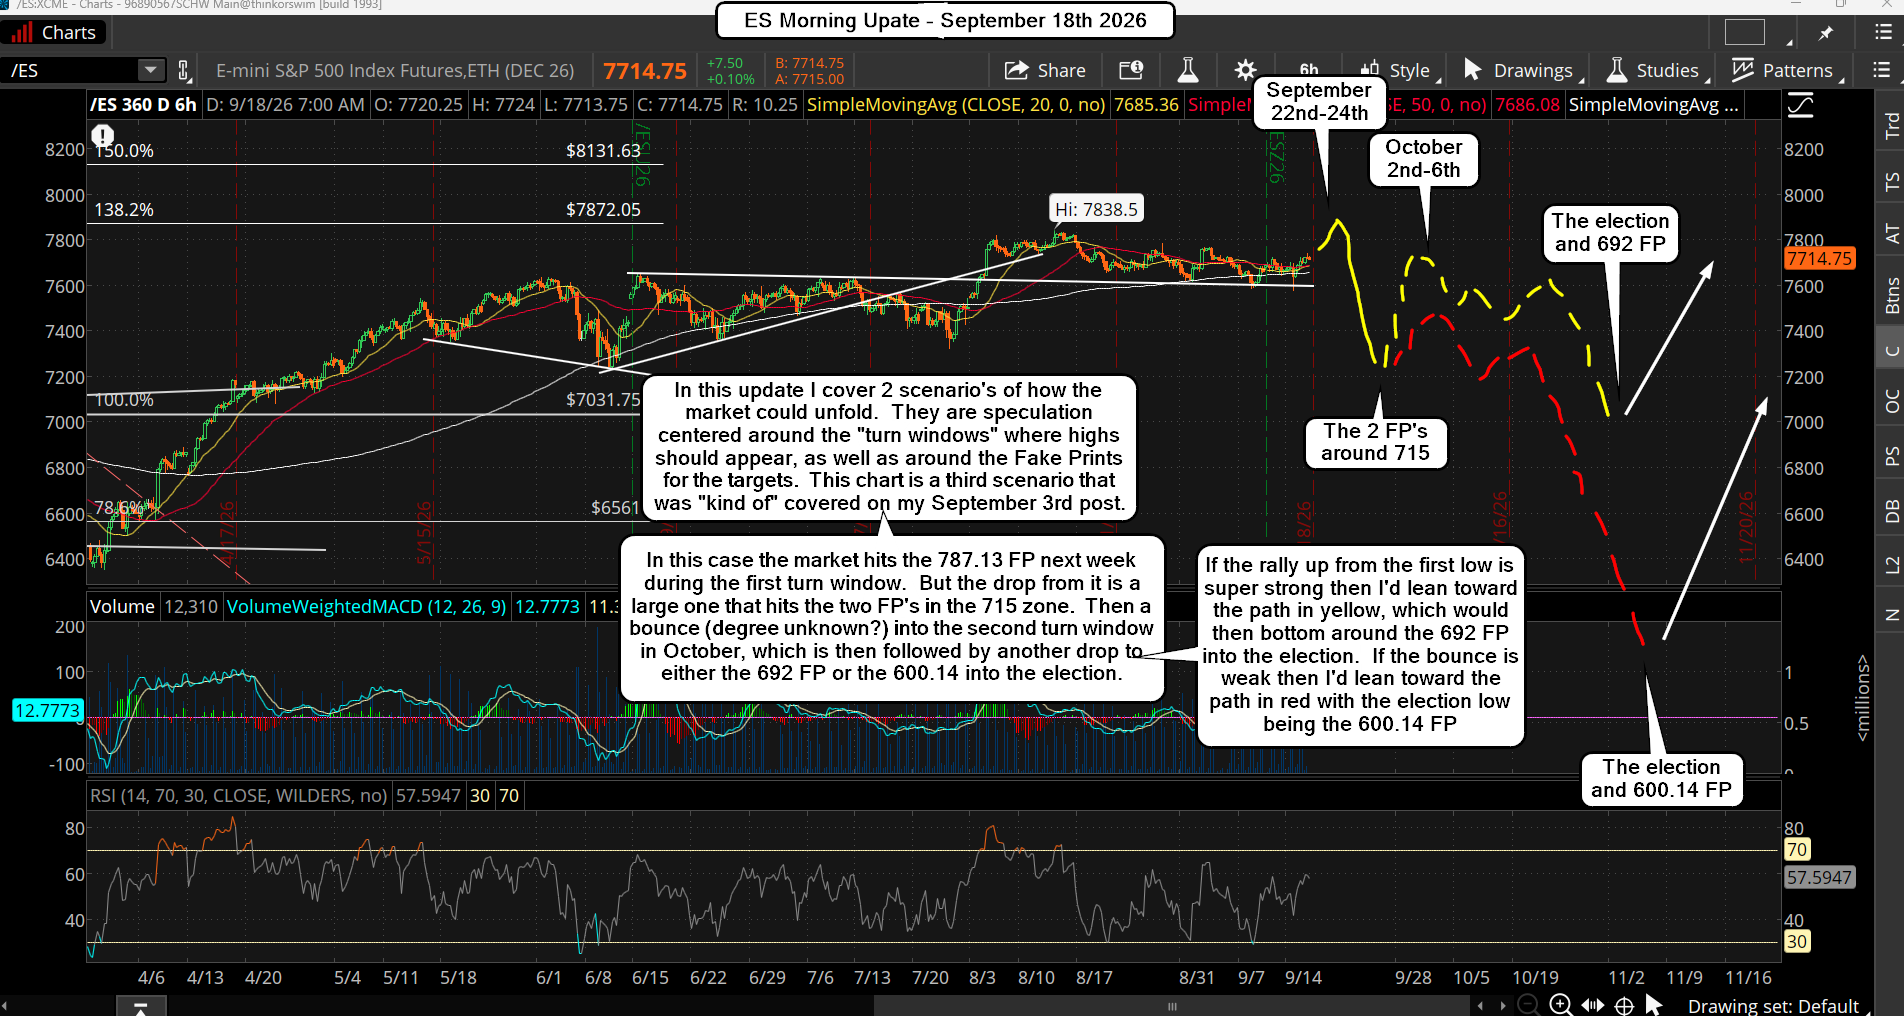
The market appears to have bottomed for now, in what I think was an ABC wave 4, where I can see that the C wave subdivided into 5 waves, and ended at the low on Wednesday. If this is correct we started the wave 1 up that day, which is inside a bigger wave 5. Since this 5th is expected to hit the 787.13 FP on the SPY into either the window of September 22nd-24th, or October 2nd-6th, we should see one of two scenario's unfold.

If the market wants to drag out the 5 waves up to finish the 5th wave then it will top around the October 2nd-6th date, and that means more subdividing waves. Since the wave 1 up started at the low on Wednesday the wave 2 pullback should appear soon, and then the wave 3 up should divide into 5 smaller waves so that it tops out between the 22nd-24th. Then a wave 4 pullback that's probably an ABC, and a final wave 5 up into the 2nd-6th, which again could subdivide to drag out more "time".

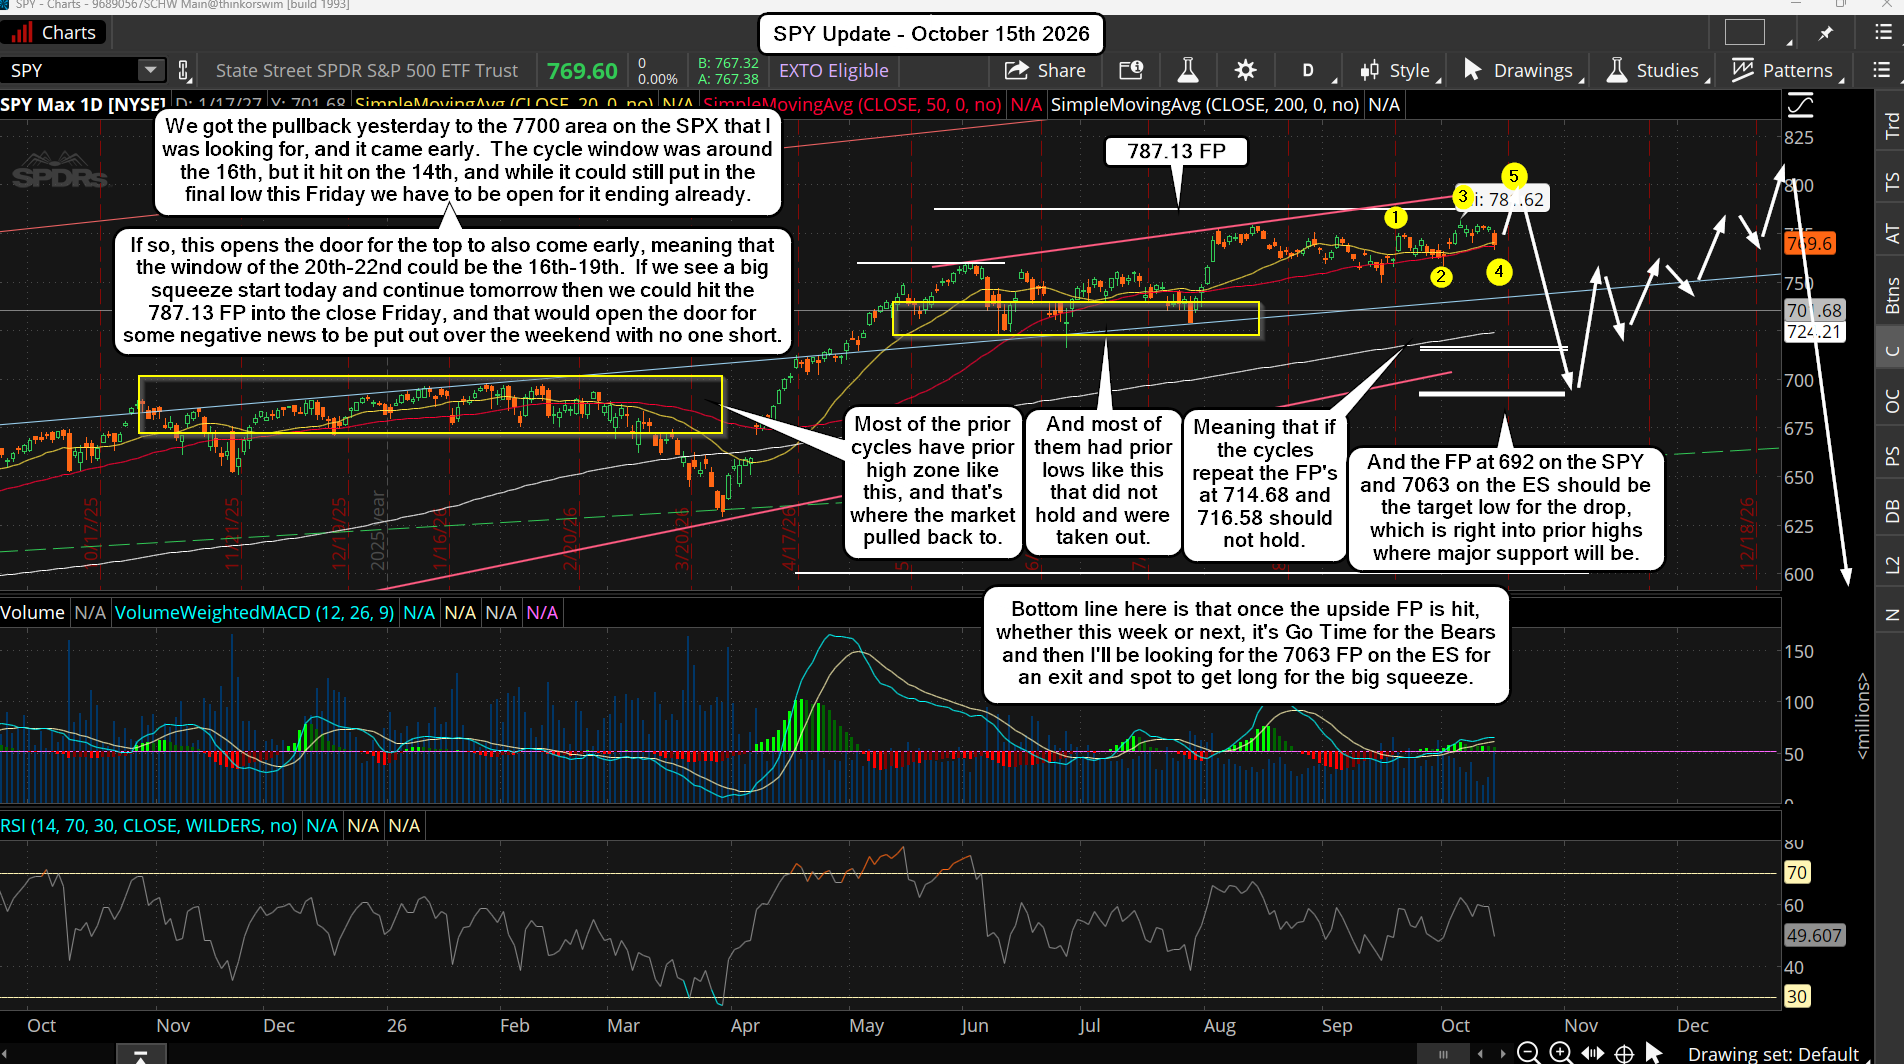
This pattern would mean that the top of the wave 3 next week should not hit the FP on the SPY but should get close to it. Possibly a slightly higher high on ES (it's on the December contract now and 65 points higher the then SPX), but slight lower on the SPX cash? Then the move up into October 2nd-6th will hit the FP of 787.13, which is now around 7950 or so on the ES. If that happened everyone would say that 8000 is next, but if it just barely pierces the FP there's no reason for the ES to reach the 8000 level and it could just rollover right then and there.

The other scenario is that we see 5 waves up into the 22nd-24th next week to complete the 5th wave and hit the FP then... which would be followed by a pullback of some degree (probably not large) for an A wave (or at least the wave 1 inside the A wave) and the B wave up (or the wave 2 inside the A wave) makes a lower high into October 2nd-6th.

This is just like the 9/21/2018 top and pattern where there was a wave 1 inside an A wave that followed (small pullback) and a wave 2 inside the A down that made a slightly lower high on 10/3/2018. After that the wave 3, 4 and 5 for the A wave followed and that would be the move down the the 692 FP on the SPY. Something else to note is that there are now two FP's that are similar in price that should be added to this story.

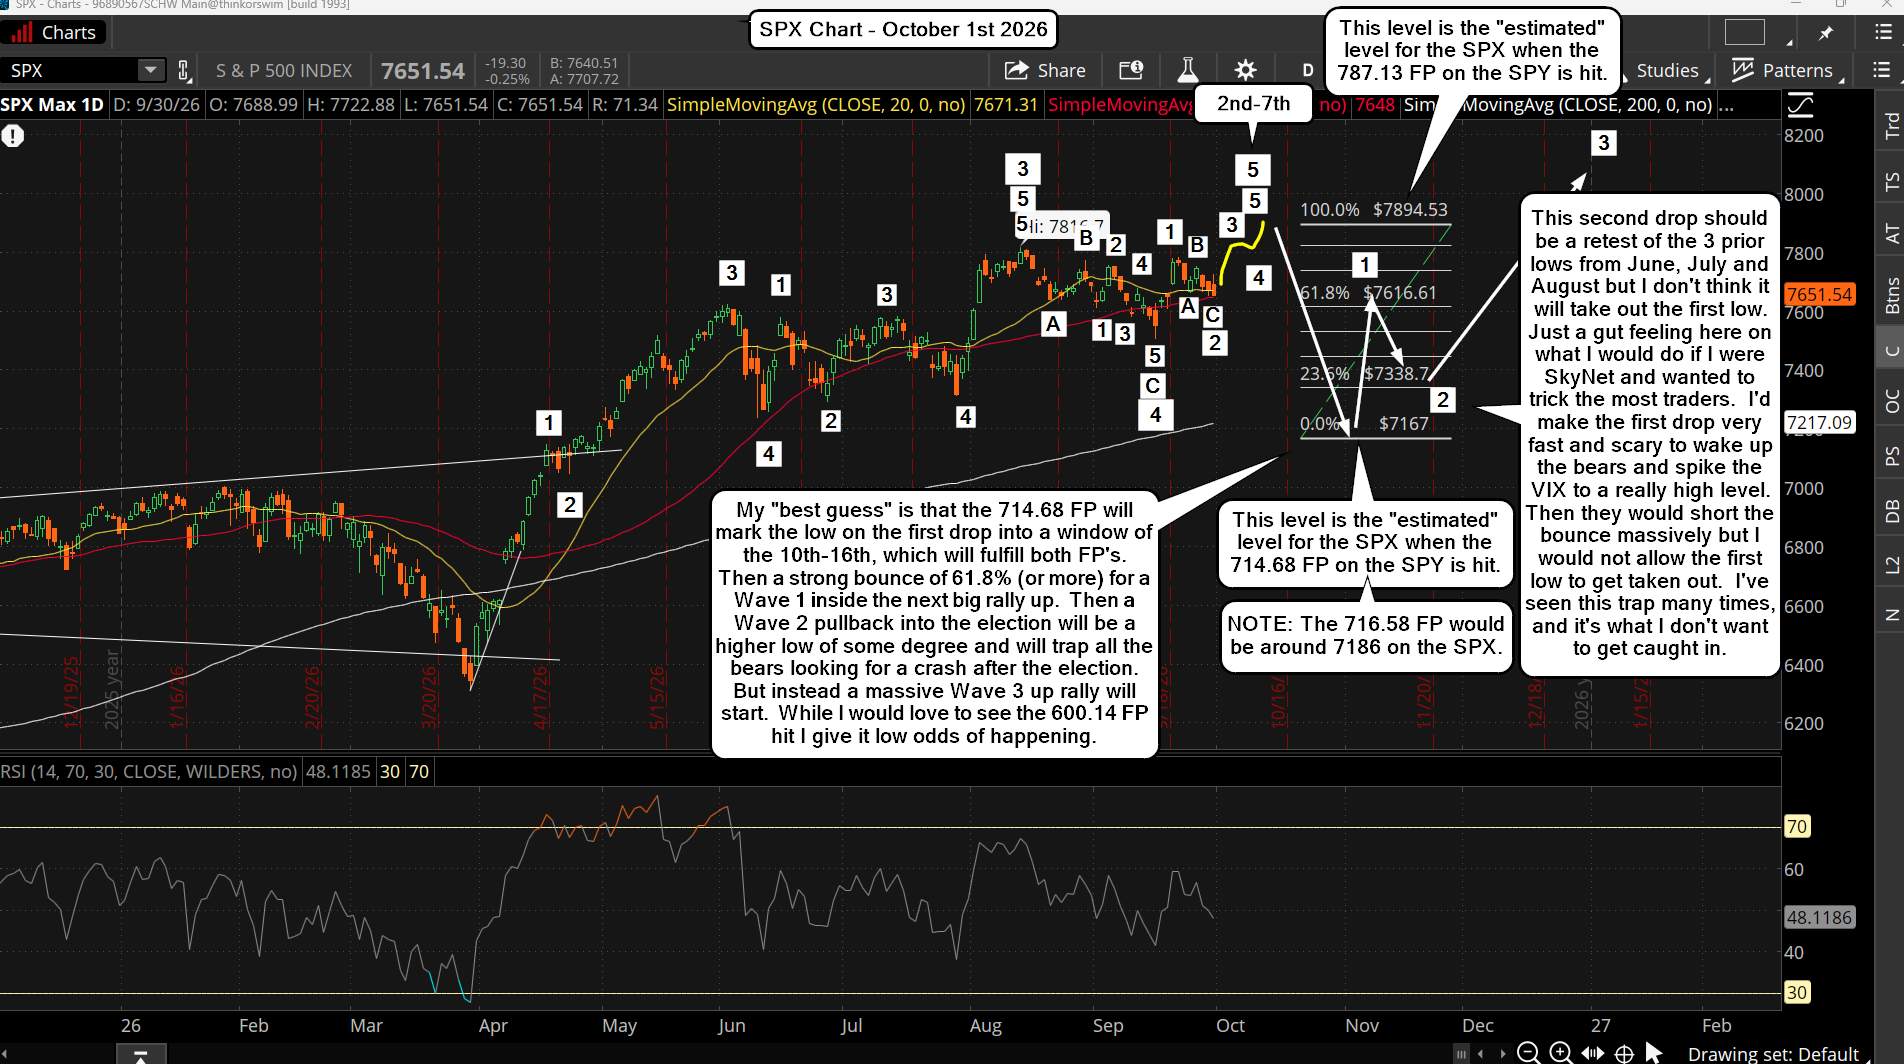
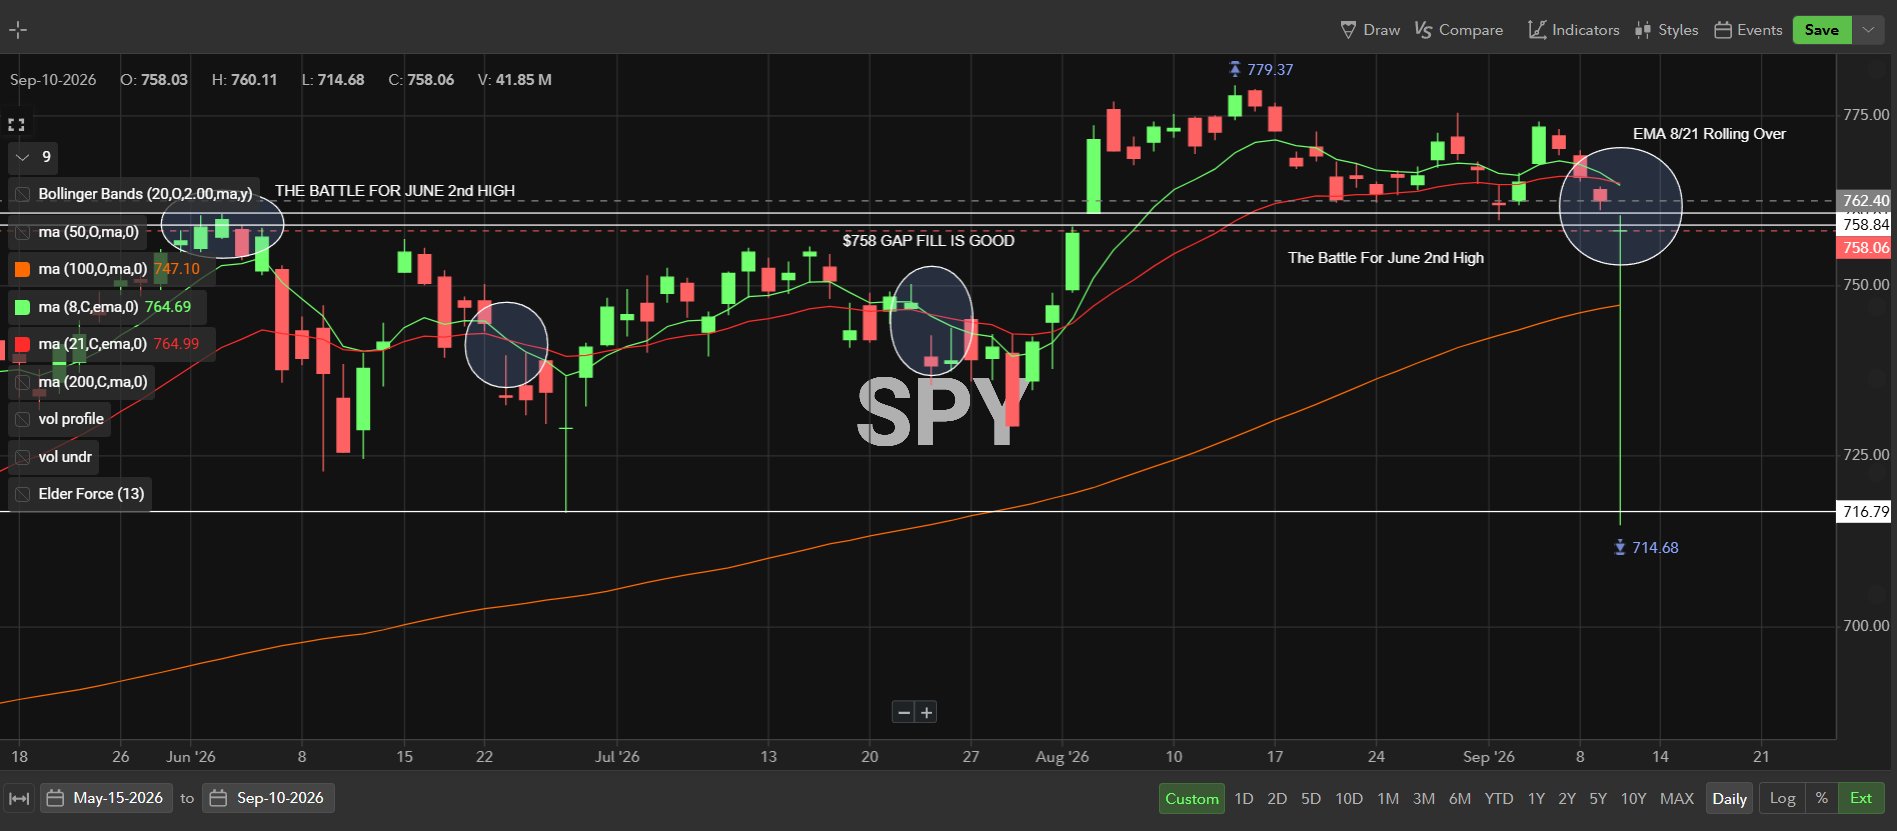
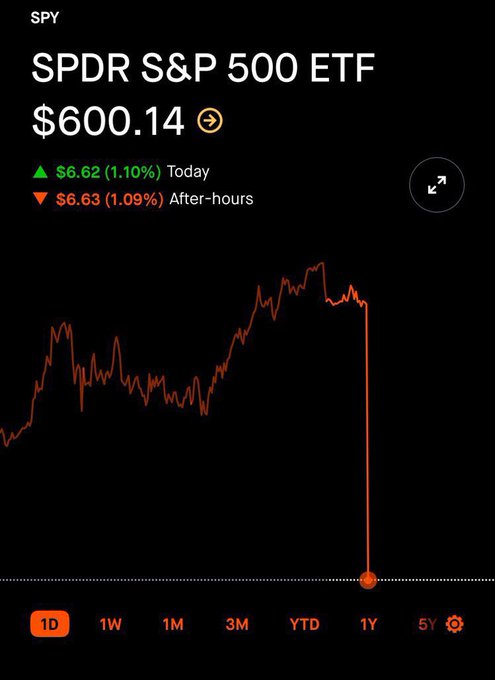
There is the "New FP on September 10th 2026 for the SPY at 714.68" and the "New FP on June 26th 2026 for the SPY at 716.58", which are close in price so I'm just going to refer to these fake prints as the 715 one's. It's possible that they will be hit on the wave 3 of the A wave down and the wave 5 will hit the 692 fake print. Then some kind of bounce for a B wave and the C wave then takes the market down to the 600.14 FP into the election. It would be similar to 2018 but sped up in "time" as that one dragged out into Christmas, and I don't think that will happen again.

With the rumors of Trump giving everyone a $5,000 check, which it would be wise to do it right before the election, I have to think that money will be a huge stimulus to the stock market... and if it's right a the 600.14 FP too, look out for the mother of all squeezes!


From X two days ago...

https://x.com/reddragonleo/status/2100192569552404861


Have a great weekend.

ES Morning Update September 10th 2026

0

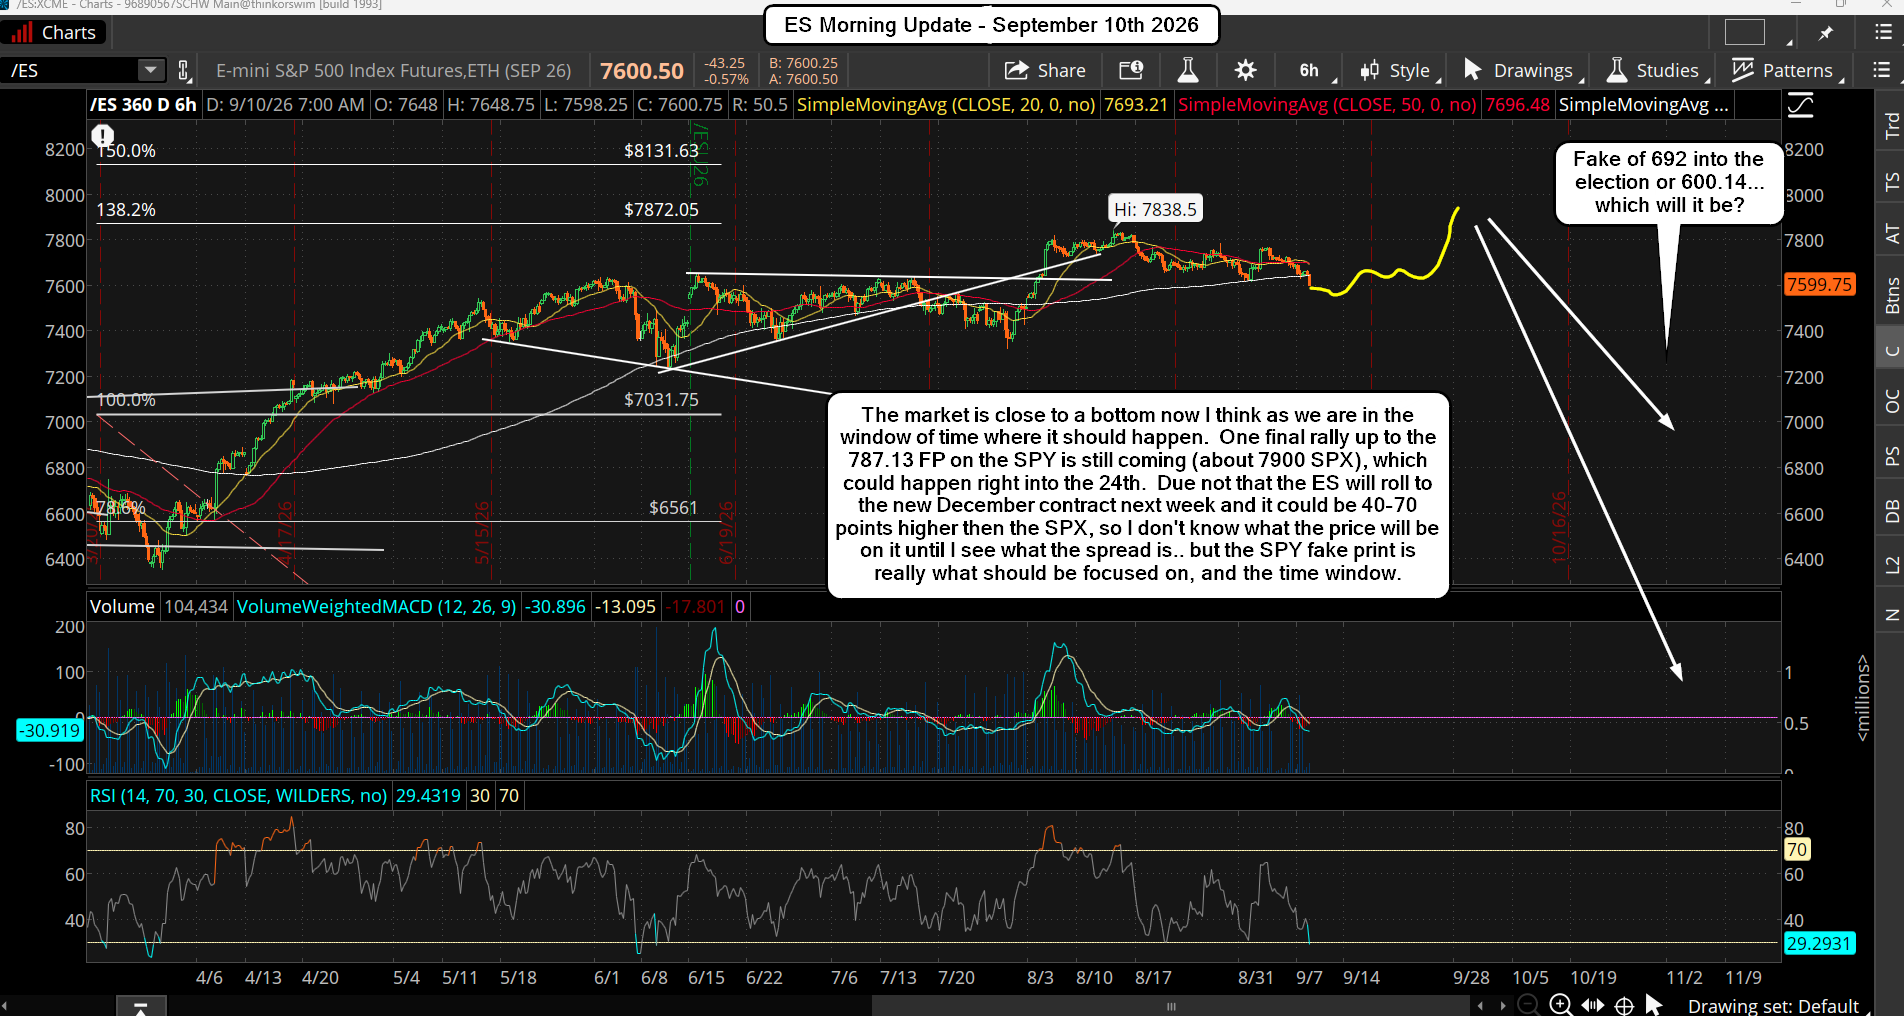
The market is getting close now to a bottom, but it's not known if it's going to the 7500 zone or if it just double bottoms (higher low) with the recent low last week. It's not important as it's not something that can be traded with any hope of making a profit. The best move of the year is still a few weeks away, and is the short for the 10=12% correction.

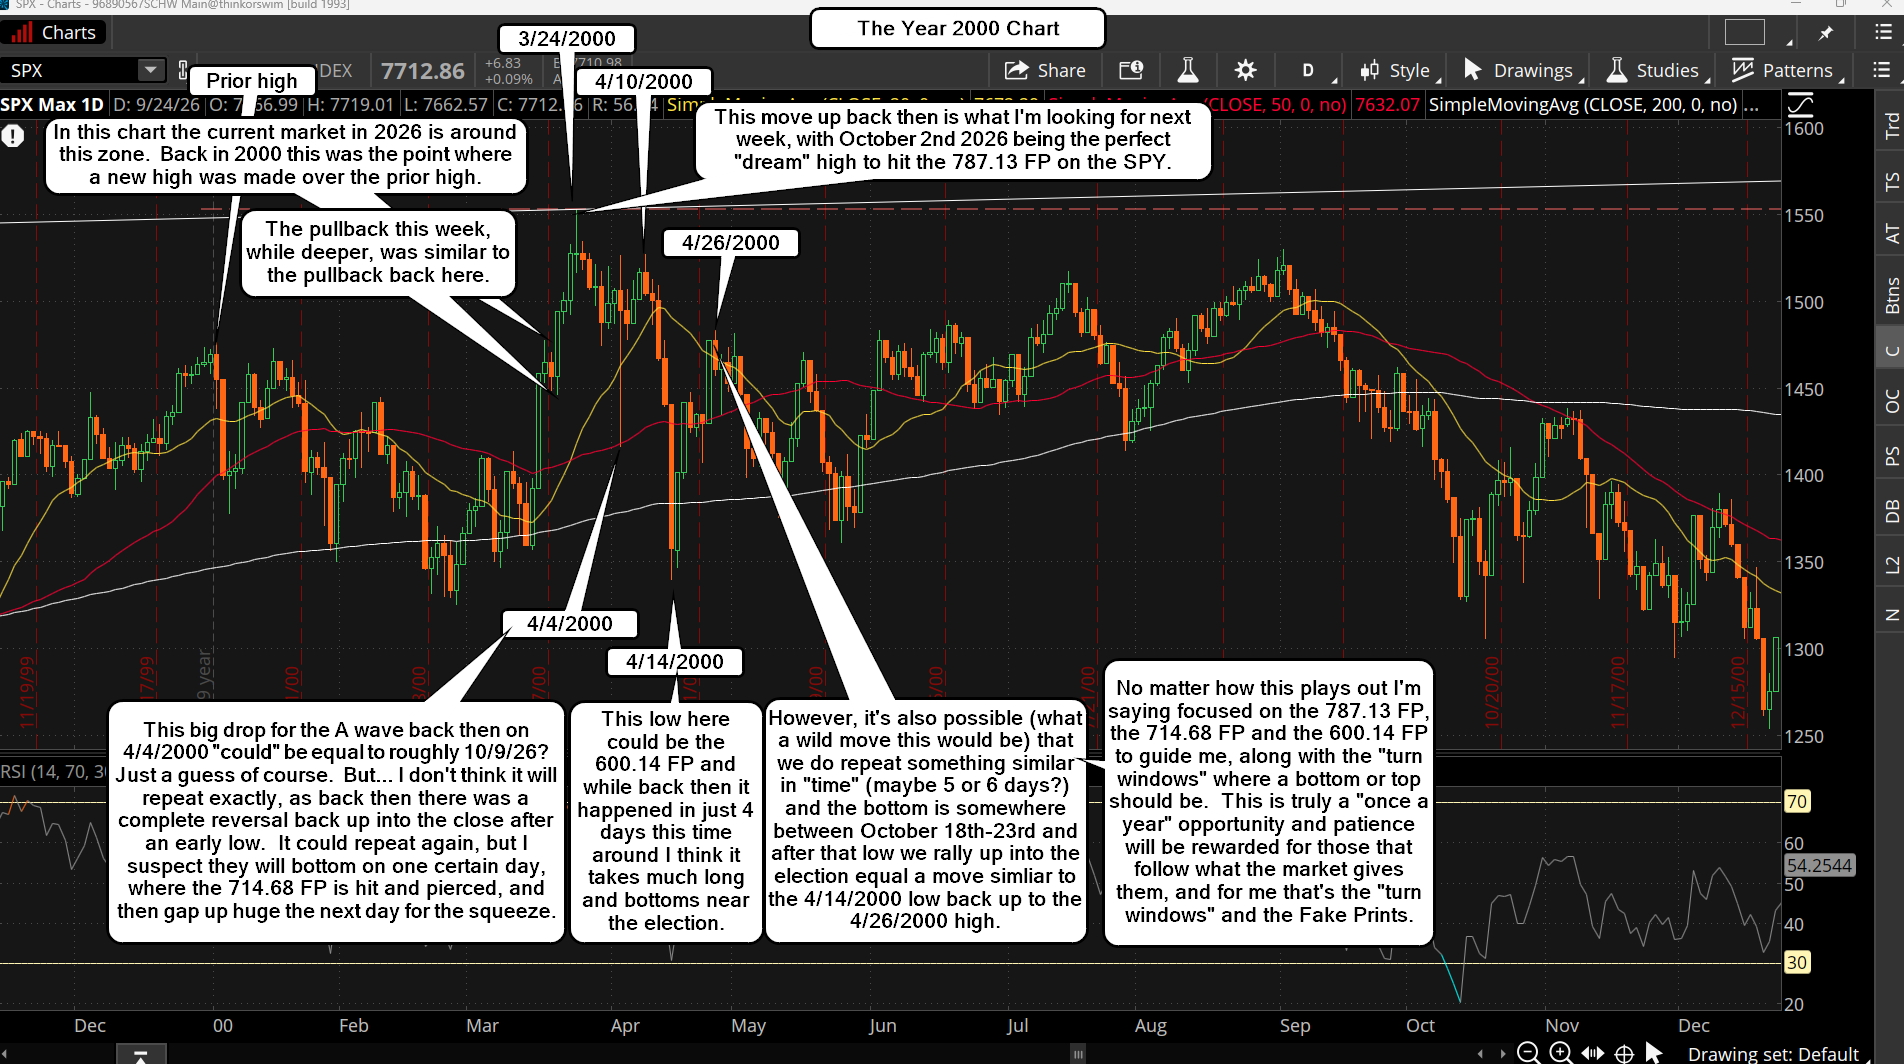
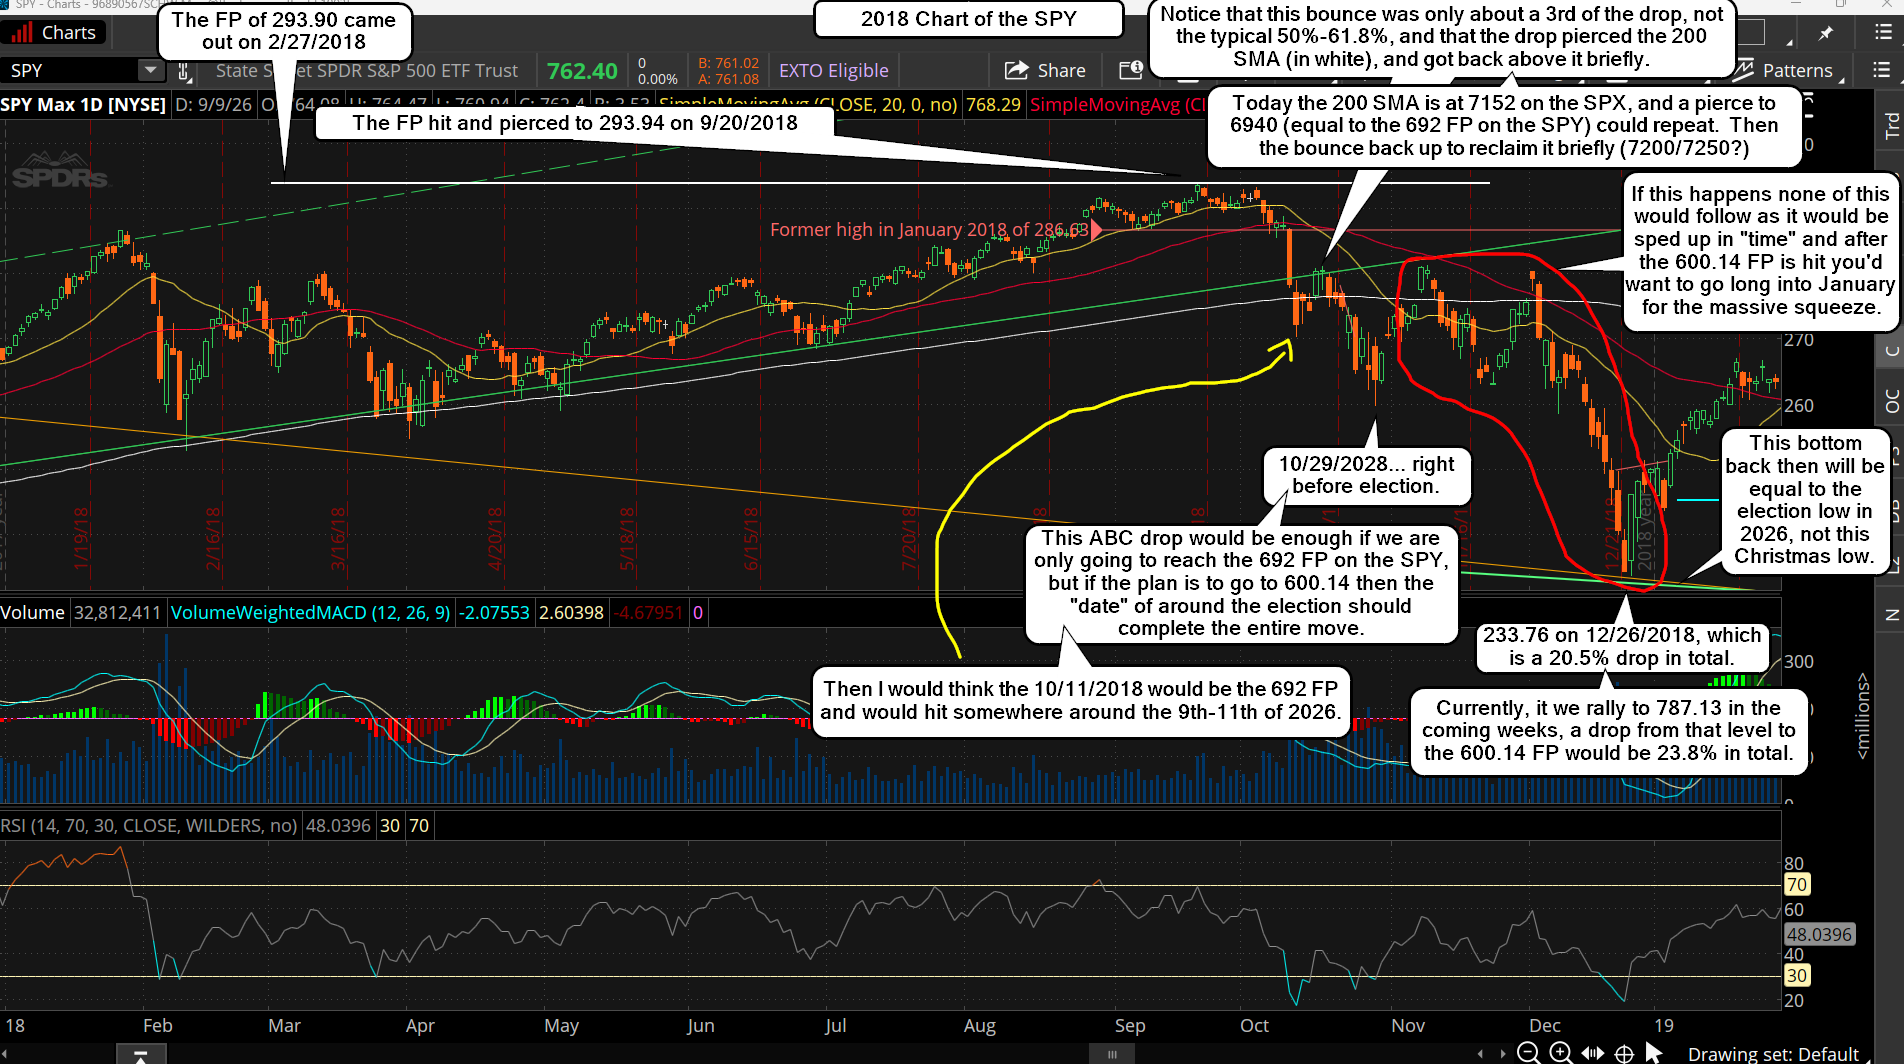
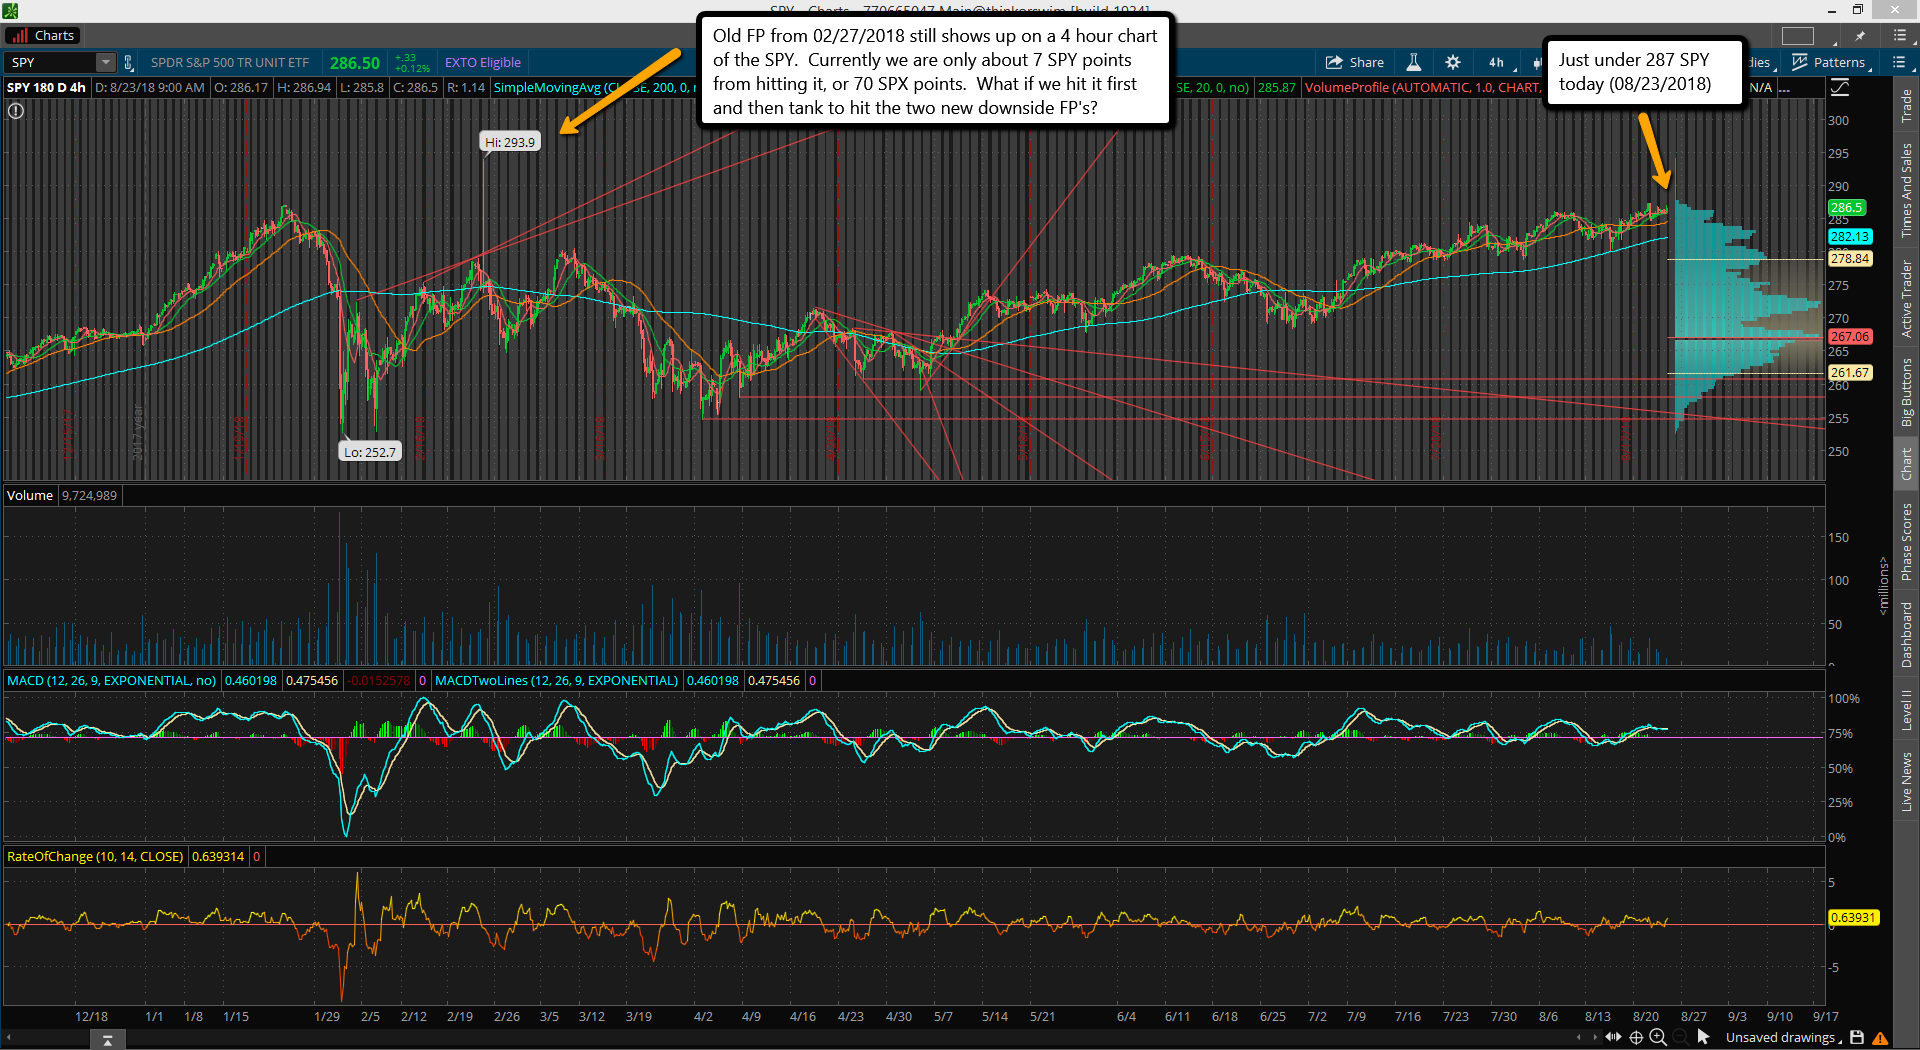
The range for the upside "Fake Print" of 787.13 to get hit (and pierced) is still around September 22nd to October 3rd. It's a wide window but it's reminding me a lot of the 2018 FP that appeared on February 27th of that year, which was for 293.90 on the SPY, and then hit on September 20th, 2018... which was pierced by only 4 cents (293.94). The market pulled back very small (more chop basically) and went back up to retest that high (slightly lower high at 293.21) on October 3rd, 2018.

After that it fell apart and bottomed into October 29th with an ABC pattern down. It rallied half the drop and did another ABC down into a Christmas Eve final low, but I'm not expecting that part to repeat. If we see the 692 FP hit into the coming November election I think that will be "the low" and we won't see the 600.14 FP until some other time in the future. I suspect everyone will pick up the 2018 pattern when the 692 FP is hit and will short the rally up after it expecting to see it repeat into another Christmas low, but I don't think that will happen.

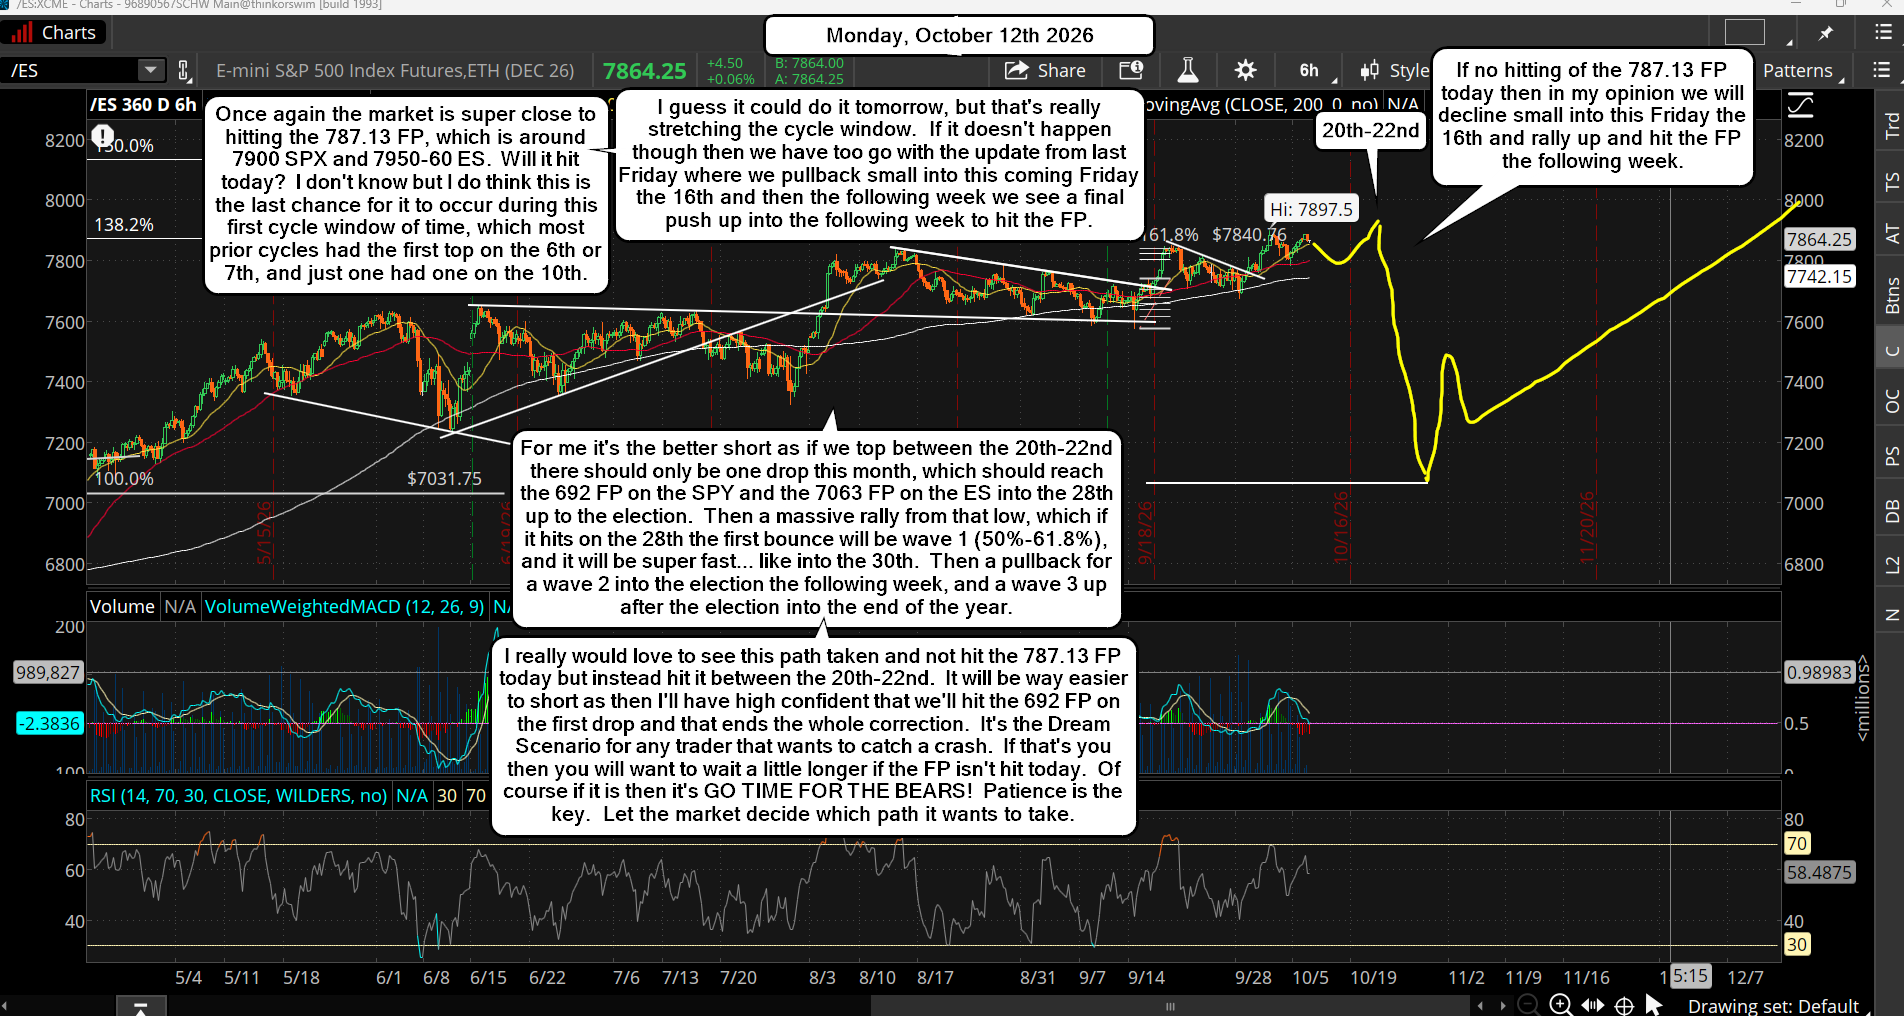
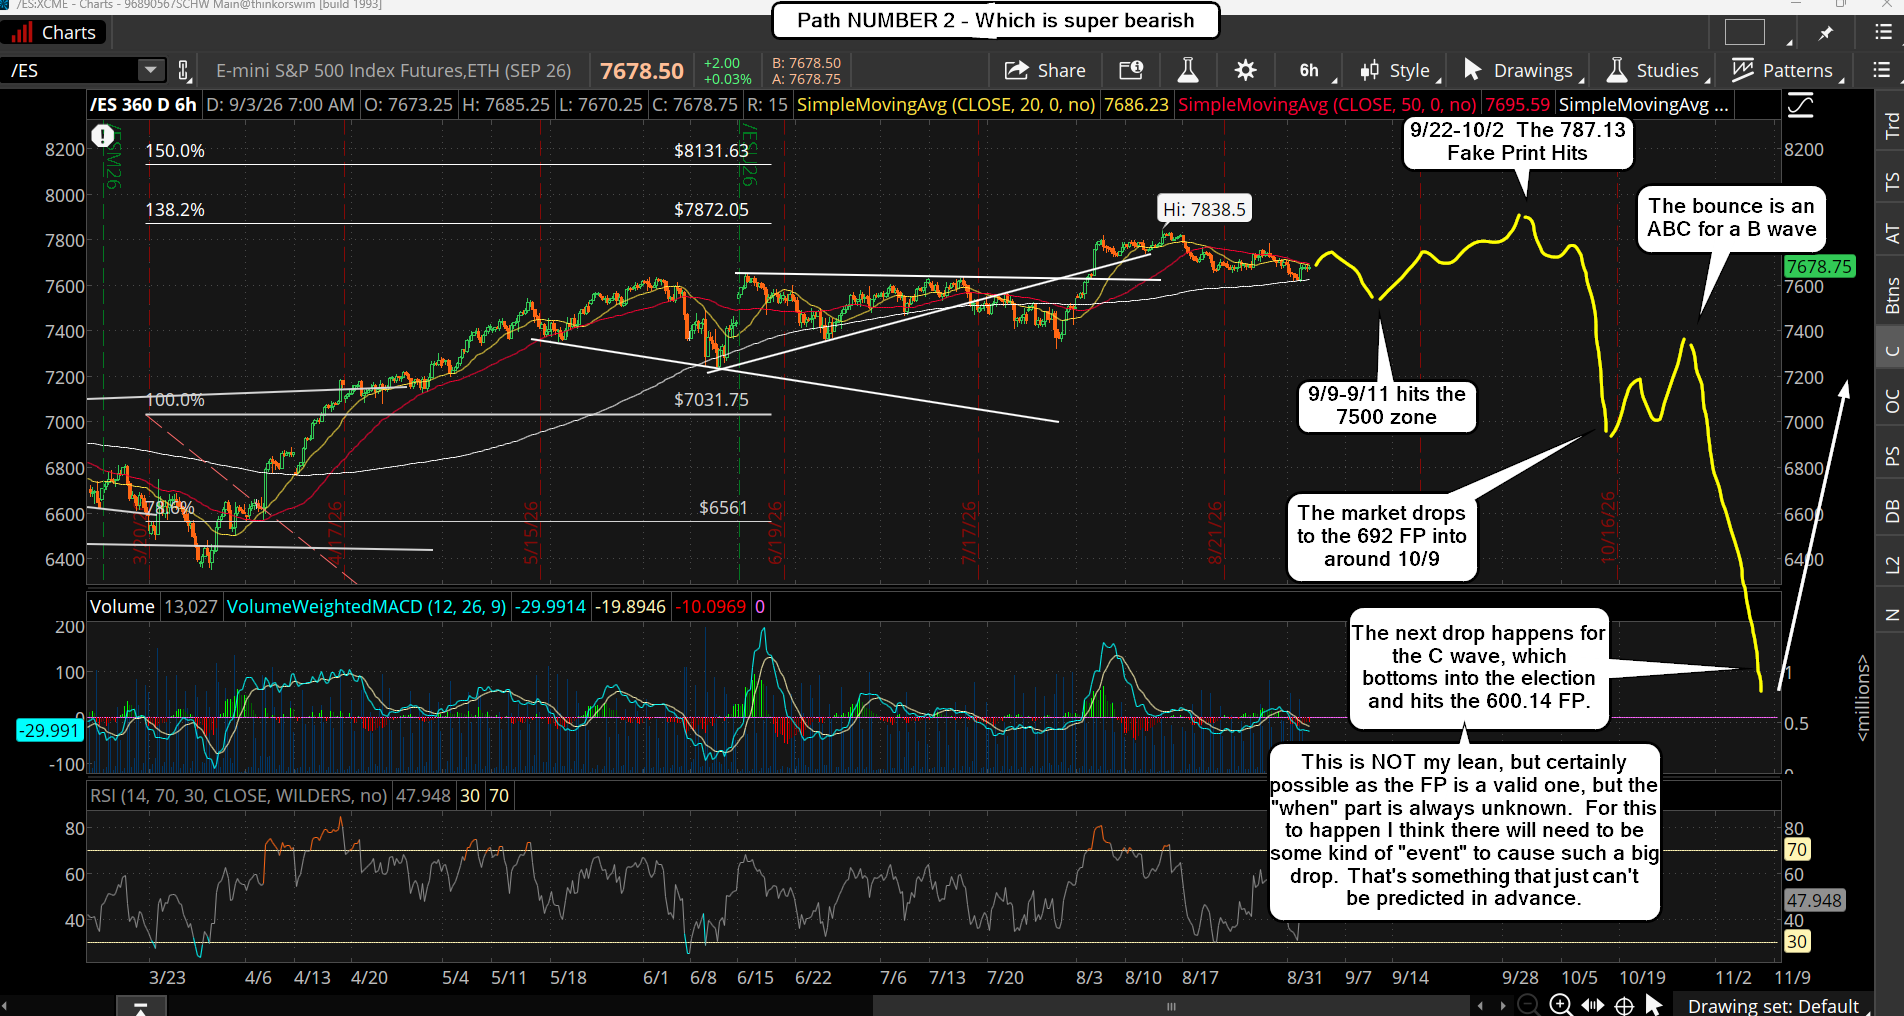
I am open to the idea that the 600.14 FP is the low into the election, and that the first drop down to the 692 low happens into October 9th-11th (in 2018 the first drop for the A wave end on the 11th). If we see this happen then we could see a similar move up like 2018 where we top for the B wave around the 17th and the C wave drops to the 600.14 FP into the election. That chart is below...

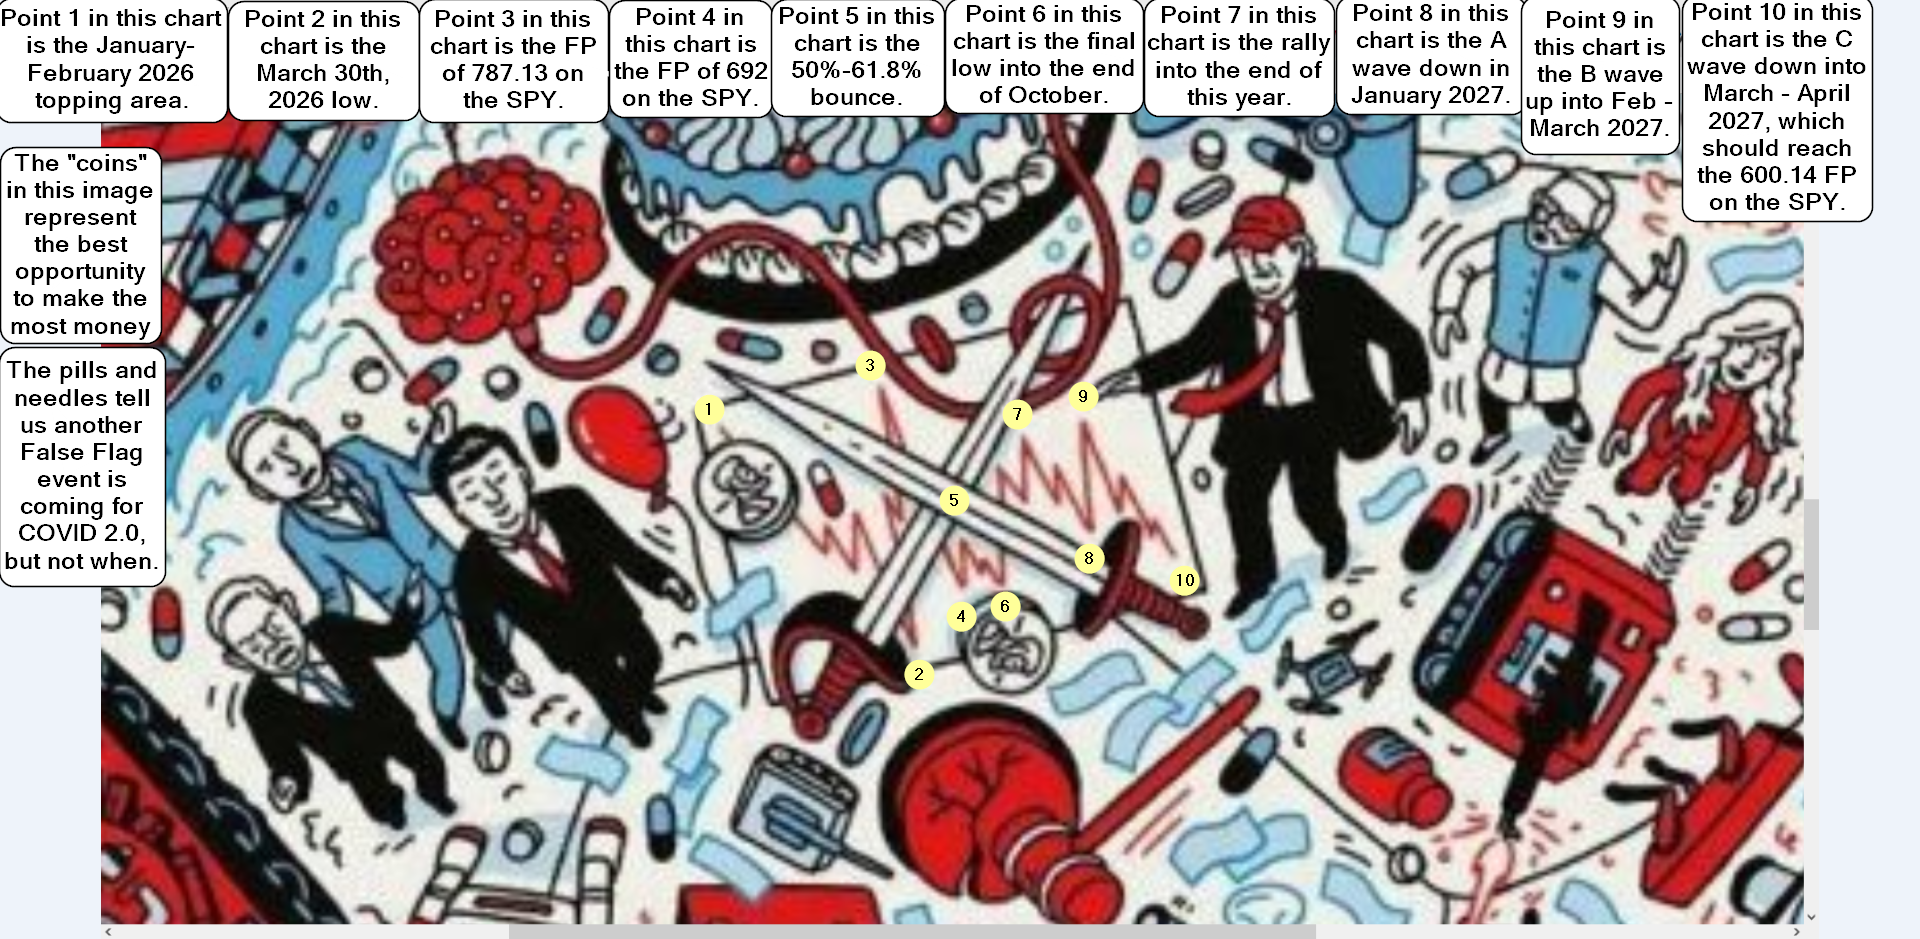
This is Path Number 2 that I mentioned last week, which is possible. I don't know what is coming in the near future but I feel like it will take some kind of "event" to cause the drop to happen to the 600.14 FP as that's very deep. It would end up being similar to 2018 in percentage for the entire correction as that one was 20.5% in total and from 787.13 to 600.14 is 23.8%... so that's "close" to the same. What kind of event could cause such a drop you ask? I don't know but I found the video below very interesting at the 32 minute mark.

If something bad happened to Trump the market would fall off a cliff for sure. I certainly don't want anything like this to happen but he is up there in age and very overworked with tons of stress on him, so he's susceptible to having health issues. I pray nothing happens, but the FP's are real targets that will be hit at some point... when is always the "unknown". Maybe it will be some other unknown event that happens to cause the drop to the 600.14 FP into the election? If that's the plan then let's hope it's something else.

Something BIG is coming according the Bo Polny, and while you can't always assume that anything he predicts will affect the stock market I have the FP's, the seasonal's, and the cycles to back up his prediction.  Below is his latest video, and around the 1 hour mark is when he talks about the stock market.  Do note that his super important date of September 24th is right in the middle of the 9/22 to 10/3 window that the cycles say a high should happen at.  Possibly we hit the 787.13 FP on the 24th, or the day before?


For the short term there's nothing to add as the market continues to chop in a tight range that is not tradable in my opinion. I'm waiting patiently for the upside FP of 787.13 to get hit (and pierced) sometime in the next 2-4 weeks.

Have a great weekend.

ES Morning Update September 3rd 2026

0

Same ol' same ol'.... the market continues to chop around going basically nowhere. Everything from last weeks' update is still valid and on track as I'm still expecting more rangebound action into the expected low around the 9th-11th. I don't know "how low" but I suspect the 7500 level will hold.

After that the market should turn back up for the rally up to the 787.13 fake print target on the SPY, which is about 7900 or so on the ES, and of course these fake prints get pierced through by some amount, so the low 7900's on the ES should be reached. It goes back to my thinking that once we get that close to the 8000 everyone will be super long looking for it to hit, but it should not hit as we all know that if everyone is on the same side of the boat it usually rolls over.

We'll see 8000+ but not until "after" a correction of 10-12% (most likely) or a deeper one to the 600.14 FP on the SPY. After the low the next rally up should last into January of 2027 where 8000 will be hit and surpassed. But the correction must happen first as the market will need everyone to believe we are going much much lower, and of course that means a nasty drop has to happen to get the bears fully awake.
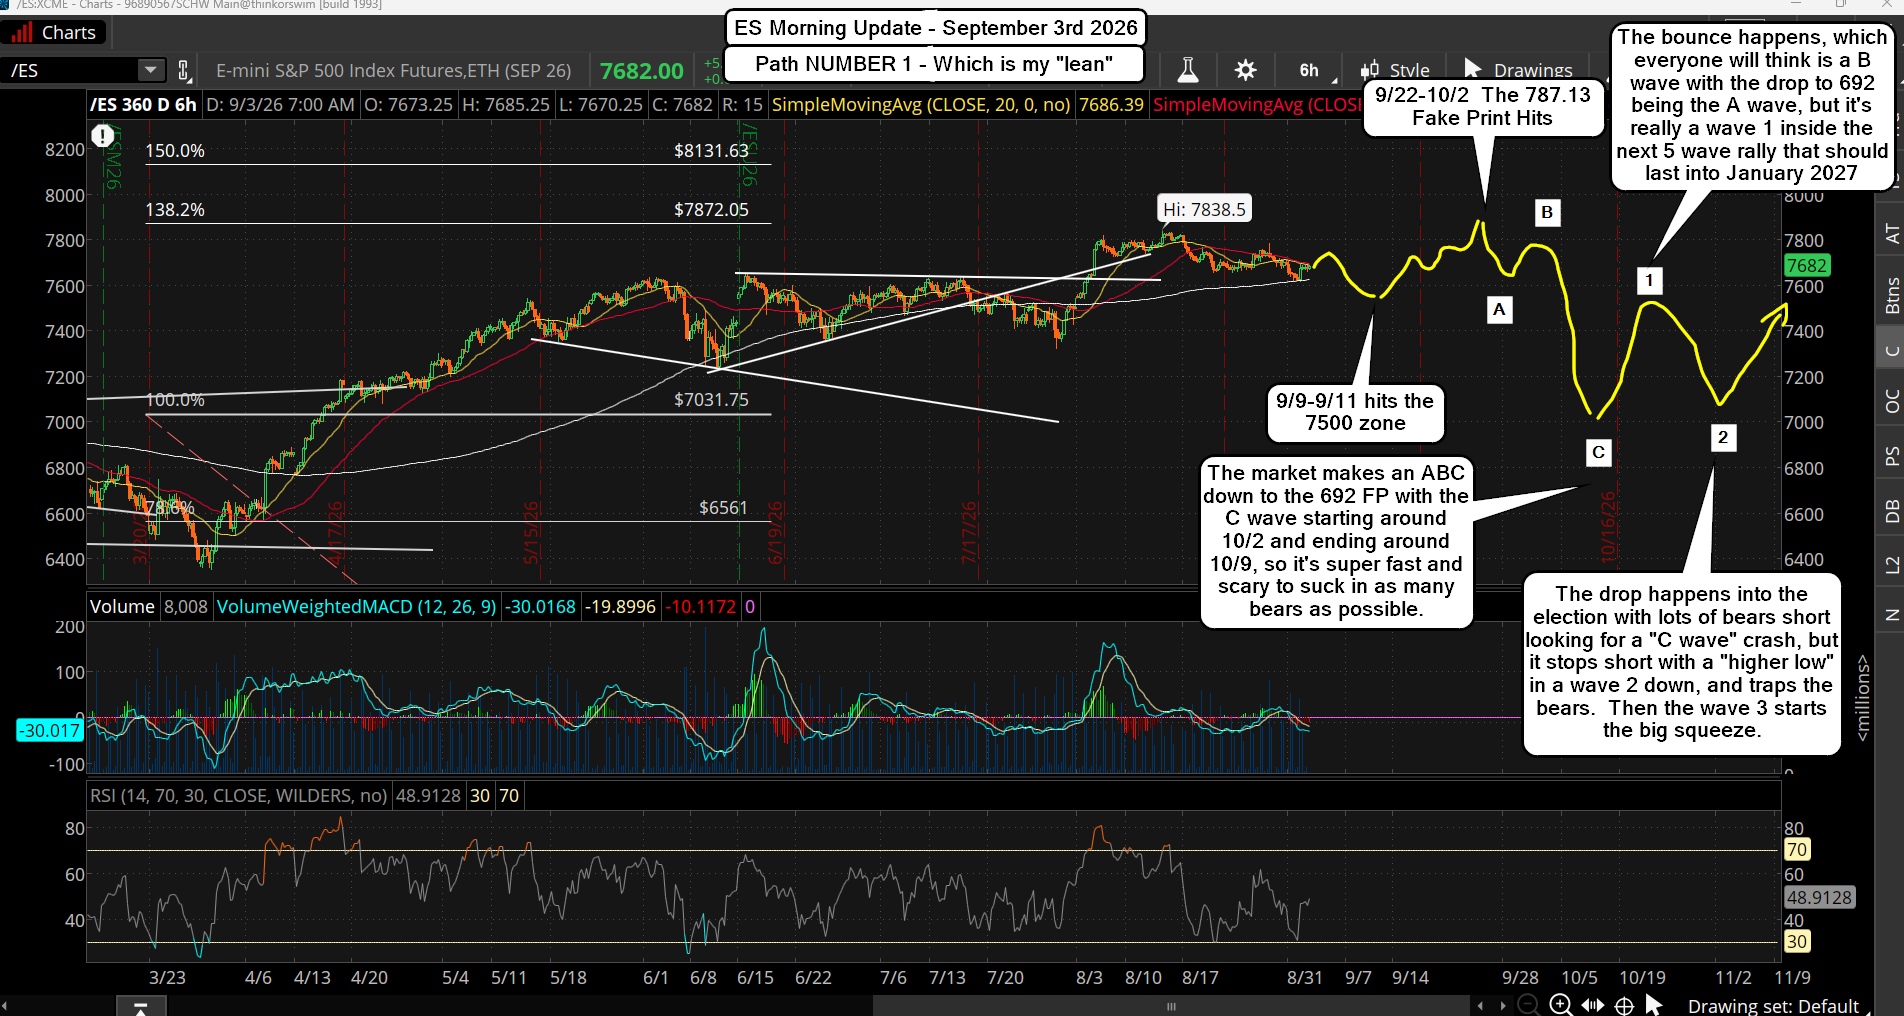
The turn window of September 22nd to October 2nd is still likely for the top, and after that the next turn window is around October 9th for a low. Will that be the 692 FP low is the question I can't answer? Maybe it's just a shallow pullback to the 7500 area (again... if we hit it going into 9/9-9/11) for an A wave down, then a B up into mid-late October and the C down into the November election to hit the FP. Or... we hit the 692 FP with that first drop into 10/9, then the rally up into mid-late October is either a B wave bounce (which could then have a C wave drop to the 600.14 FP afterwards), or a wave 1 up for the next 5 wave series of waves into January of 2027.

If it's the wave 1 up then the wave 2 down into November 3rd/4th should be a scary one that makes a "higher low" to make all the bears short it hard as they will think it's the C wave down to the 600.14 FP but the drop stops shy of breaking the prior low (the 692 FP) to trap them all short. From there the mega squeeze starts after the election with a wave 3 up. That pullback could look like a double bottom where it retraces 99% of the wave 1 up, but doesn't break the low. It is my lean to what I think is likely to happen.

You get everyone shorting the rally up from the 692 low (again around 10/9) and when it's back down to that same area around the election the news will be pumping out tons of fear about the election results and that will suck in the most bears. After the election is over (regardless of the results) the market will squeeze the crap out of them the rest of the year.

That's all just my speculation of course, as I could be wrong and we see the C wave down to the 600.14 FP into the election, but either way there are "key time points" that we should all focus on. One is the 9/22-10/2 where the 787.13 FP should put in the top. Then the 10/9 low window, and the 11/3 (final low) window. No matter how it plays out I think the best buying opportunity will be around the low into the election. Whether or not that's a higher low (then the expected 692 low into 10/9) or a lower low (the 600.14 FP) is unknown.

But I will setup my short around the 787.13 high, down to the 692 FP, with a window of time from the 9/22-10/2 top to the 11/3 bottom. If it hit into the 10/9 low I'll do very well and will go to case and wait on the bounce into mid-late October, and then let the last drop into the election happen without me onboard. I won't care if it hits the 600.14 FP or make a higher low then the 692 FP as the price level at that date won't matter... the only thing that will is the fact that it will mark an important bottom where a massive squeeze will follow. Keep your power dry and stay patience is what I'm doing, as two incredible opportunities are just weeks away now.

Have a great weekend.

ES Morning Update August 27th 2026

0

Still a boring market and I'm still waiting until the "time" and "price" is right, which for me is the 787.13 FP on the SPY, and window where it should be hit is between September 22nd to October 2nd. Between now and then I think we will continue to stay range-bound between the current all time high and the 7500 zone, which I think we'll see that low hit into September 9th-11th.

Right now I think we finished an A wave down and are in a B wave up now, which should end early September and then a C wave down into the 9th-11th where I think we'll see 7500 or so. Now that's not much of a change from last weeks post, but on that last post I suggested the low on the 26th-31st would end the wave 4 down and the low around 9/11 would be a higher low. Now I think it will be a lower low and that's where we'll end the wave 4 down.

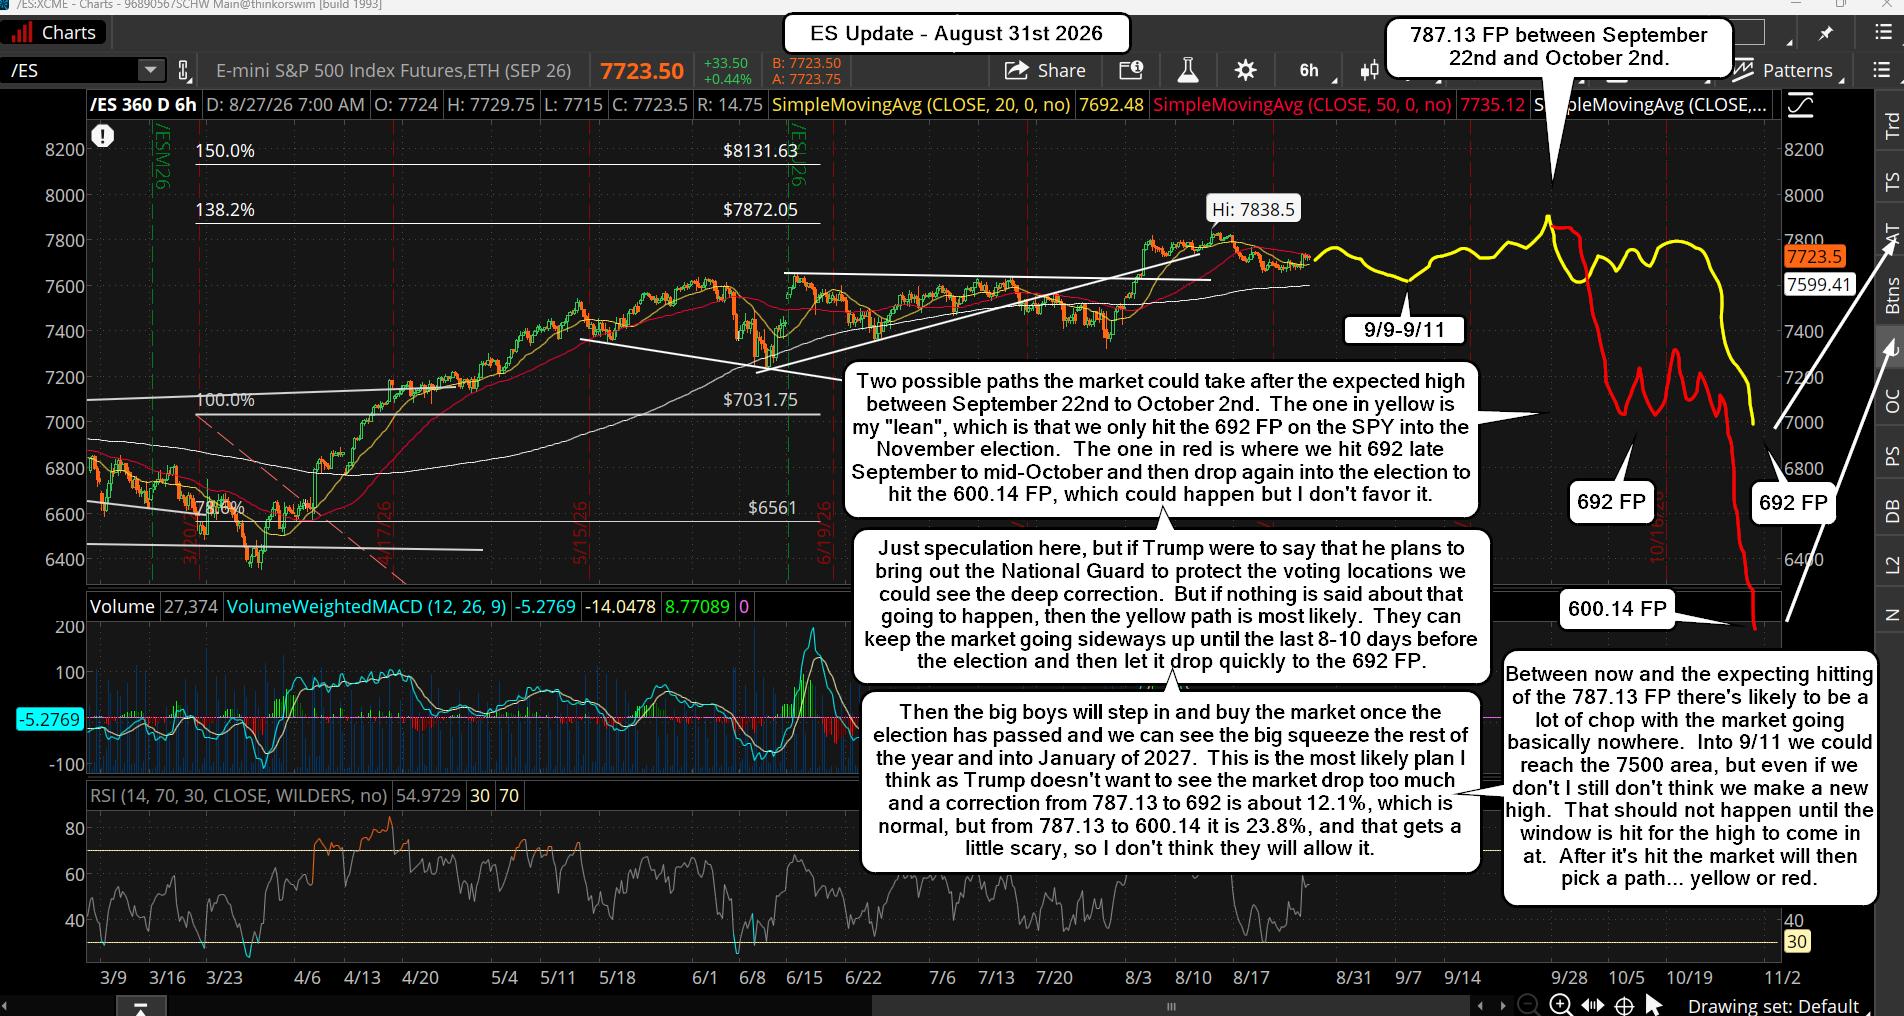
From there the last move up into late September should happen, and while we could get some massive squeeze to 8400 or something I just don't see it. I give it low odds as I believe in the FFP will mark the high. Everyone will be long looking for 8000+ and it won't happen. From that high we should decline into the election where a final low should appear. There are two downside FP's that could mark that low, which are 692 and 600.14 on the SPY. I do not know which one will be the target, but as the decline gets going we should know what path it is going to taken by the "time" it takes to hit the first target.

Meaning that if we hit the 692 FP by mid-October then we can speculate that we are declining in an ABC where the 692 FP is the A wave and the C wave would end early November at the 600.14 FP. But if we chop around most of October then we could see some 8-10 day drop for a C wave into the 692 FP by the election. If that happens then we won't see the 600.14 FP hit whatever low we get into early November will be "the low" and we'll rally hard the rest of the year. This is just a waiting game for me as I'm not doing anything until September 22nd to October 2nd where I'll look to short the 787.13 FP and target the 692 FP into November 6th or so. Then I'll wait to see if the FP is hit early or if it hits at the last week of October in the election.

Have a great weekend.

ES Morning Update August 20th 2026

0

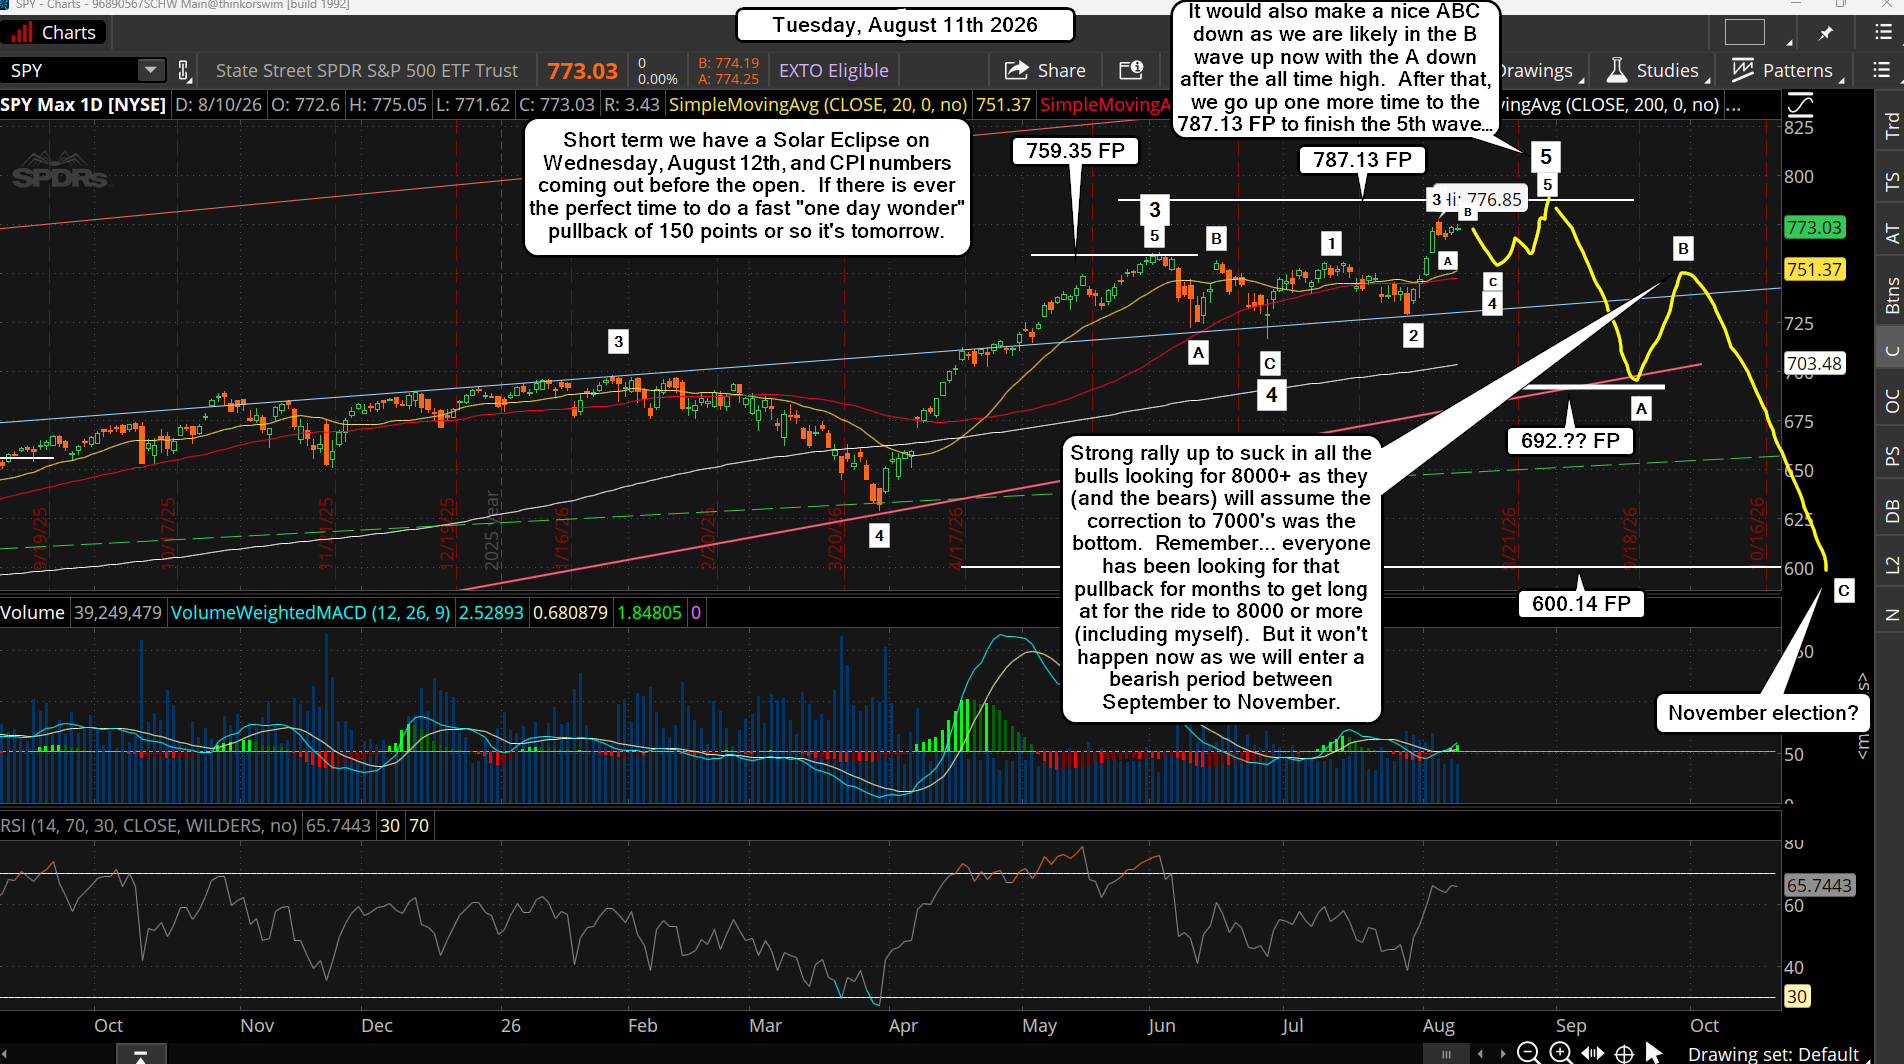
The Dog Days Of Summer are here as the market continues to trade in a range. It did a fast squeeze last week on the 13th to make another new high, but has fell back since then. I was hoping that would be a nice "one day" wonder down day of 100-150 points but it squeezed higher instead.

Now we are in the pullback mode, and while I had hoped that we'd see the 787.13 FP on the get hit into the end of the month (still possible) I lean toward that turn date window to becoming a low instead. I suspect we are in an ABC down right now and yesterdays low ended the A wave, and we are in the B wave up now. It's probably some kind of wave 4, and I suspect it will end around the end of this month, which could be either the 26th, 27th, 28th, or 31st... that's the 4 day window.

Question is... how low will it go? I don't know of course, but I don't think it will take out the July 29th low. Most likely it will be a higher low then that level, and probably in the 50% to 61.8% pullback zone from that rally up to the current high. That rally started at 7324 and the top is 7838, so half of that would be 257 points down, or 7581. If it's 61.8% then that would be 317 points or 7520 roughly.

After that we should start back up for the final rally, and a lot of people are looking for 8000, 8200 or 8500 into mid-late September. It could happen but I just can't stop thinking about the 787.13 FP on the SPY as if we only reached that level (about 7900 ES) everyone would be so bullish, calling for 8000+, that it would be the perfect spot to top out and reverse back down with everyone long.

However, if this is going to play out I have to think we will pullback deeper first before doing the last big squeeze. I could be wrong and we could just chop in a wider range between 7500 to 7838 into the turn date of September 11th, where a low should appear. It's from that low that the market should start the strongest part of the last rally up. I'm thinking that the ABC wave 4 down, that we are likely in right now, will end around the end of this month... then a wave 1 will go up into early September, and a wave 2 pullback into 9/11, and from that low the wave 3, 4 and 5 starts for the final 5th wave up to wherever.

Again, we could go to 8000+ but I just think we might stop at the FP on the SPY and that's all we get. Maybe the pullback expected in the 11th will be back to 7500 or so... like a double bottom from the current ABC down for wave 4 that I think we are in now. From there we could easily squeeze 400 points in a few days to reach the 787.13 FP and then stop and go sideways for awhile to build a bull flag so that all the bulls load up long around that 7900 level looking for the breakout to 8000+, but then something happens and the market rolls over hard and starts the big drop to at least the 692 FP, if not the 600.14 FP on the SPY... who knows for sure?

Bottom line here is that I don't see anything I can risk a trade on until either the end of this month, or most likely the 9/11 expected low. It's a low volume market that the big boys aren't trading now but will be back after 9/11 to start putting money back to work. Will we get the blow off to 8200 or 8500 from it? Anything is possible but my past history with FP's tell me the top will be the slight piercing of 787.13 SPY in mid-late September.

Have a great weekend.

The SPY Fake Print Could Be The Coming Top

0

I've been troubled lately by the FP on the SPY of 787.13 and all the calls for 8000, 8200, or even 8500 as upside targets. The history of the Fake Prints that I first discovered back in 2018 has been outstandingly accurate. The "when" part though has been super hard to figure out, but with the additional cycle work and technicals I have a much better "feel" for that "when" part now then 8 years ago. For reference, my first FP is below...

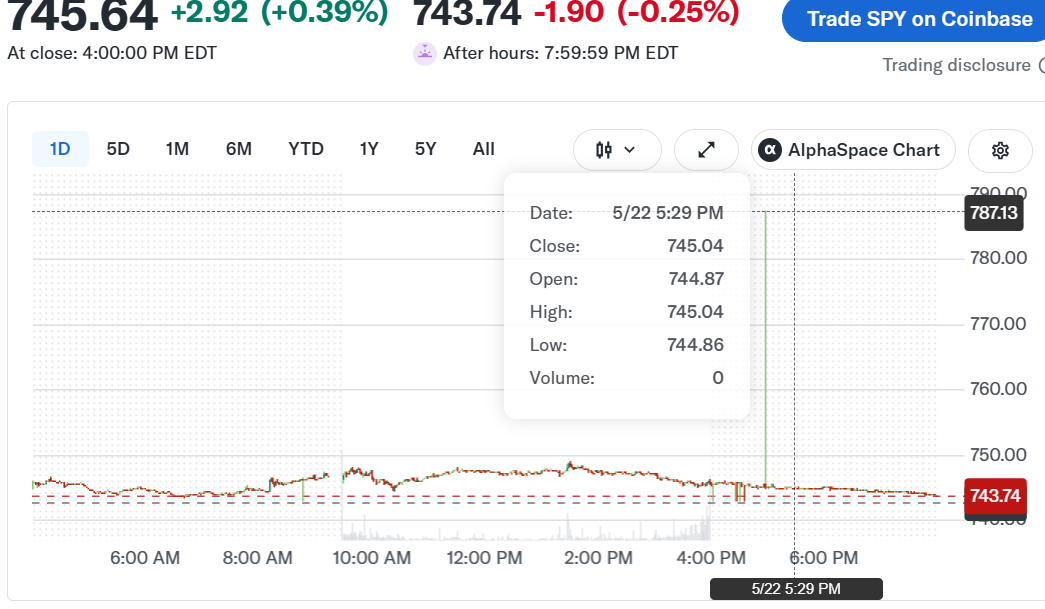
It came out on February 27th, 2018 and hit on September 20th, 2018... so it took 7 months to hit. This "time" isn't relative as some FP's hit in days, others in weeks and some still haven't been hit. My point is that they are very accurate and do mark important "turns", which some last for only days and others last for weeks or months. The FP of 787.13 came out on May 22nd, 2026 and with the market up near an important "blow off" top high, and everyone calling for 8000+ (even me) I have to step back and think about what would screw the most traders now. And with the long history of FP's that I've tracked I know that this 787.13 one is going to produce a very important "turn"... which I think will mark the high for at least several months, possibly the rest of the year. Below is that FP again...

Do I think we will reach 8000+? Sure, but maybe not until next year as the correction coming into the November election should be a deep one that will take some time to retrace back up to make a new all time high again. I think it's possible that we'll see the drop to the 692 FP on the SPY as the first stop after the 787.13 FP is hit. Then a strong rally that gets everyone sucked into thinking the low is in and that we are finally off to see 8000+, but I think it will only be a B wave bounce with the first drop being the A wave. Then a nasty C wave will follow into the 600.14 FP on the SPY in front of the November election. Below is that FP...

What I think is is play right now is some degree of a wave 4 that will chop up and down, making several ABC patterns before the last push up to the 787.13 FP into the next turn date of August 28th, 2026. If we see a pullback soon of maybe 150+ points, then I think we will see a final 5 wave move up (choppy and sloppy) to complete the final 5th wave to 787.13 into the end of this month. That will be around 7900 or so on the ES and once we are there no one will be bearish as everyone will assume 8000+ is next. But that should mark the high and from that level we should drop to the 7000 zone to hit the 692 FP for the A wave, then a strong rally back up for the B wave, which will again get everyone looking for 8000+, but it won't happen. The C wave down will hit the 600.14 FP right into the election to finish it all, and then the bottom is in for a long time and we see the blow off final rally into 2027, possibly 2028 where 8000 will be blown through like cutting butter and much higher levels will be reached. But that's too far out into the future to forecast.

ES Morning Update August 6th 2026

0

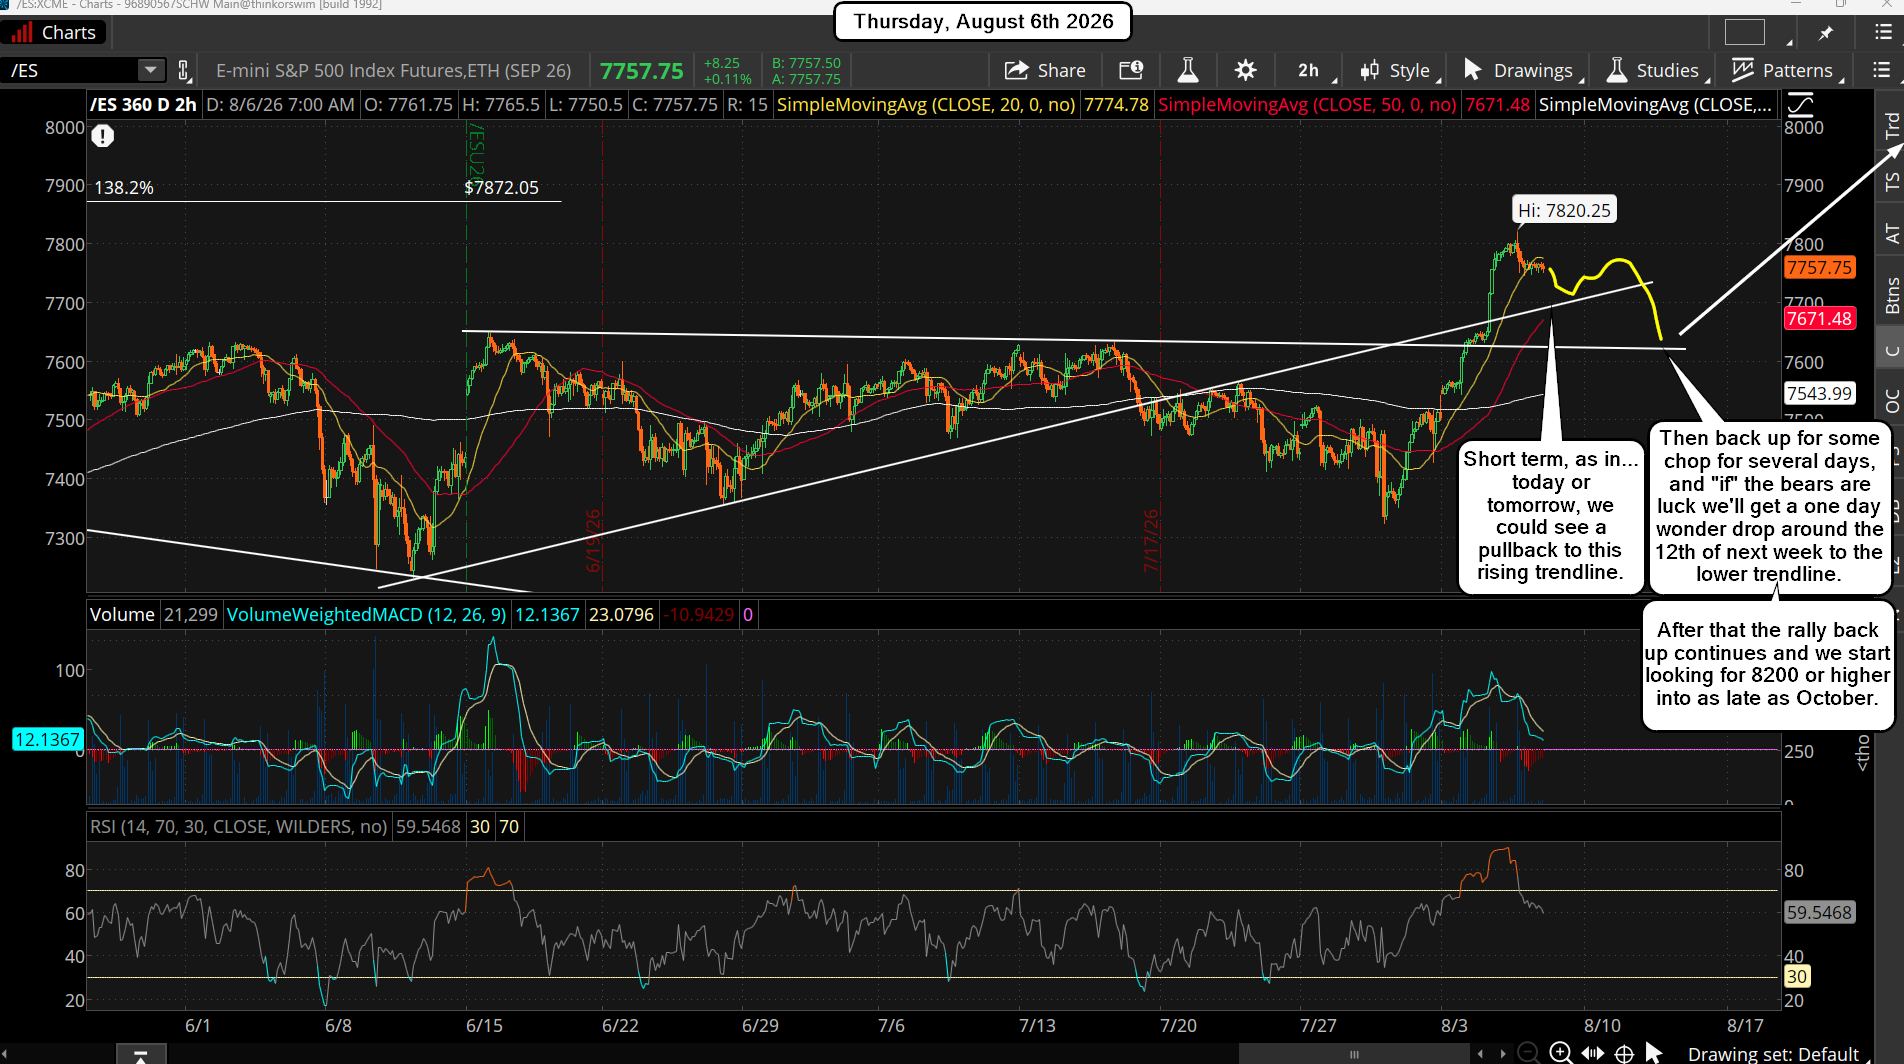
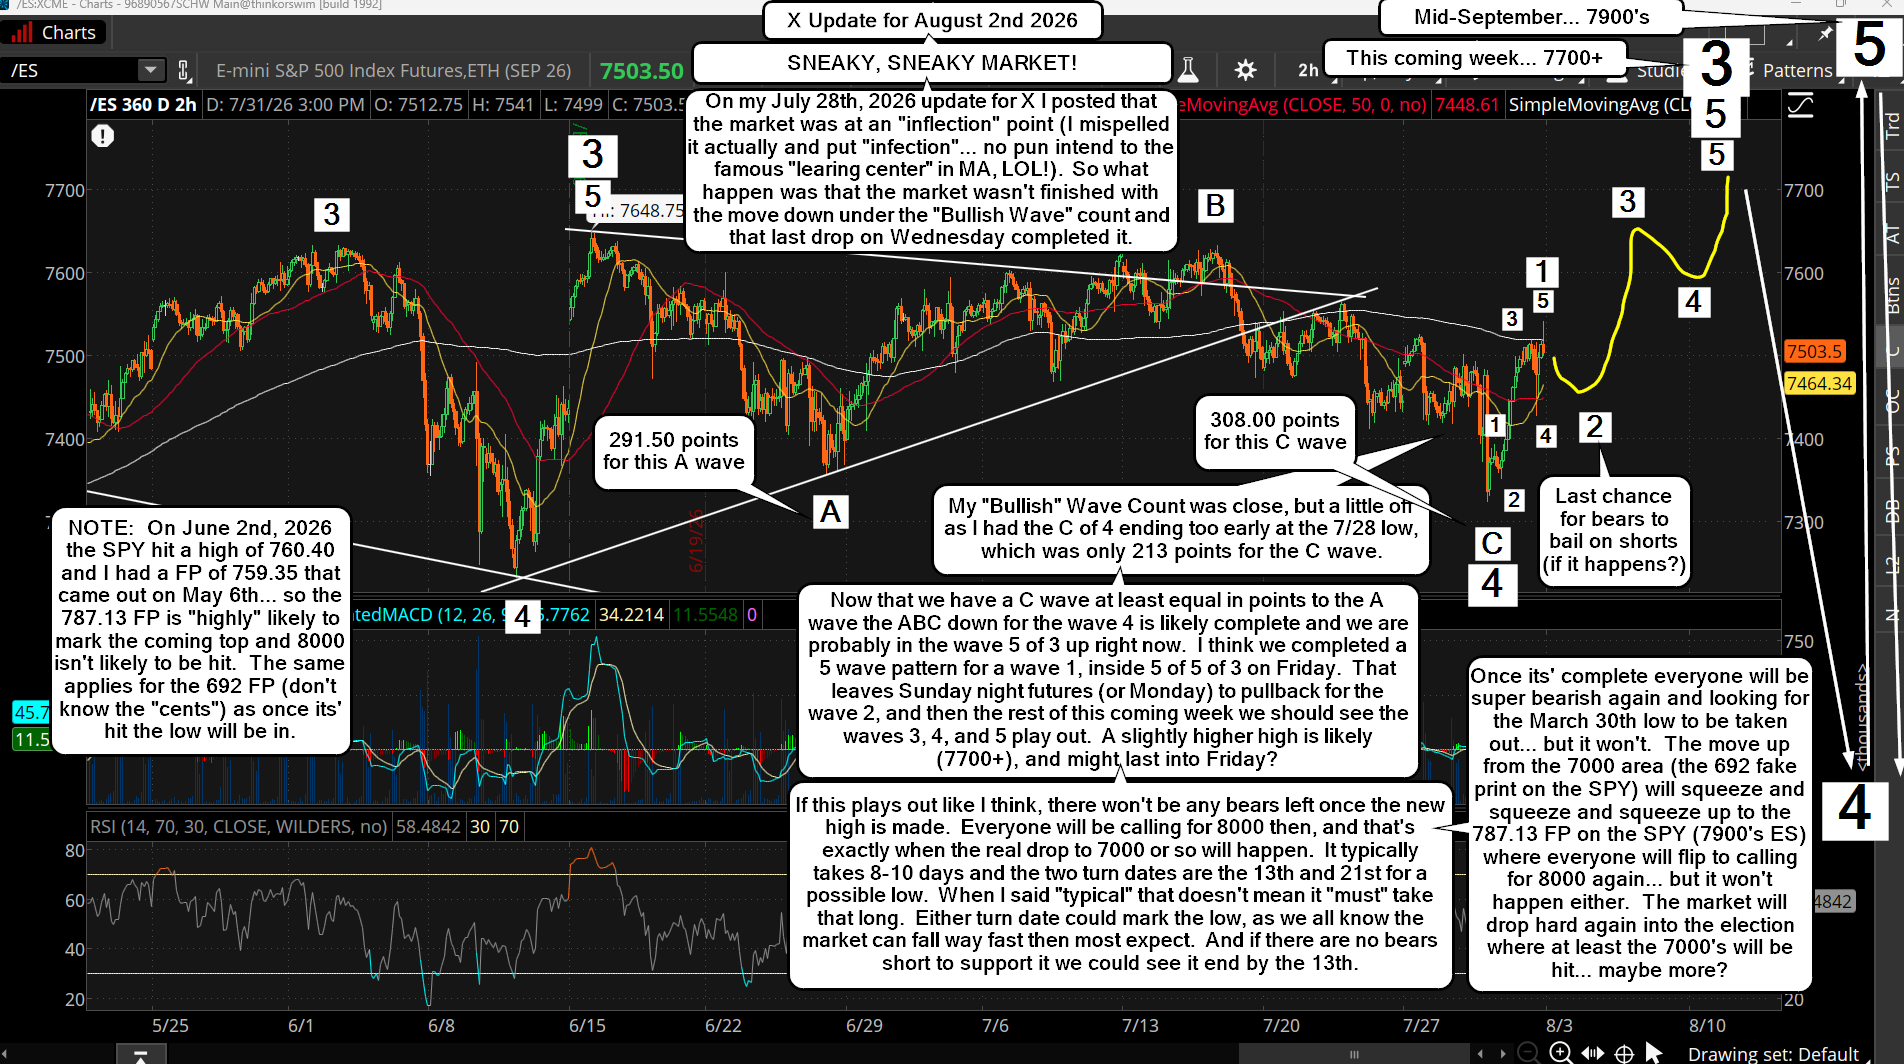
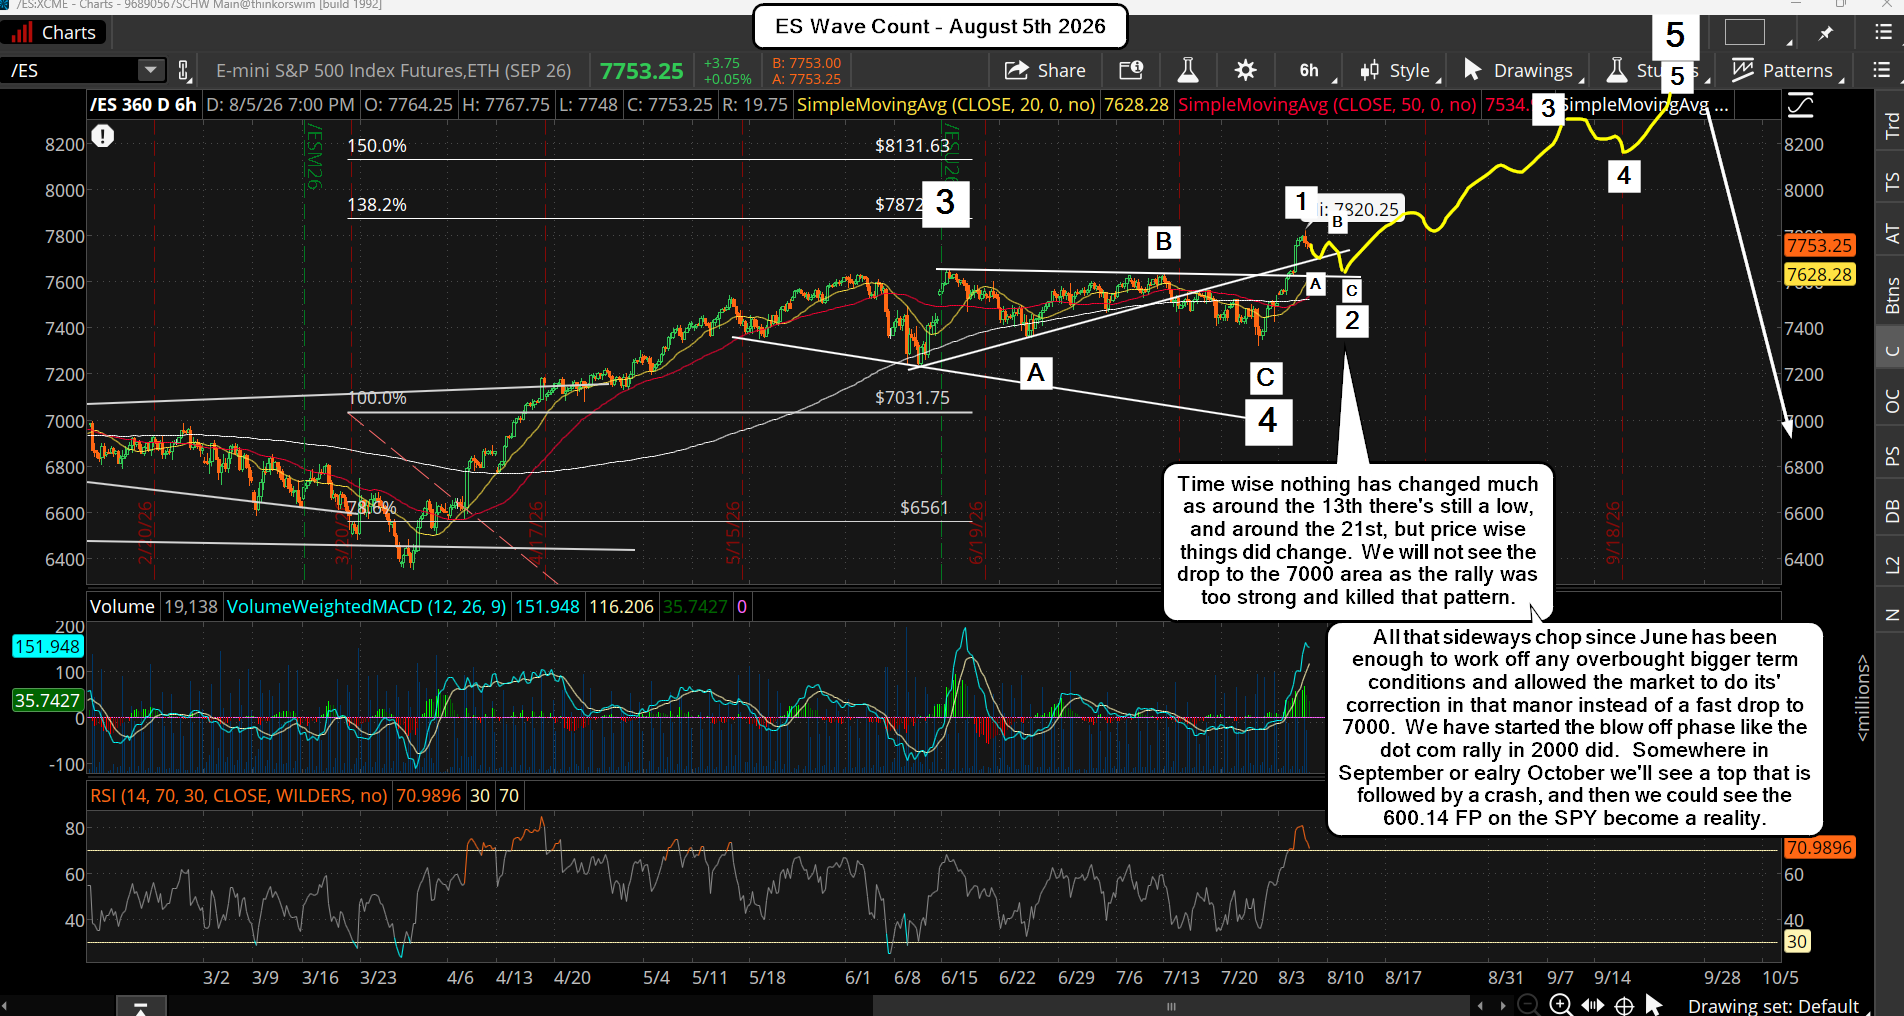
The rally up went too high for the drop to 7000 to happen, so that's dead in the water now. The low for the entire two month correction from the June high finished at the July 31st bottom, and it completed my wave 4 on the chart I posted on X last Sunday night. However, the large wave 3, 4, and 5 on that chart are not accurate. That large wave 4 drop to 7000 isn't coming as basically we have started the large wave 5 up into mid-September for the blow off top. Below is that chart again...

The rally up from the July 31st low started the final large wave 5 up, and w have likely completed the medium wave 1 up already with the recent top at 7820.25 on the ES, and we should be starting an ABC pullback for the medium wave 2, which should last into the 10th-13th window. It might only be 200 points or so, as this bull is super strong.

The 12th has a solar eclipse on it, which is bearish, so that could be where the C wave happens for the wave 2 pullback... meaning that we might chop around the rest of this week and into next week to do some A down and B up before having a one day wonder drop for the C wave on or around the 12th to shake out some bulls, suck in some bears, and complete the wave 2 down.

After that we should start the medium wave 3 up, and I can't see where the 787.13 FP on the SPY is going to stop the bulls. That wave 3 could hit 8200, and then there's still a small pullback for the medium wave 4 and a final push up for the medium wave 5, to complete it all. We could see 8400 or even 8500, who knows for sure? There's another low date on the 21st this month, but it will probably be small as it's likely going to be inside the medium wave 3 up, like a small wave 2 or something.

I've very frustrated that the market never pulled back to the 7000 zone, and worst is that I missed the squeeze up. But the market never makes it predictable as then everyone would win and that's not how the market works. It works by getting everyone on one side of the boat and then sinking it to drown them all, and the bears drowned this week for sure. Just have to adapt and move on I guess. Anyway, for the short term there's probably not much down side the rest of this week. Just look for some chop to make an A down and B up, and "hopefully" we see a one day wonder C wave drop of a couple hundred points next week around the 12th where a long can be taken.

Have a great weekend.

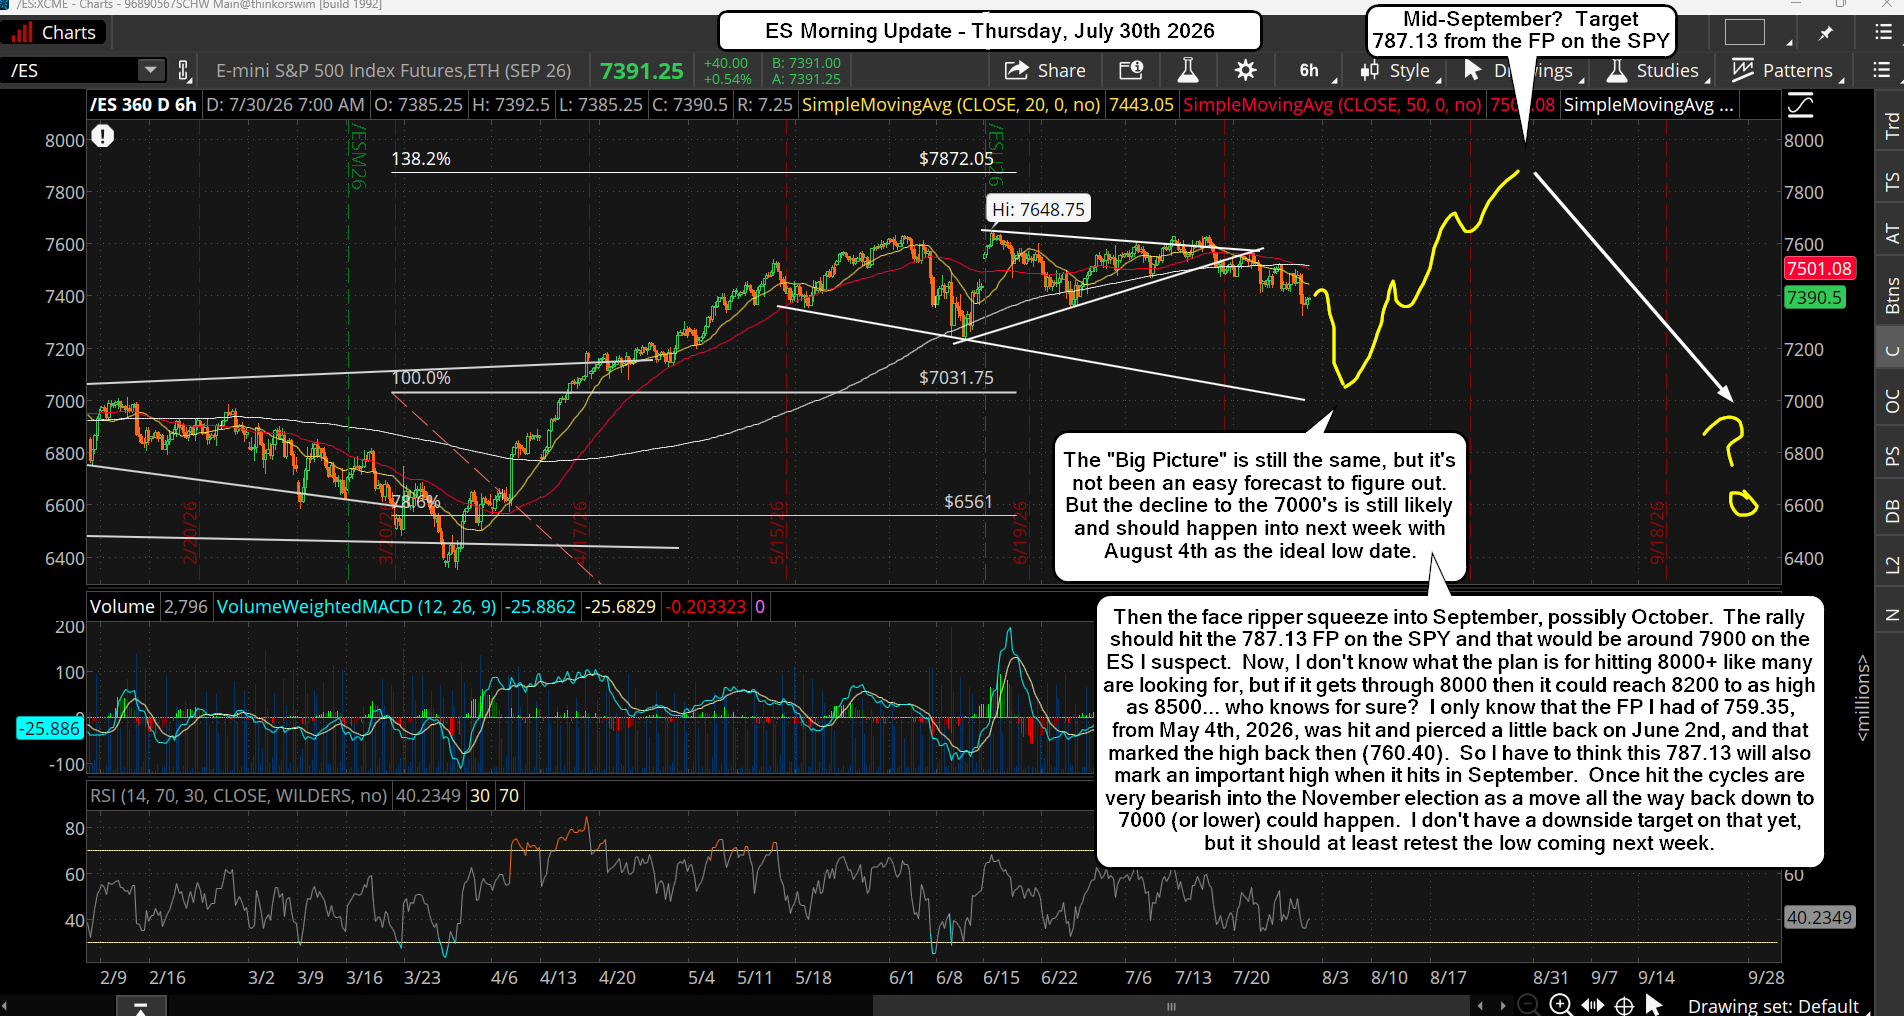
ES Morning Update July 30th 2026

0

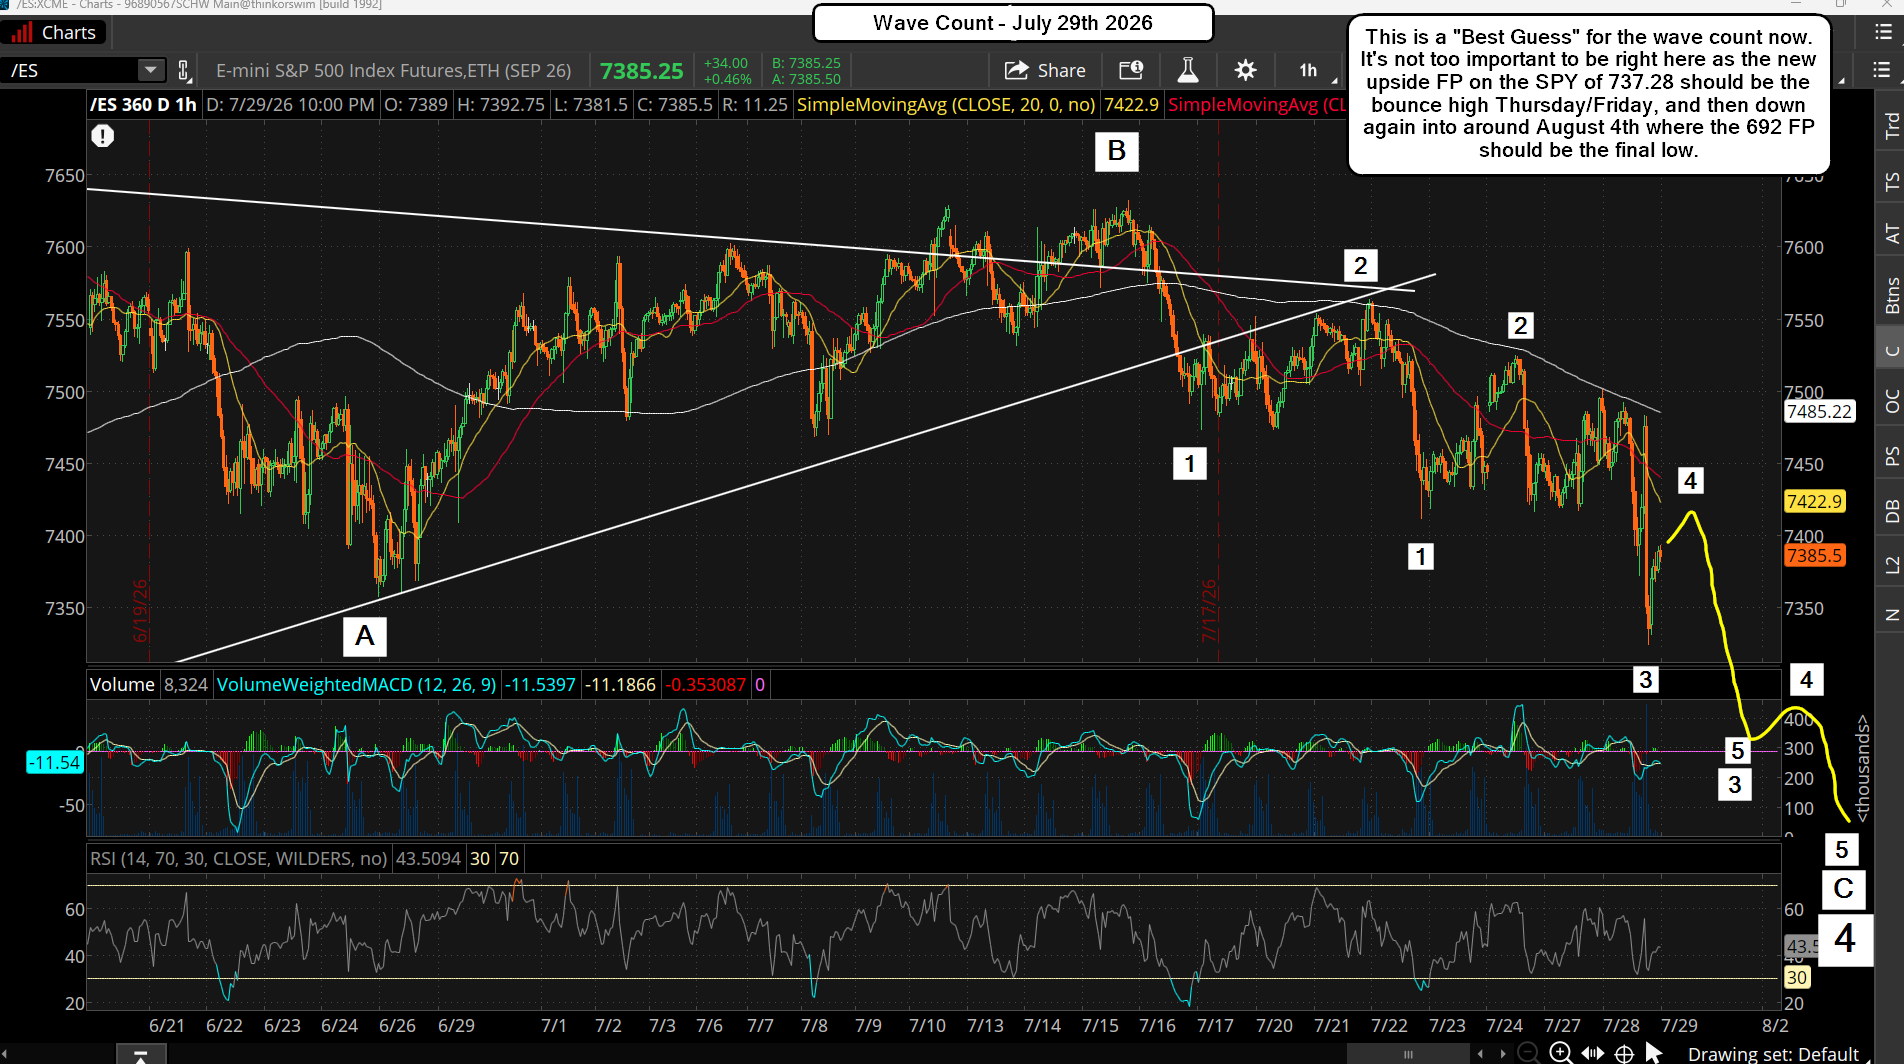
The market picked a direction and it's DOWN like the cycles suggested it should be. It's been super tough to trade as it's been in a choppy range for a month where every drop got bought up, but that 7400 zone of support finally broke yesterday and everything points to the market being in a wave 3 of C down now. It's looking likely now that the August 4th turn date will be the bottom, and I'm still looking for a pierce of the 7000 ES level where we hit the 692 FP on the SPY. Below is the wave count.

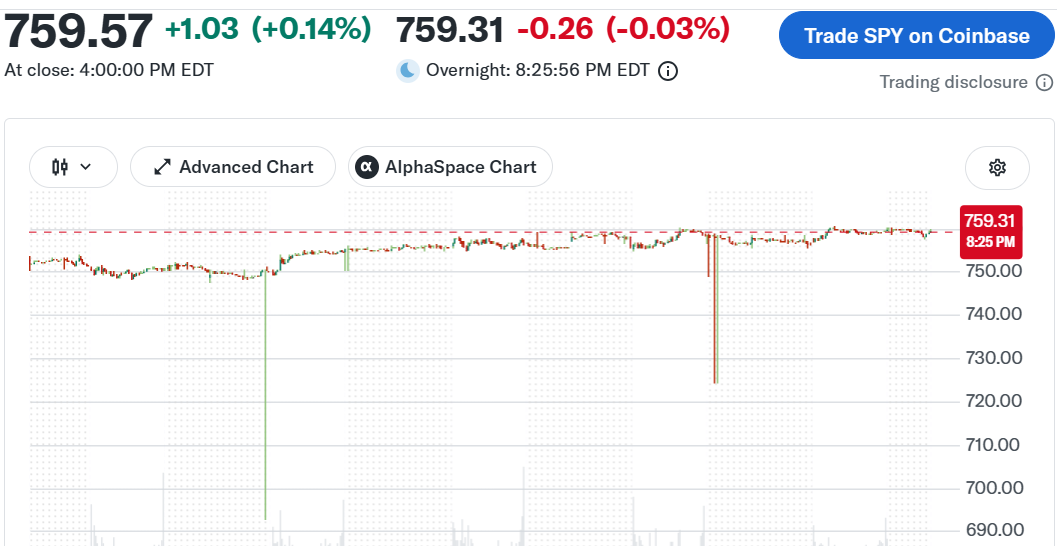
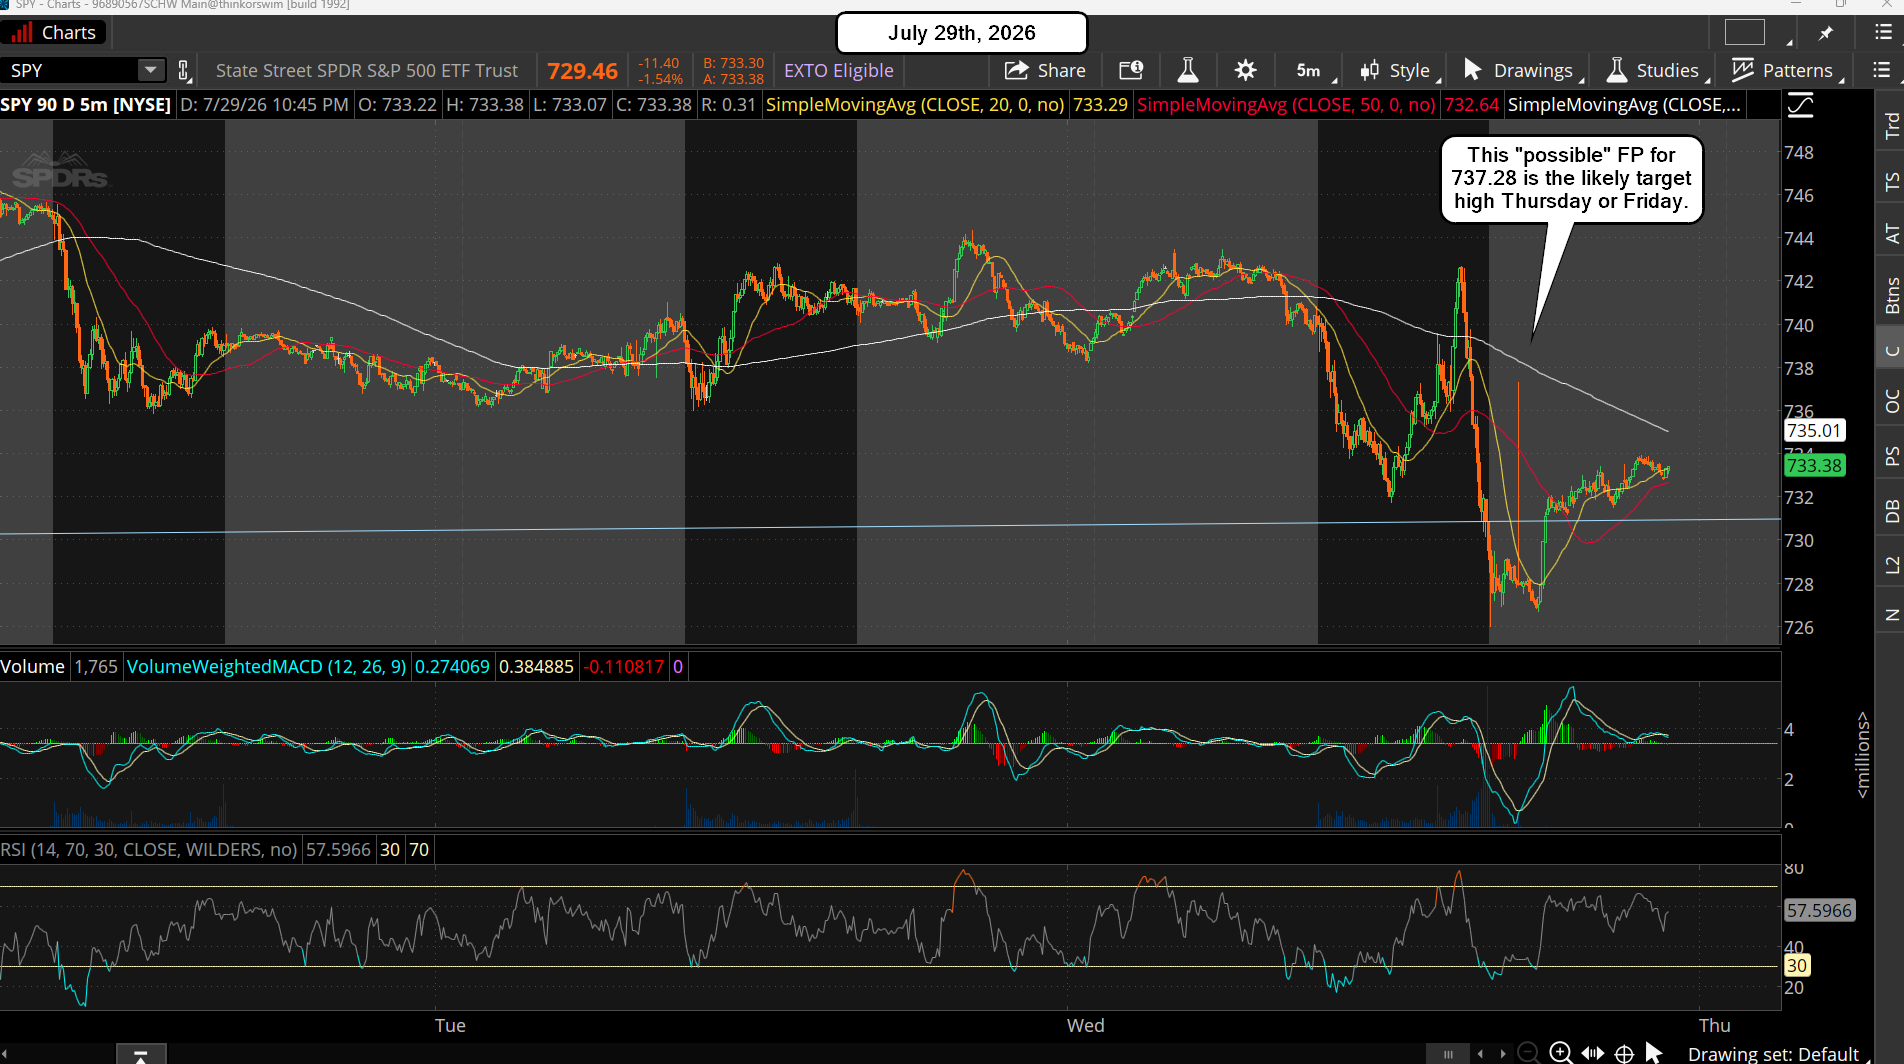
Short term (today or tomorrow) there's an upside afterhours FP on the SPY of 737.28, and it should be the bounce high before another drop lower. Best guess is that it hits today, but it might not hit until tomorrow? That FP in below (screenshot taken Wednesday night).

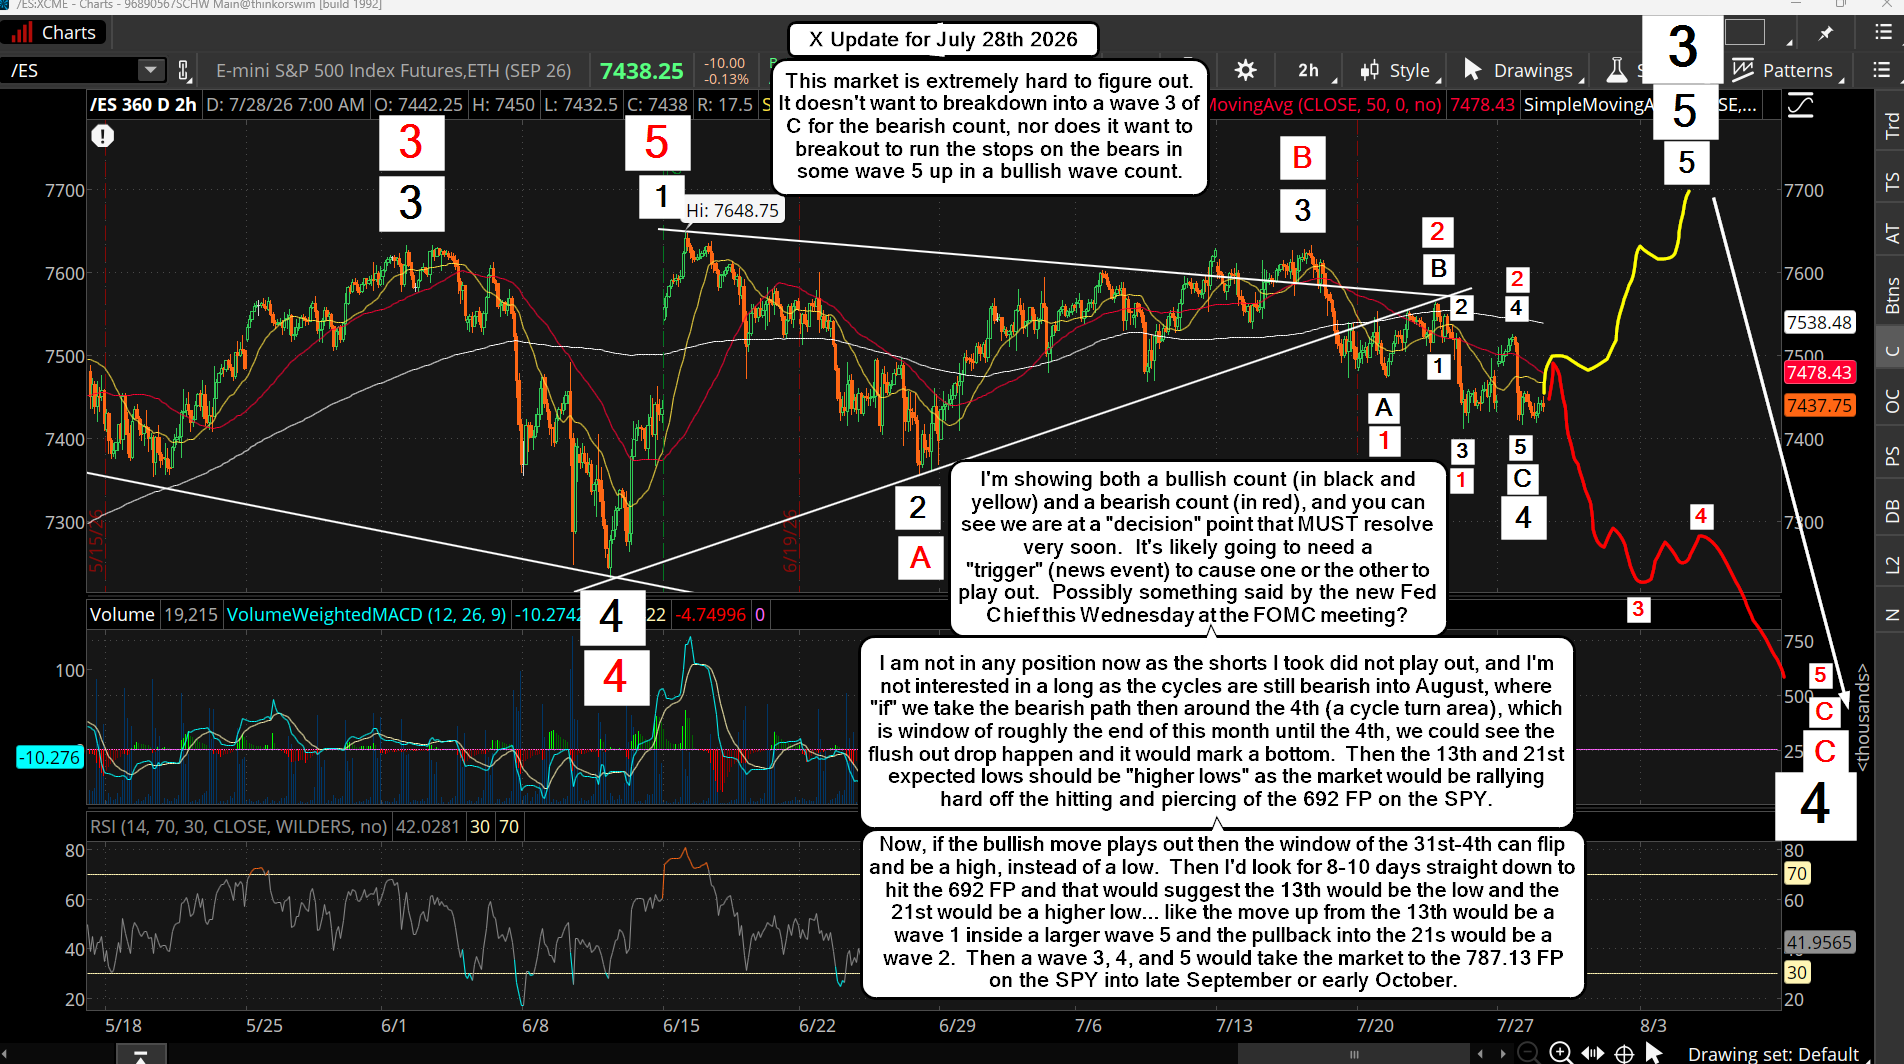
Lastly is the chart I posted on X on Tuesday, which I'm posting again below. It's obvious now that we are on the bearish path and should bottom next week around the 4th, and the 13th and 21st dates should put in higher lows. This assumes we hit the 692 FP into the 4th period, and I think we will. But if we don't then the 13th would be the next date when it should hit.

Have a great weekend.

ES Morning Update July 23rd 2026

0

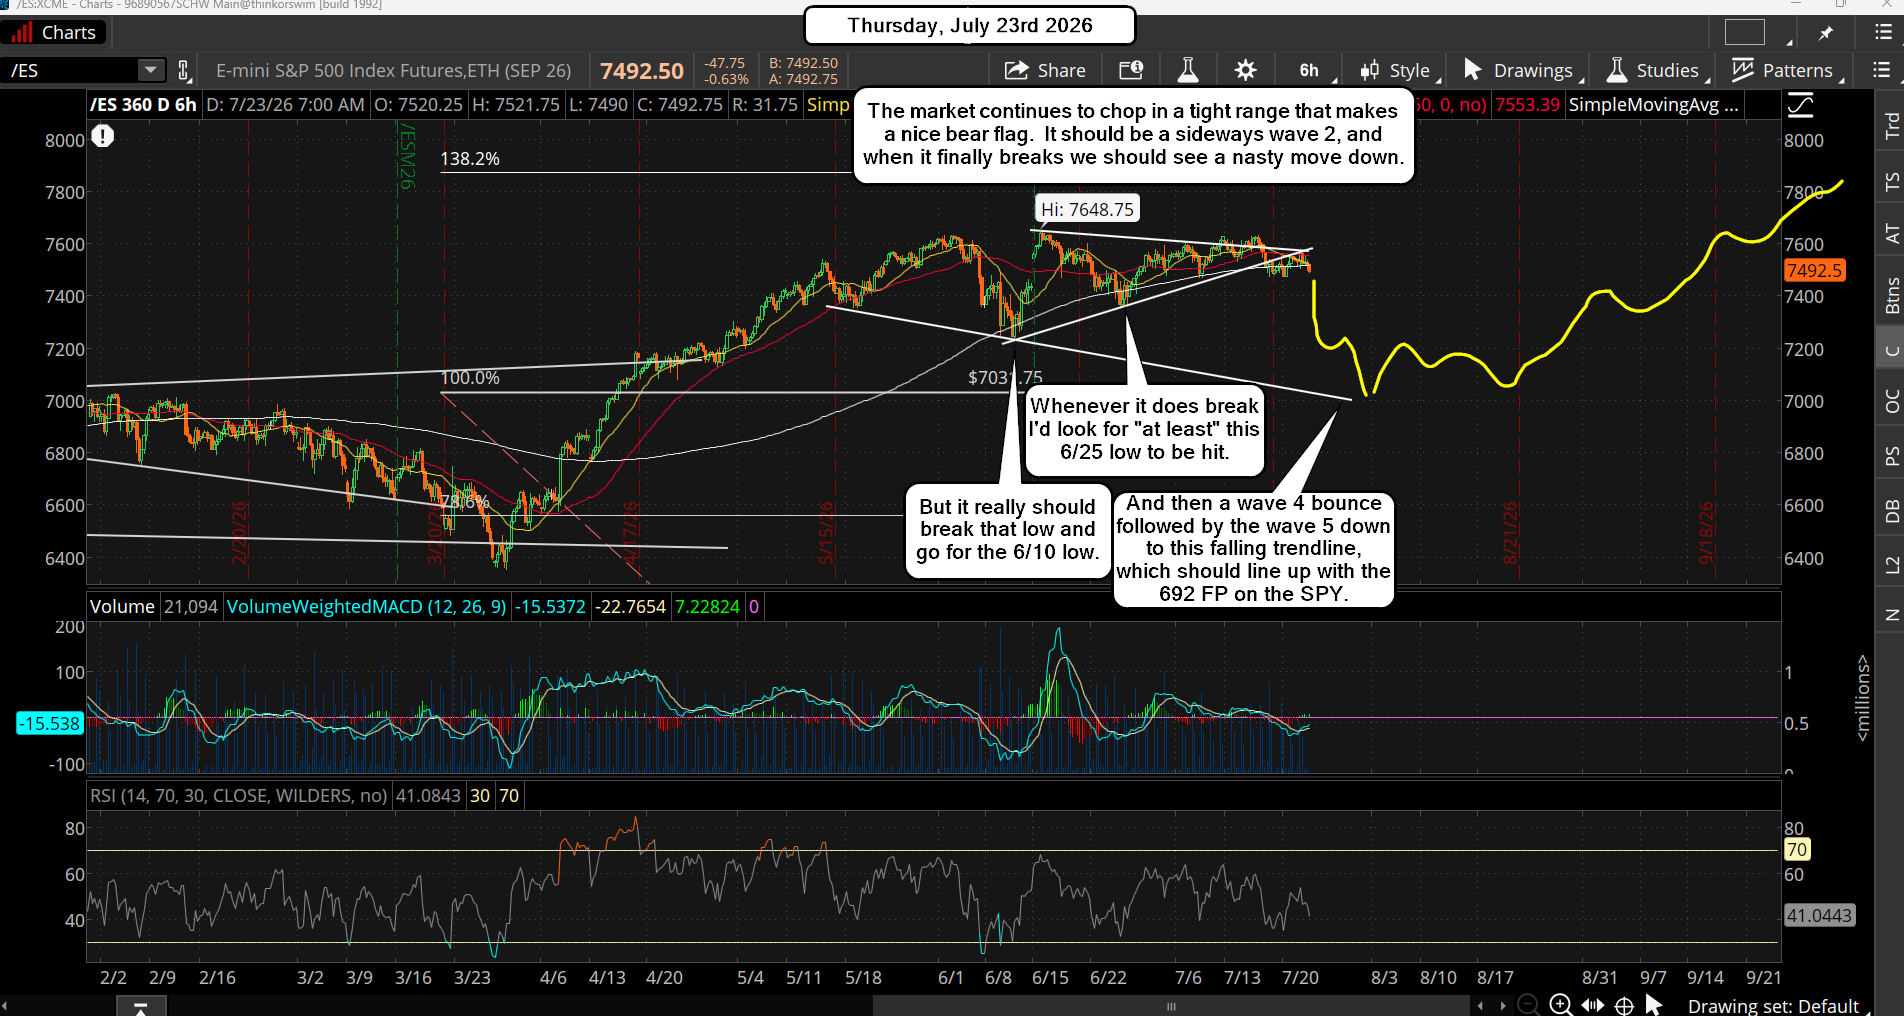
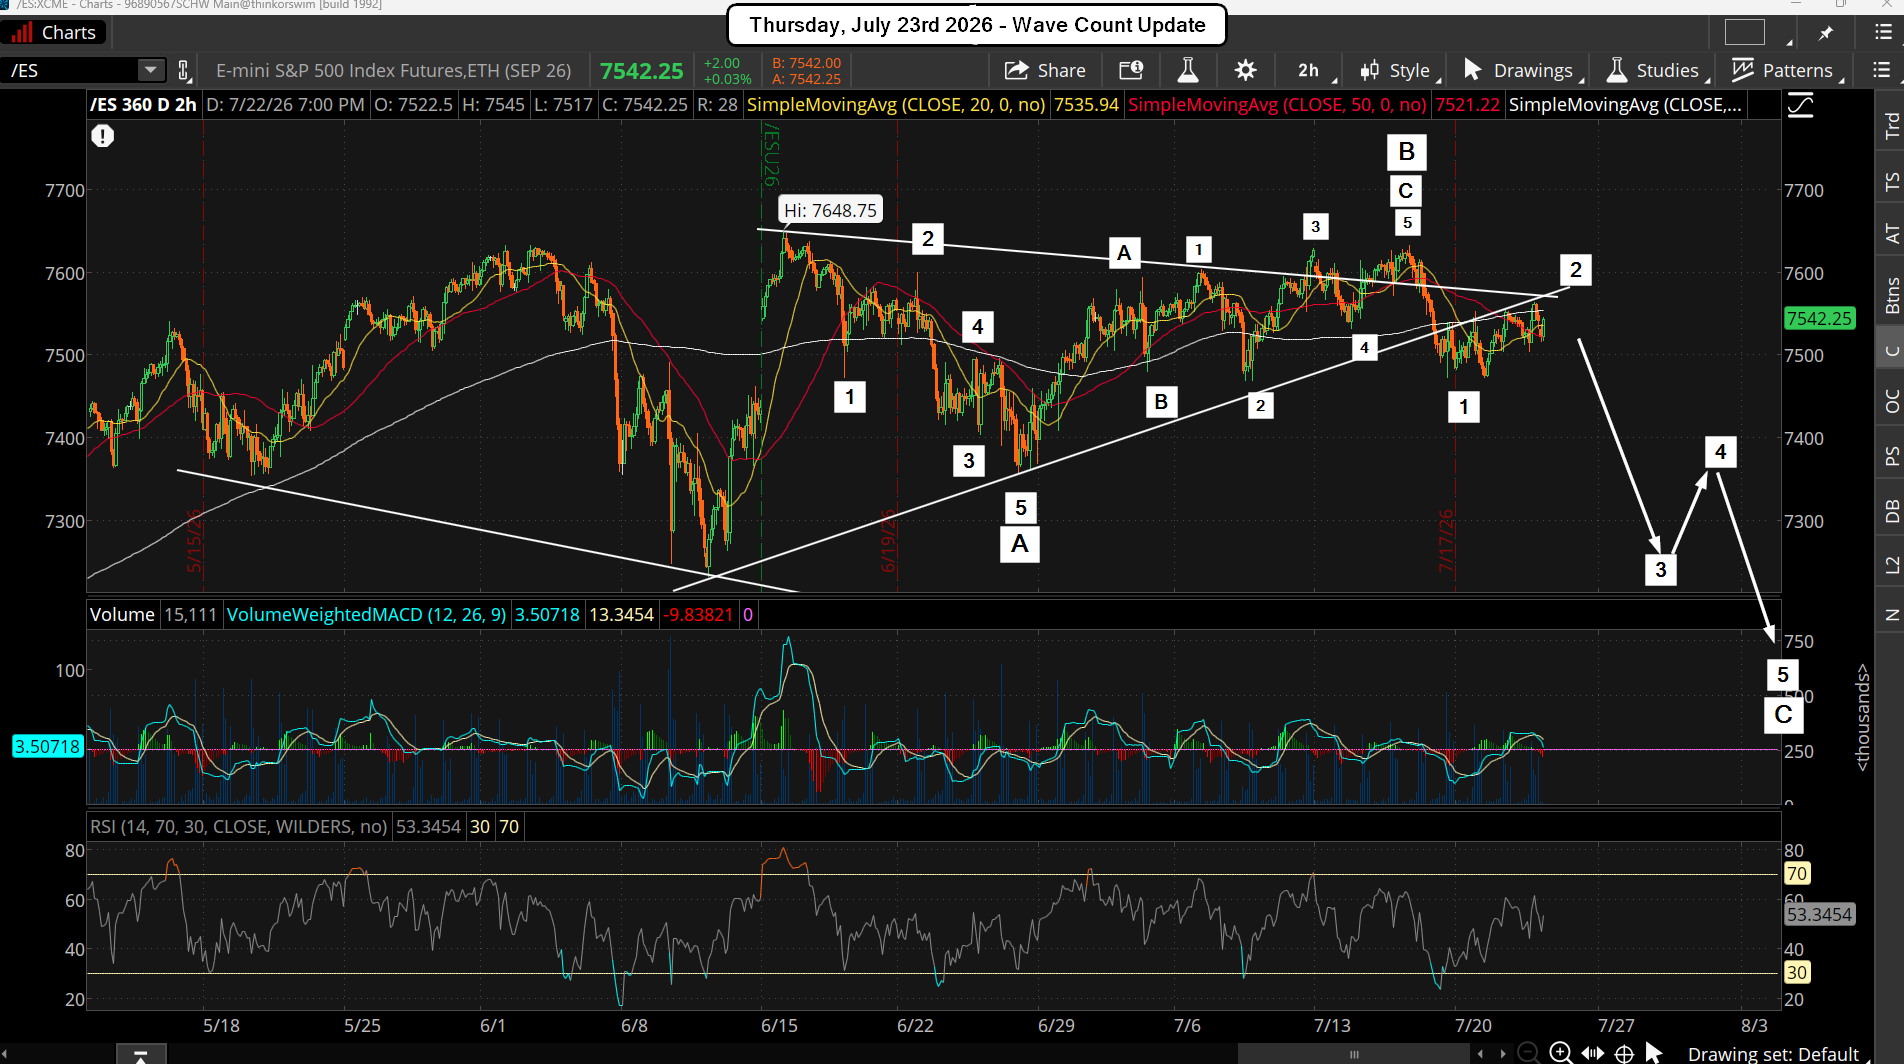
Not much to add that hasn't already been said. The only change is that the wave 1 down inside C didn't go down as far as I wanted. It only went to the 7/8 low, and not the 6/25 low or 6/10 low that I thought it would hit. It stopped way higher at the 7/8 low, and has been chopping in a wave 2 ever since. When this wave 2 finally ends a wave 3 down should follow, and it should reach the 6/25 low at minimum, probably the 6/10 low. The "when" part is unknown, but it should start soon and end probably into next week.

Then some kind of bounce for a wave 4, and a final wave 5 down to complete the wave C into the first week of August. We should still hit the 692 FP on the SPY and of course pierce it. But it's quite clear that the volume is so low right now that it will take a "trigger" event to cause the wave 3 down to start. What that is... I don't know? But of obvious that we are in a big bear flag and a breakdown is coming soon. I really don't have anything else to add, so I'll end it here with a short post.

Have a great weekend.


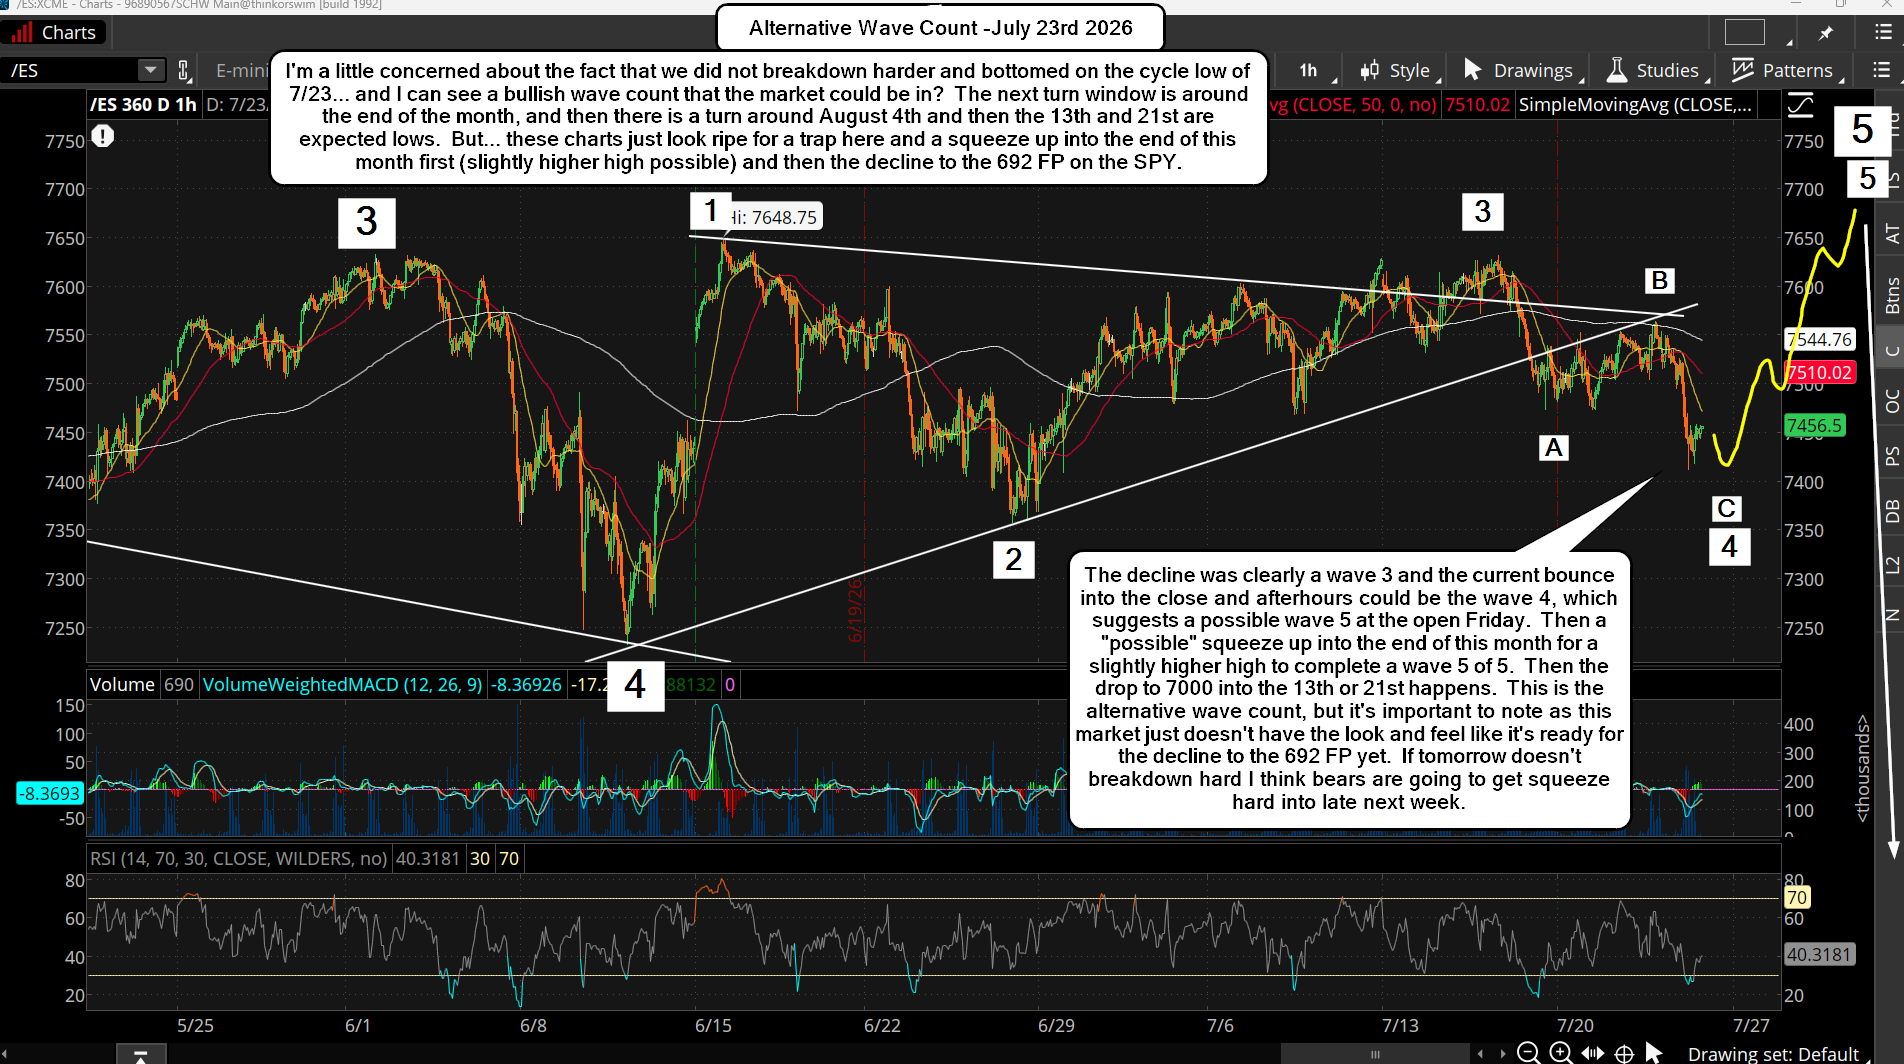
IMPORTANT UPDATE... Alternative Wave Count

ES Morning Update July 16th 2026

0

Delays, Delays, and More Delays...

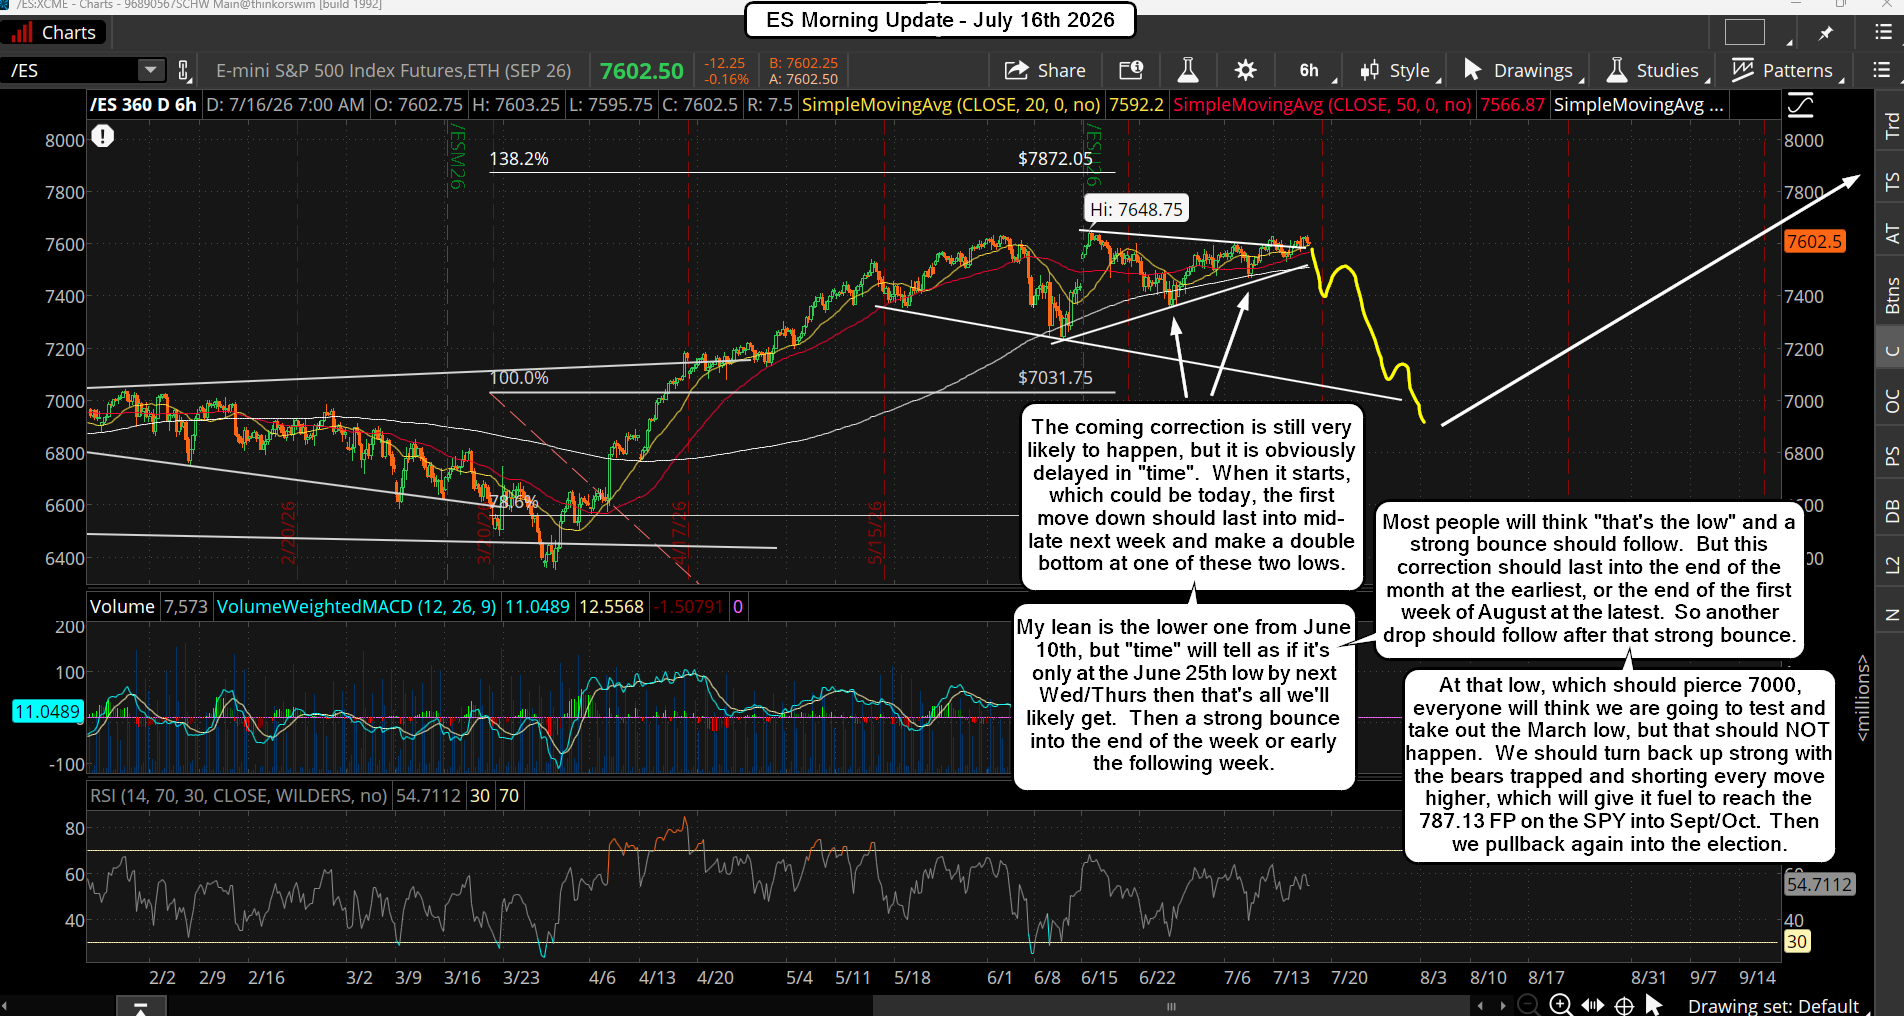
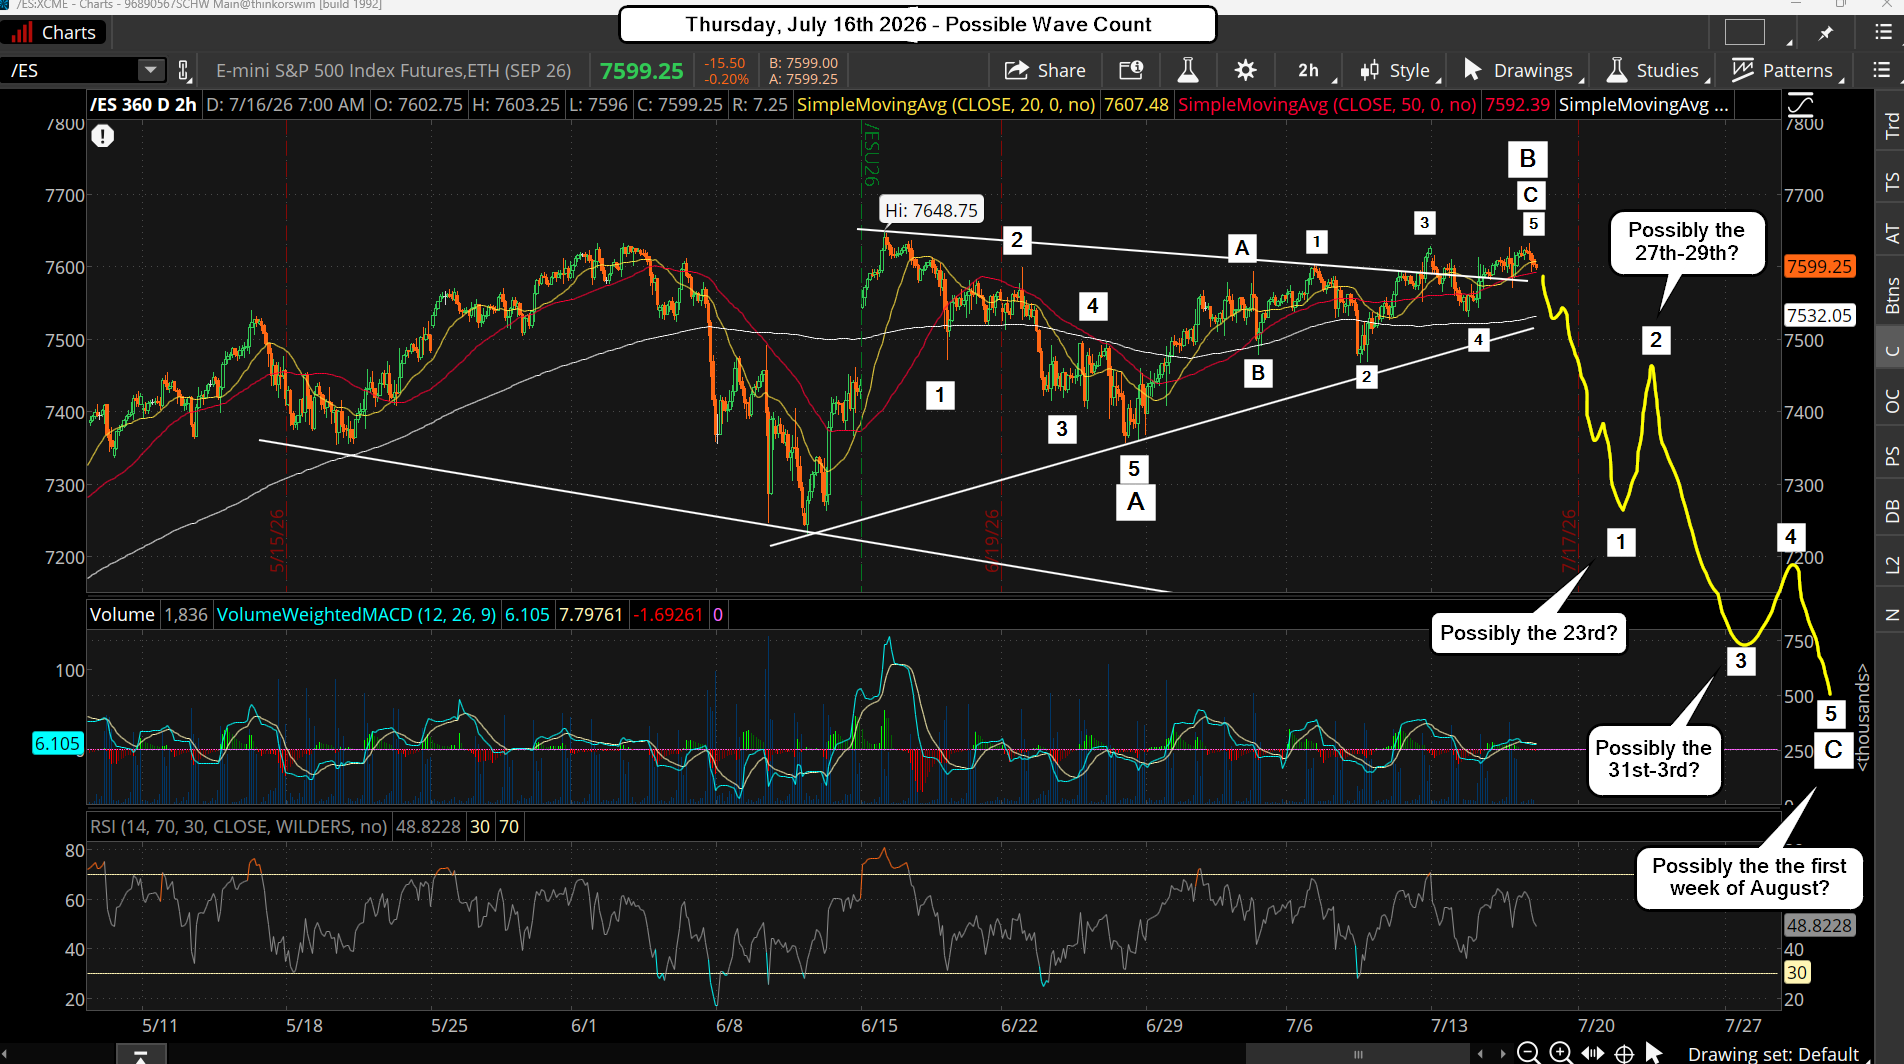
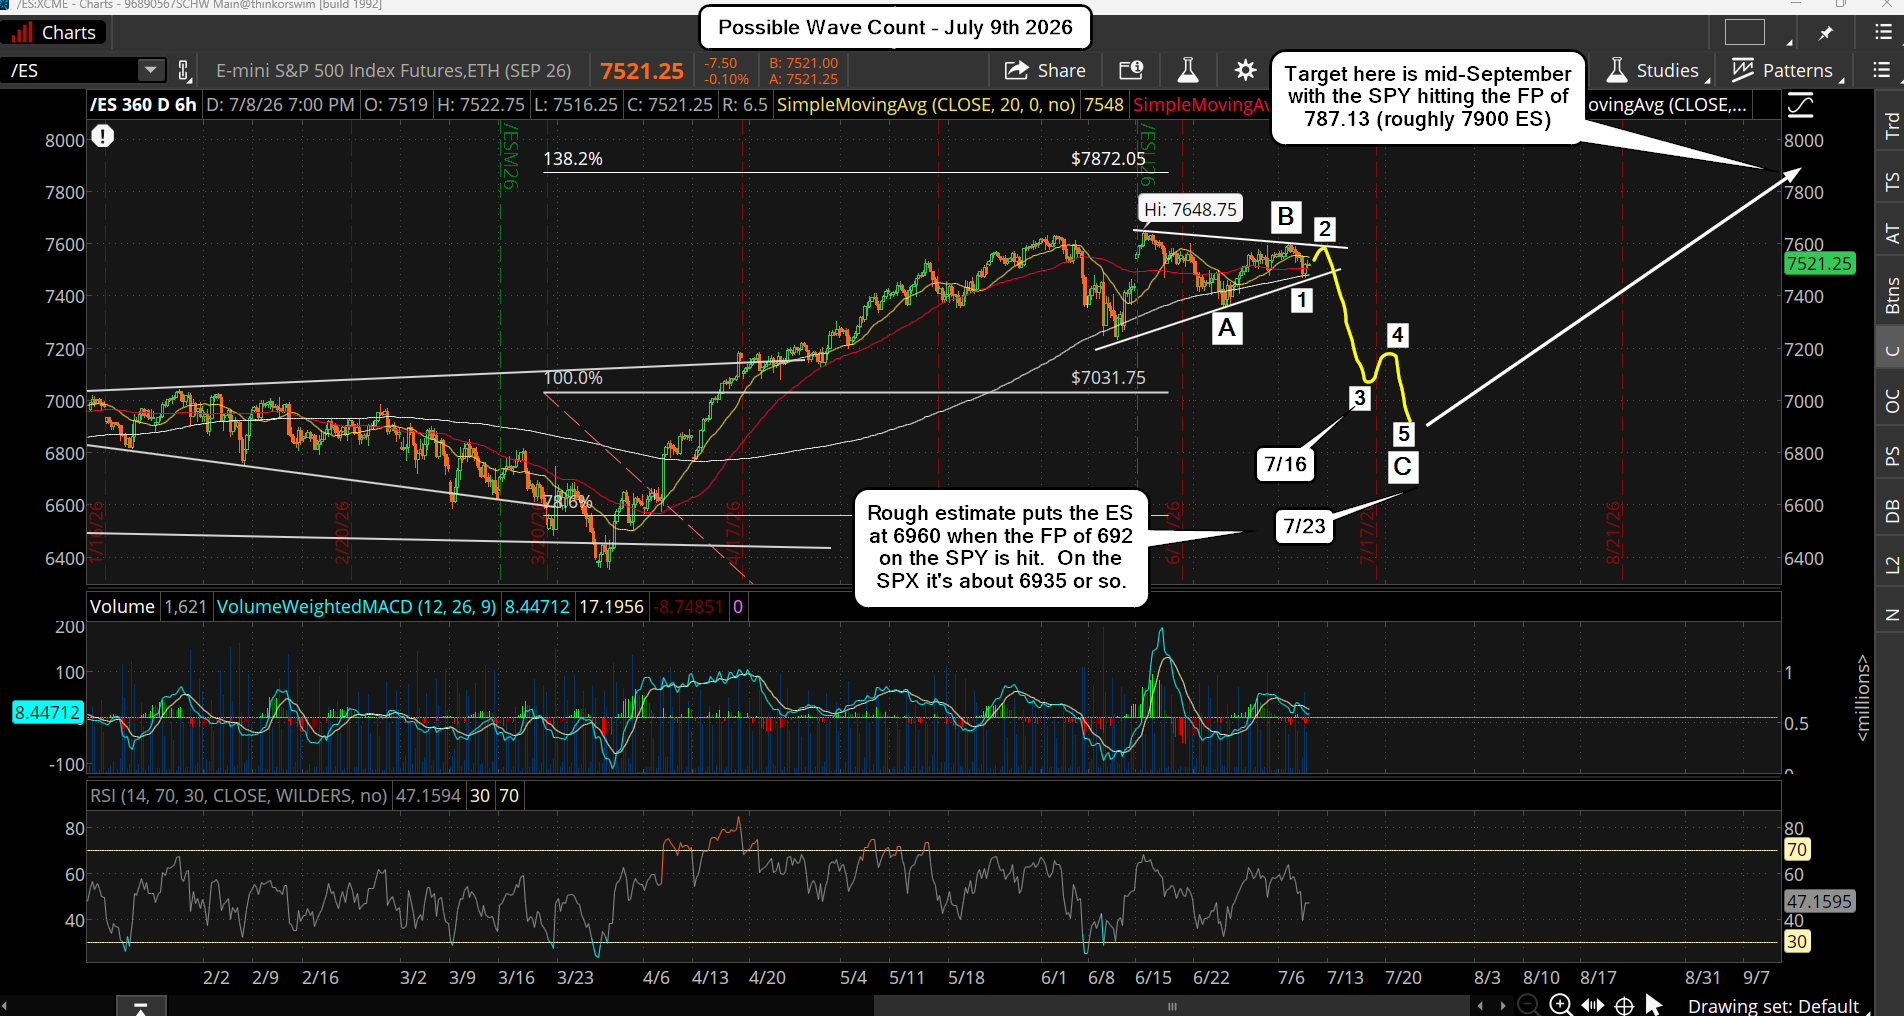
The market is still highly likely to decline this month, but it is taking the slow path to start. The target of 692 on the SPY is still likely to get hit, but it's extending in "time", where the 23rd should not be "the low" but just a low of some wave 1 (of C), which a bounce back up for a few days should follow. Then another drop into the first week of August (possibly just the end of July) will be the wave 3, 4 and 5 (inside C) that completes the correction and hits (and pierces) the FP on the SPY of 692. Below is the "best guess" on the wave pattern.

Now I've label "possible" dates where certain wave could end, but again, it's just a "best guess". This market it taking its' time in unfolding as it's still a very bullishly market and it does not want to just rollover and die. Do note that on the wave count chart above I have the wave 2 up inside C down as retracing about 50% of the wave 1 down. That's just speculation, but it's based on the fact that the market is so bullishly.

As for the target for the low of wave 1 down inside C, that could be more shallow and end around the double bottom at the end of wave 5 inside A, but I lean toward that support breaking and the support from the June 10th low being the real double bottom that we get the wave 2, of C bounce from. It's not going to be easy I think as if we see a low next Wednesday or Thursday, which is either at the June 10th double bottom, or the higher one from June 25th, the bounce back up for wave 2 inside C should be strong, and might be a 1-2 day move only?

Then the wave 3 inside C down will take everyone by surprise and once it hits the 692 FP (and pierces) the low will be in... but everyone will be calling for the March 30th low to be next, but it won't be hit. That's the "Bear Trap" as the next move up from the FP will just squeeze and squeeze and squeeze and won't stop until it hits the 787.13 upside FP on the SPY. It could also extend in time, whereas I thought it would do it by mid-September it could drag into early October.

Have a great weekend.

ES Morning Update July 9th 2026

0

Chop, chop and more chop...

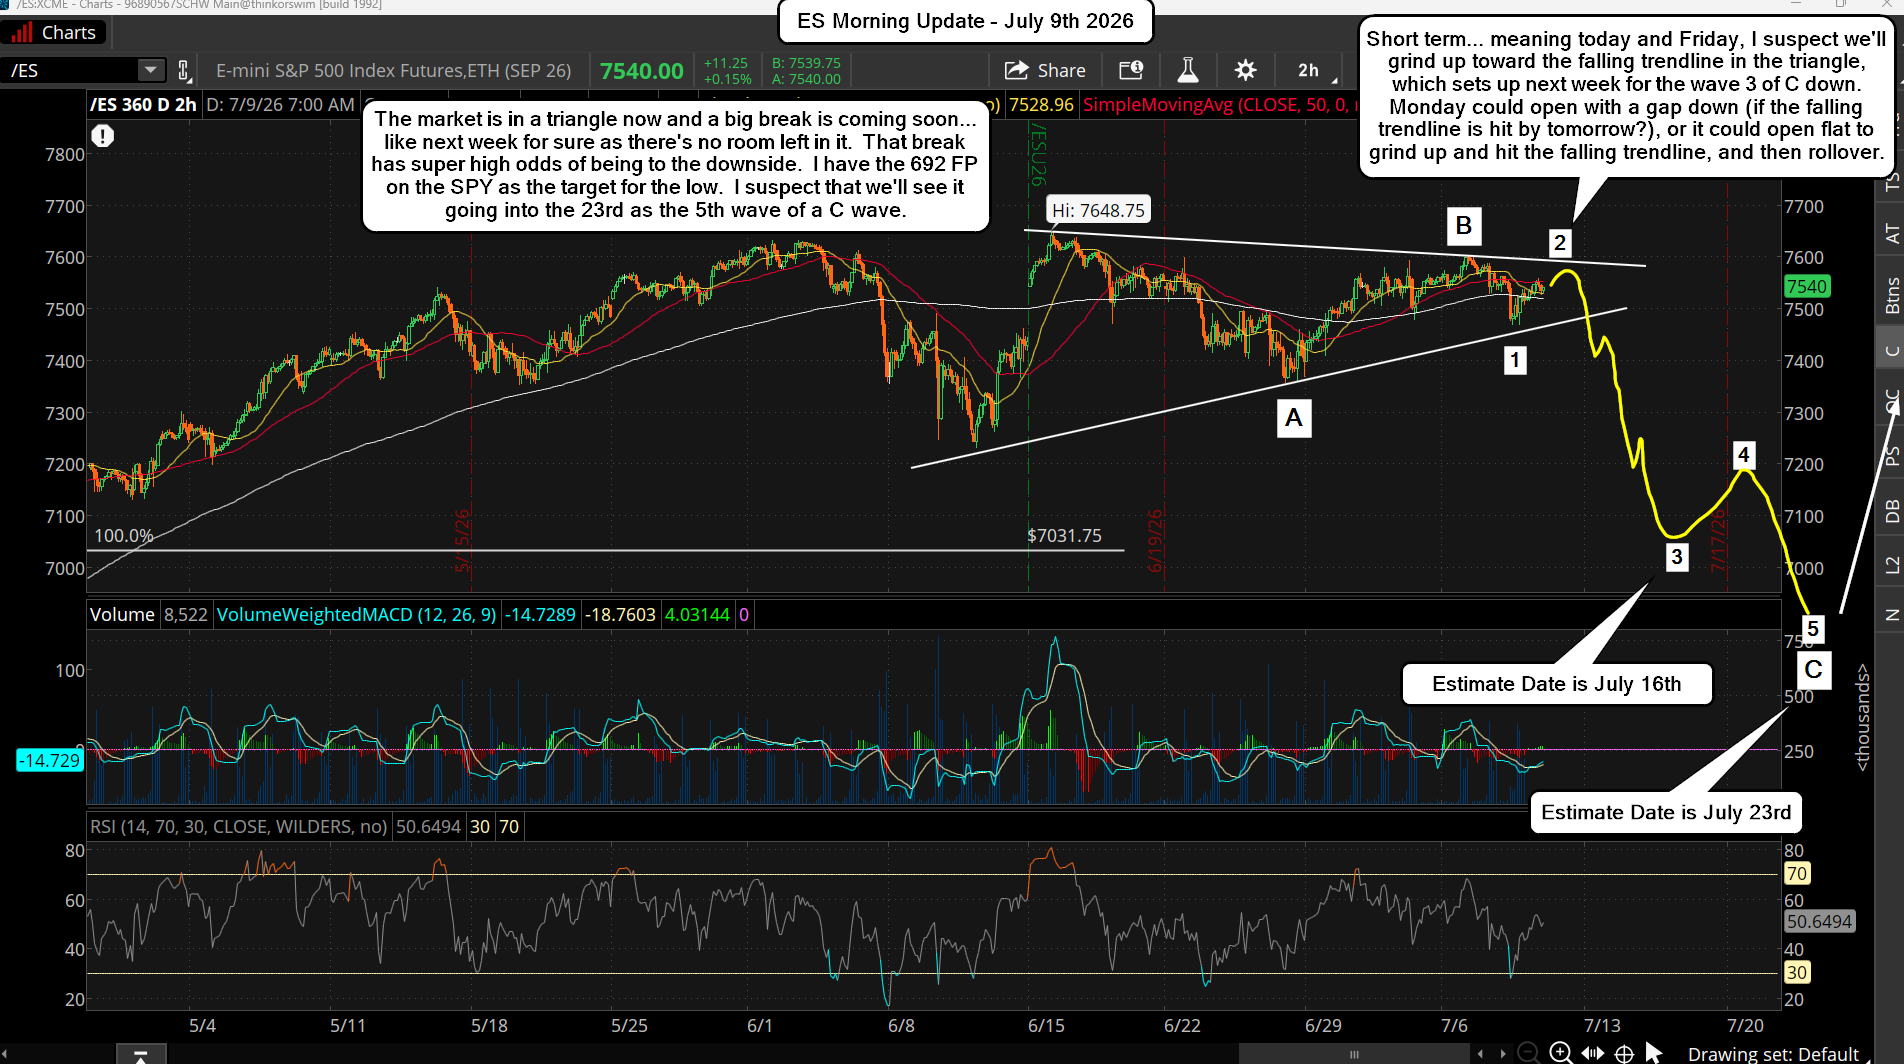
The market is frustrating both bulls looking for a breakout and bears looking for a breakdown. But a big move is coming soon, and there's very high odds it's to the downside. The ES hit a rising trendline yesterday morning in the futures and bounced off it into the open and then chopped around all day. This rising trendline has a falling trendline overhead, which together make a triangle pattern.

Once it breaks down the fall should be fast, and that breakdown should occur next week. Prior cycles show a bounce is possible from yesterday into Monday the 13th, but I doubt if it's a whole lot. Most likely it's just a move up to hit the lower falling trendline, which would be around 7590 if hit today, or slightly lower if hit Friday. I really don't think it will drag into Monday, but it's possible.

I suspect they will top it into Friday to lure in the last bull looking for a breakout, and shake out the last bear looking for a breakdown. That way they can use the weekend to release some kind of negative news so that Monday opens with a gap down. The bears will have missed it, and the bulls will be trapped long.

The drop should be scary as we should hit the 7000's by Thursday the 16th, where we could see the 692 FP on the SPY hit? Or that target is saved for the 23rd where the last low should be at, with a bounce after the 16th for a few days, followed by a capitulation flush out into the 23rd to hit the FP. It could hit the FP on the 16th though... that's certainly possible.

If so, the 23rd will be a higher low, but either way the move that will come out of the low on the 23rd will be a major one as it should rally into mid-September where the 787.13 FP on the SPY should be the target high. The coming down move next week is going to fool a lot of people, but I'm positioned and ready for it.

Have a great weekend.

ES Morning Update July 2nd 2026

0

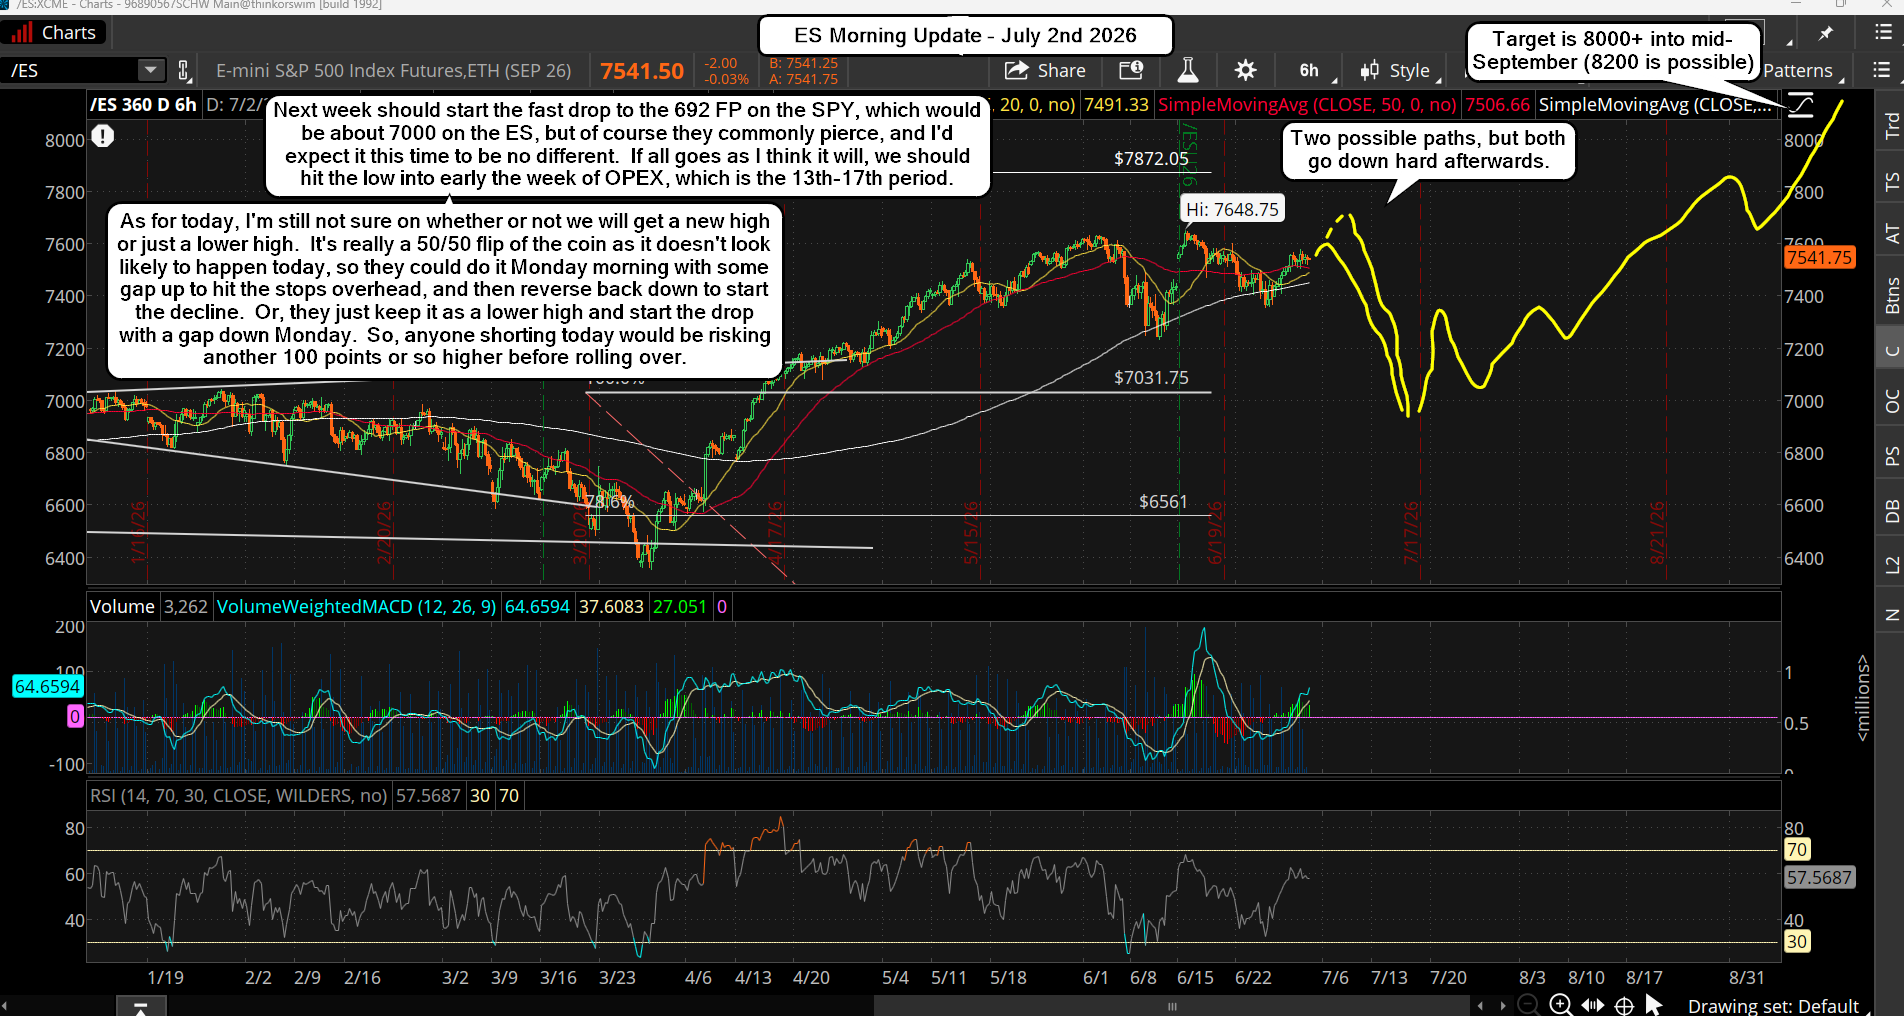
Whatever high we get today is likely "the high" before the big decline starts that last to 2+ weeks and targets a pierce of the 692 FP on the SPY.  If we don't see a new all time high then the wave count will change from what I posted last week, but the result is still the same... a nasty big and quick drop. If no new high the the entire rally up from the June 26th low is just a B wave, and the C wave down is coming next week. I'm keeping this update short as it pretty similar to last weeks update... with the wave count just being adjusted. Timing wise everything is the same... the market should top this week (today) and start down hard next week.

However, there is a risk of a sneaky move where they keep it as a lower high today and gap up on Monday to run the stops overhead.  But even it they do it's NOT a breakout.  It will reverse back down and decline hard.  It's not possible to know the plan here on whether or not that stop run happens or not.  My lean is that they just rollover Monday and start the big decline, but my lean is nothing more then a hunch... and I could be wrong.  Either way though there is a nasty drop coming into mid-late July.  I think it is over with going into the week of OPEX, but late July could see a retest of the low, which should be a higher low.

Have a great weekend.

ES Morning Update June 25th 2026

0

Is The Bottom In?

I think it is...

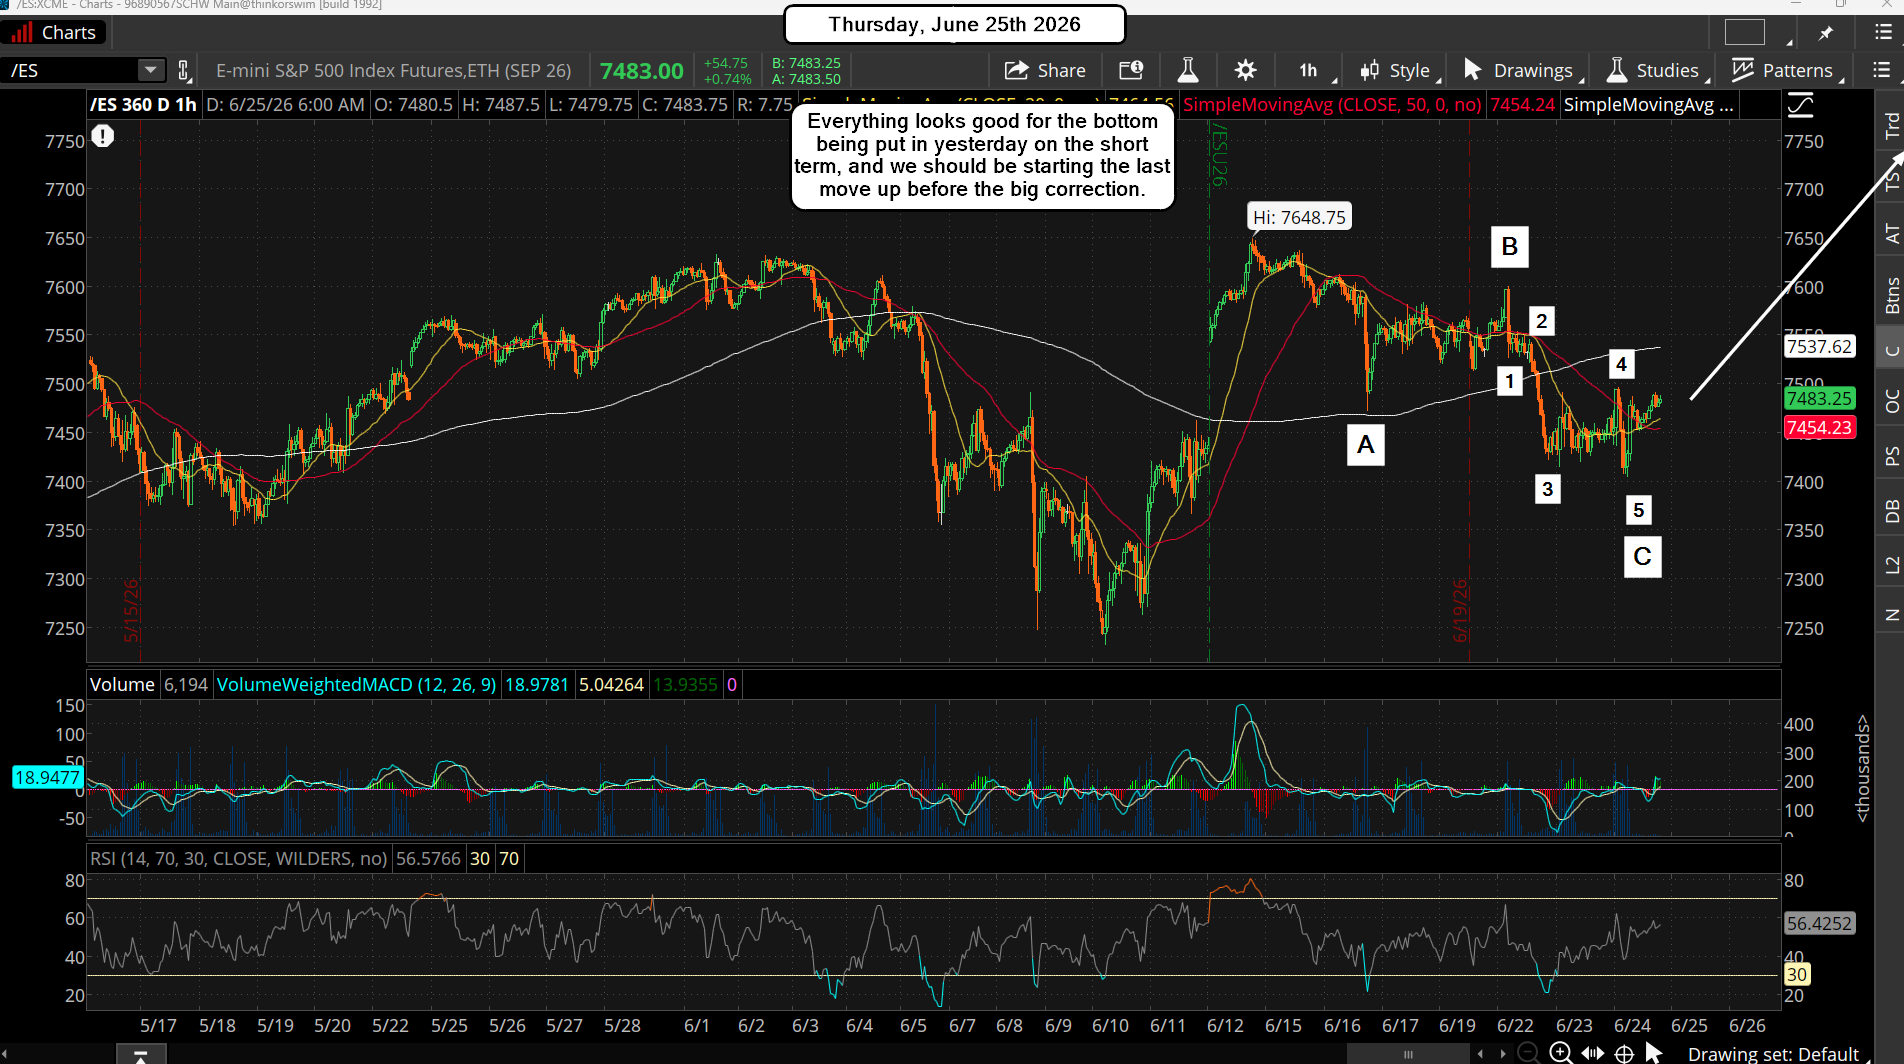
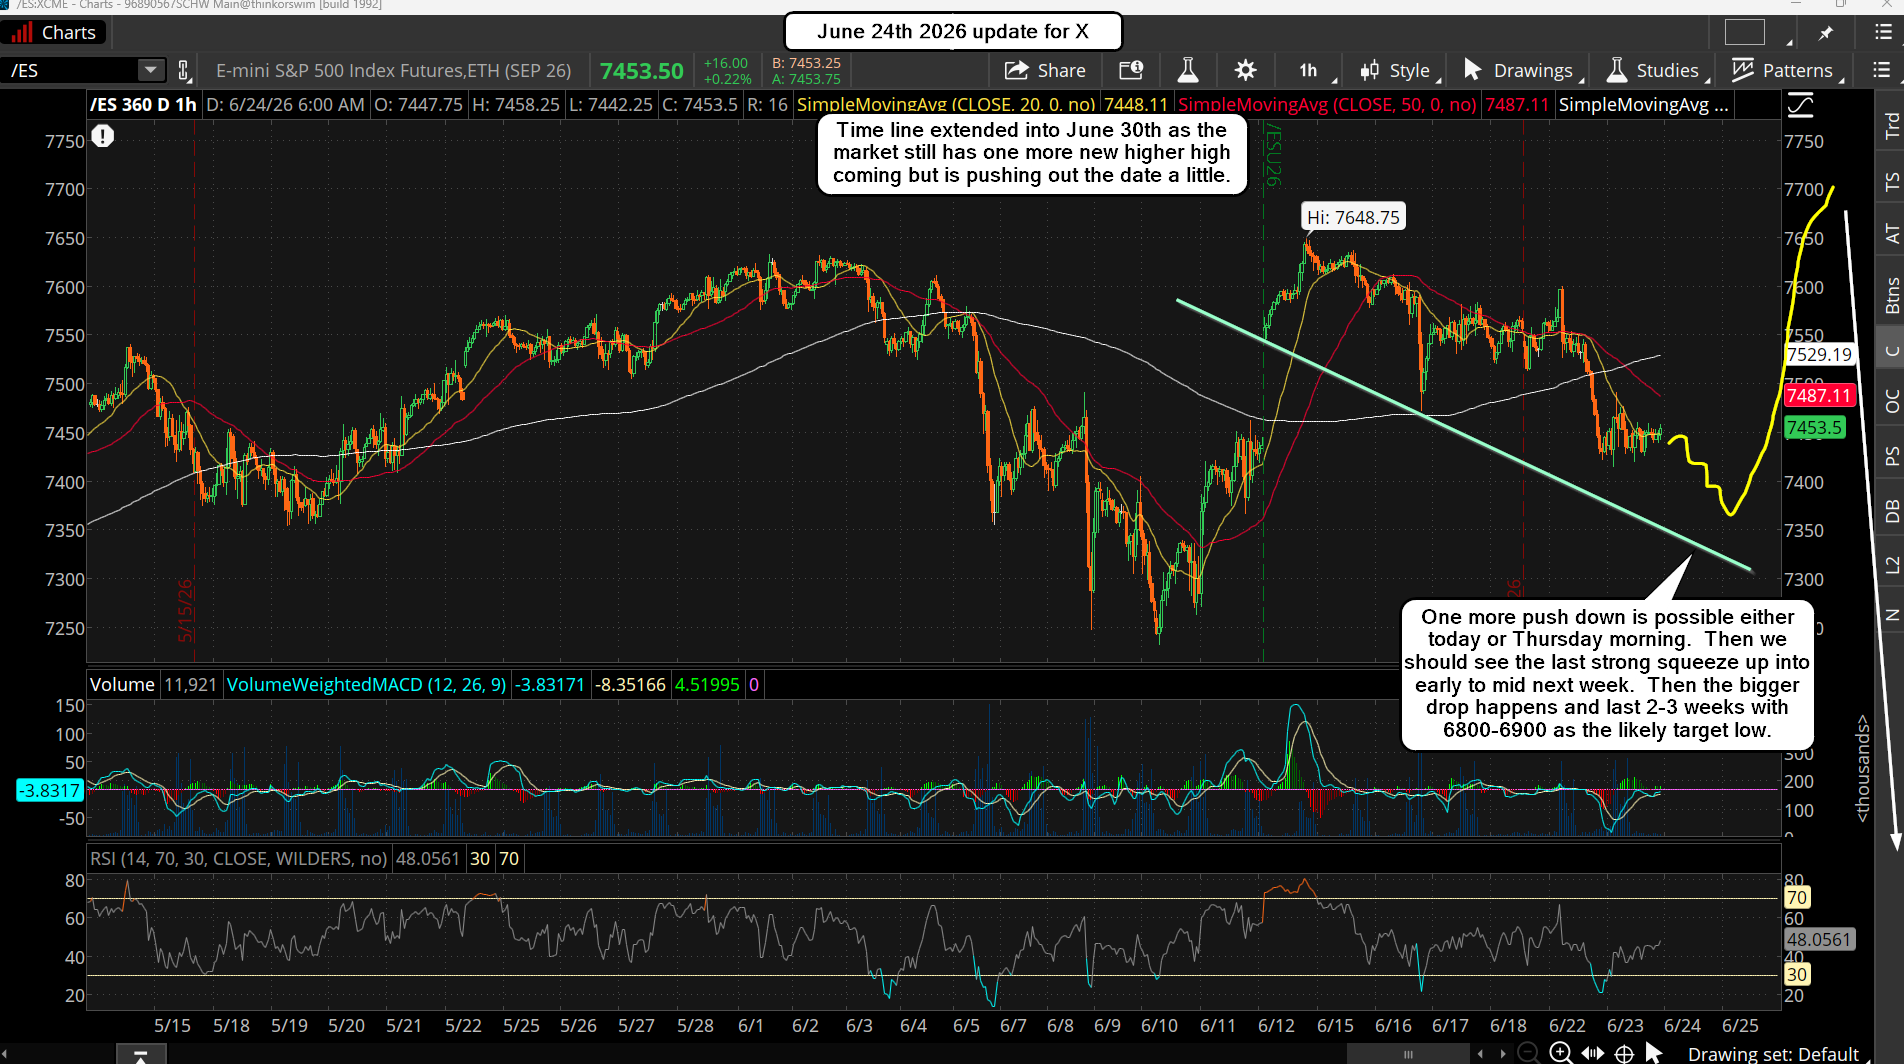
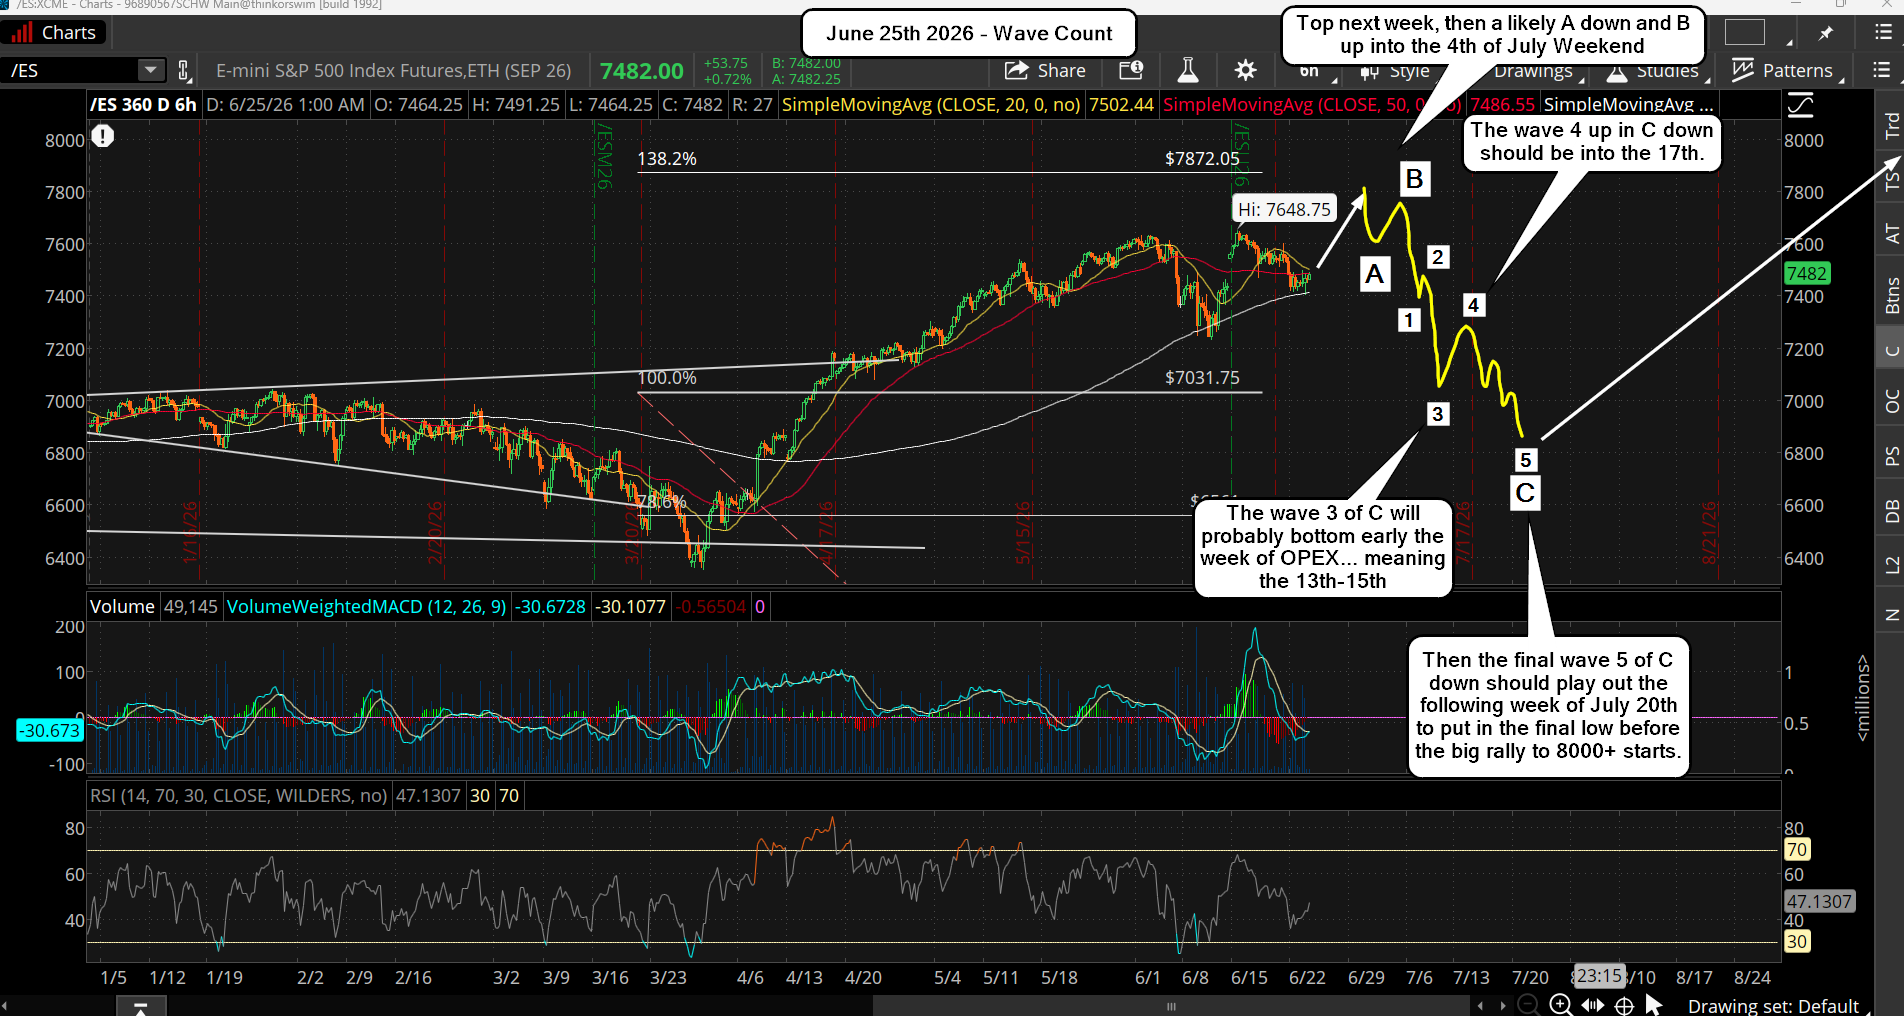
The time line has extended but the overall plan hasn't. The market is still likely to have one more new high, but not likely this week. It should happen next week, like around the end of the month or the first day or so of July. We are not likely in the big drop right now, even though the last few days have been quite bearish. There's one more move up still highly likely to play out, and it should take out the current all time highs to hit the stops on the shorts. I posted the chart below on X yesterday and it's still valid.

Considering how big of an event the coming 4th of July is for America I don't think we will be tanking hard into it. After the new high next week, which could come on June 30th, July 1st or even July 2nd, the market should start the big correction everyone has been waiting on, but the bulk of the big drop won't likely happen until after the July 4th holiday.

Meaning the week of July 6th should be an ugly one I think, and this drop can last into mid-late July before the 6800-6900 bottom is reached. Since the week of the 13th is OPEX for July I suspect that will be the bounce area for some wave 4 up in a C wave down, and then the following week of the 20th is where the wave 5 down of C finishes the entire ABC correction. It's hard to nail down the exact date or price but that's a rough idea.

And I do think the 692 FP on the SPY will be hit and pierced, so we have that as our target... but it could just be the bottom of the wave 3 of C, and the wave 5 of C could be a retest that goes a little lower? Or it's the bottom of 5 of C and we stop in the 7000's somewhere for the 3 of C to do the bounce for 4 of C. My point here is that if you are planning on holding short until the FP is hit you might not see it until the week after OPEX and there could be a nasty bounce during OPEX to shake you out.

For the short term though, I think we bottomed yesterday and will start the last move up today, which will carry into next week. Again, we should easily take out 7700 ES and possibly reach 7800? I don't know the price high but if they want to make the market look great for the 4th of July it would need to get up high enough that everyone will start calling for 8000 and give up the bear case. I think 7800 would do it, as bears would throw in the towel at that point and go long at the top. We should NOT see 8000 until after the correction to the 6800-6900 area, whereas that's the starting point for the big squeeze into mid-September where 8200 is possible.

Have a great weekend.

ES Morning Update June 18th 2026

0

So far, so good...

The market had a top on the June 5th, pulled back for the first drop, and then rallied up into the next turn window on the 15th, where it pulled back again. I've been saying for a month or more those dates and while I leaned toward the 5th being the start of the drop the 6800-6900 zone I adjusted it and pushed it out into the 15th. Now I'm pushing it out one more time to the 24th-26th window, and that top should be the highest high (7700+ ES) before a large 2-3 week drop to the 6800-6900 area.

However, even though the 24th-26th is the window I actually lean toward the 23rd as reaching 7700+ is only about a 150 more points higher and the market can do it in a day if it wants too. So I just don't think it will drag out too much longer, and with the peace deal getting signed tomorrow I think that event will be used to get that last squeeze higher next Monday and Tuesday. We all know how the news is used to cause surprise drops or gap ups, and yesterday we had a surprise drop to fill the gap on the ES (almost) after the FOMC... which is usually a bullish event. Now those bears are going to get squeezed out into early next week I think. Here's a chart I posted on X yesterday...

Nothing has really changed from it, but I'll add in the most likely wave counts in the chart below. Elliottwave is always a backwards looking system as while you can try to predict the future with it you commonly get it wrong and have to adjusted. However, if you use cycle work too, and make your waves line up with the cycles then you have a much higher odds of getting the bigger waves correct. But the smaller ones are tough as the market tends to subdivide and subdivide.

The really big picture waves are hard too when are talking about going back to 1929 or something, which I do think we have another one of those tops and crashes coming, but I don't see it until 2028 at least. Anyway, I'm not going to try to forecast those waves as it's too hard. I'm just going to stick with Large, Medium, Small, and Tiny waves as this is about making money, and not trying to predict the next 1929 depression.

So don't get too hung up on the wave count as it's not important to be 100% right. The most important thing is to get the big moves timed correctly so that one can profit from the move. The coming top next week will likely end what I'm labeling as Small Wave 5 inside Medium Wave 1, inside Large Wave 3, inside Extra Large Wave 3, inside Extra Extra Large Wave 3. Below is the big picture wave count...

As you can see in the chart above I'm projecting that L3 will top out this September sometime, and it should be above 8000. Then L4 will be a choppy pullback into the November election, and L5 will go up into early 2027. That's where the craziness starts XL3 ends the XL4 and XL5 will be full of wild swings up and down all of 2027 most likely, just to complete XXL3.

Once its' done XXL4 and XXL5 will be even wilder as we go into some massive blow off top in late 2028 I suspect. That's one time period where we could see a 1929 style crash, but lets not worry about it right now as that doesn't make us any money and only causes worry. It could be delayed and push out into 2032 as well. Now, for the shorter term we have the chart below...

For it I think we are in T5 up with yesterdays pullback after the FOMC being T4 down, which should end next week, and it will complete S5 inside M1. That's where we should see a 2-3 week drop for M2 into early to mid-July. It could extend into late July but currently that's not looking likely. The top should be next week, and the drop should last 8-10 trading days. That puts the time line out into mid-July at the latest I think. It could change but that's what I'm forecasting right now.

Have a great weekend.

ES Morning Update June 10th 2026

0

The market tanked yesterday, but it failed to hit the 692 FP and (and the 7063 ES FP)... and it failed to hit the short term upside FP at 749.70 on the SPY from last week. They never make it easy when it comes to the hitting of the FP's, as I've seen this pattern before where a fake print is put out weeks or months in advance, and when the market starts to get close to hitting it, it stops shy and reverses the other way for awhile. Then later comes back and hits the FP to fulfill it. What does that mean you ask? It tells me the short term low is in (an A wave) and we are going to rally into mid next week (the FOMC on the 17th) where we should easily hit the 749.70 upside FP on the SPY that I posted a chart of on X a couple of days ago. Below is that chart...

However, today... before the open, we have the CPI number coming out. Now it could be used to cause another drop in the market to retest the lows (and possibly flush hard to the 692 FP), but I think it's going to be used to squeeze the bears really hard. It's a wildcard, but it's possible that between the CPI starting the squeeze, and the IPO of SpaceX this Friday, we could see the 787.13 FP on the SPY hit into next week. Yeah, that's a crazy call, and I agree. But if you want to destroy the bears that's the move I'd do. More likely though is that we only go up to make a lower high, or slightly higher (to hit stops on bears that short the double top), like to 7700+ into next Wednesday.

I really don't have a lean here on whether or not we make a lower high, blow off high to 787.13, or slightly higher high... but I do have a strong lean that the next best shorting spot will be on the 17th, which just happens to be the FOMC day as well... but that's not my reason for predicting that day. It's more about the cycles and while the window is the 5th to 15th we've already did the first drop early by topping around the 2nd/3rd, so I'm targeting a late top for the next high. I wasn't really thinking about the market having two large drops, but it's now pretty clear that we'll see another one before the bearish window of time expires (it goes until mid-July). Here's a chart of the path I think is coming...

Now again, I don't know about how high the coming move up into the 17th will be, as it could be a new high for a wave 5 that I've been looking to play out for awhile now. Or it's a lower high, which would be a B wave in a wave 4 down. Then the C wave would follow afterwards and bottom most likely by the end of this month. Then some up's and down's for the first half of July before the really strong rally up starts, which could then reach 8000 or more in the months that follow. Bottom line here is that while this recent drop went deeper then I expected (meaning I missed shorting it) there's still another great opportunity to short next week.

Thursday Update

The additional decline yesterday, after I wrote Wednesdays update, opens the doors for the 15th-17th turn window to be skipped and the next turn window of the 24th-26th to be the top. I was hoping that we'd start back up yesterday and squeeze into the FOMC next Wednesday the 17th, where a double top should happen. I still lean toward a retest of the current all time high before the next big leg down, and it really should make a slightly higher high.

This made me believe that the 24th-26th would be a low (ideally the 26th, which is my lean), but that seems less likely now. Instead, we'll probably get a 50% rally into the 15th-17th window (wave 1 in the final 5th wave up?), then another pullback of some degree, but not huge... like wave 2 that traps shorts. Then a wave 3 up, 4 and 5 to finish the 5th wave into the 24th-26th where a slightly higher high happens. Once that occurs the bears will give up on any further drops and will be calling for 8000 or so.

But... the bearish period last into mid-July (and could extend into late July), so there's high odds of another drop that reaches (and pierces the 692 FP on the SPY. The 6800's on the SPX should be entered before the real low is in... and then we rally to 8000+ into September as all the bears are fully short again calling for the March 30th low to get hit next. But it should NOT happen, as the FP should be the low. Of course it can get pierced by 25+50 SPX points, which is why I think we'll enter the high 6800's at the final low, but that should end everything for the bears and be a HUGE buying opportunity.

So... my thought here haven't changed, but the timeline has be extended. I still lean strongly toward a retest of the current all time high before the next big drop. I said previously that I thought it would happen on the 17th, but looking at how weak the market was yesterday I don't think that will happen now. I think the market will need more time to shake out the bears and lure in the bulls, so that's why I'm thinking the 24th-26th window will be where we see the new high.

Have an blessed day.

ES Morning Update June 4th 2026

0

We finally got the pullback that I've been looking to happen, and it's roughly a hundred points as I suspected. It should be ending soon (today?) and the move back up should follow, which I'm still not sure about seeing the 787.13 FP on the SPY into June 15th or so as that seems just too high. But it's there, and so far the market has been hitting the fake prints, so maybe we do see it get hit... who's knows for sure?

I just think it's asking a lot to get through this 7600 zone of mega resistance by that much. Sure, we can get a fast squeeze to 7700+, which I think we'll see, but 7900 is really pushing it, and I just can't see how it can do it in such a short amount of time left. Anyway, there's some new FP's out now, and they are downside one's. Here they are below...

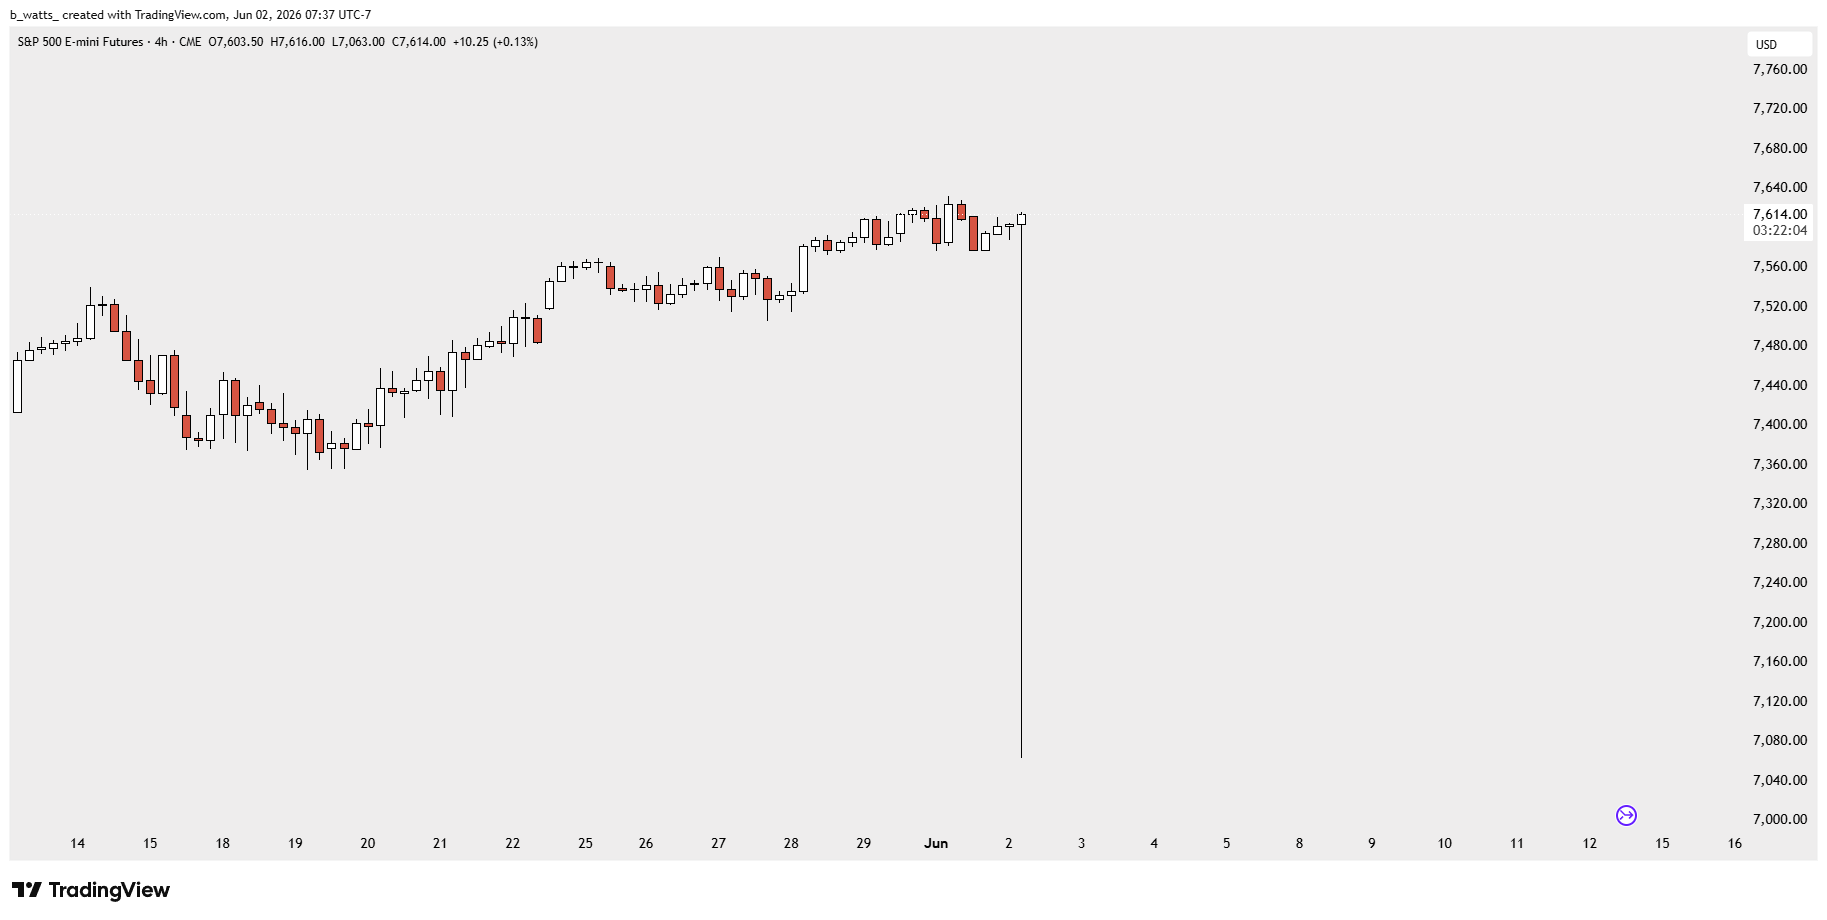
The 692 FP on the SPY would be roughly 6940 SPX and a little higher on the ES, whereas the 7063 FP on the ES is simply the level it is. Keep in mind that by the time the low comes in (mid-July?) the ES will be on the new September contract, so 7063 on it could be 7000-7020 on the SPX, and that's close to the 6940 estimate from the 692 FP on the SPY. As you can see this is all lining up for a nasty drop into mid-July and these new FP's are the likely target. As for the 600.14 FP on the SPY, I don't see it happening anytime soon.

I'm just putting it on the back burner and will revisit it once we get to a period where I think it's possible to get hit. For now I think we'll see the new FP's hit into mid-July and then rip higher again into September where a retest of the all time high is possible, and likely. Maybe they save the 787.13 FP on the SPY for that period? From there another pullback, but not like the coming one, and then a year end rally. I'm thinking that the coming drop into mid-July will be the low for the rest of the year and we'll go up hard afterwards.

Have a great weekend.

ES Morning Update May 28th 2026

10

Two Possible Moves Coming...

But both end with the same result... a BIG DROP!

Yesterday, in the chatroom I wrote the following...

Short term... I still think we pullback tomorrow and/or Friday, but it's probably a higher low then the recent one last week. That pullback probably finished S4 in a one wave move instead of an ABC like I had hoped. So we are likely in S5 up now, and if we don't make a higher high today we should have ended T1 up with the current high yesterday. That suggests we are in T2 down right now, which should subdivide into an ABC before finishing. Yesterdays' early pullback was the A wave, and we are in the B wave up before the open today. The C wave should happen tomorrow, and that would finish T2 down. After that we should see T3 up, T4, and T5 play out all of next week to complete S5.
7:18 AM

Now... with the new upside FP being put out I have to think that will be the rally up later this year, after the coming nasty correction in June/July. It suggests to me that we will ONLY hit the 759.35 FP on the SPY late next week (or the following week?), and then we do the big drop... which could reach the 600.14 FP? It's hard to say how deep it's going as that FP could also be saved for AFTER the new FP of 787.13? But... it's looking likely that whatever decline we get in June/July will be followed by another massive rally up in front of the midterm elections and Reza's new FP could be the target.
7:23 AM

So, what is this new FP of 787.13 you ask? Here it is below...

I think everyone knows how powerful Trumps posts or comments are when it comes to moving the stock market. While no one has the power to stop the bigger cycles from playing out the size of the decline can be reduced in a cycle, and the rallies can be extended.

Now I don't know how deep this coming decline will be, but we do have the FP on the SPY of 600.14 put out, so if we get a decline that deep everyone will be so bearish that no one will believe that we can go back up to a new all time high into the midterm elections... but the new 787.13 FP on the SPY suggests that will happen.

The problem with all FP's is that we never know the "when" part on hitting them. We have to use the cycles for that, and they don't say the depth or height... only the window where a turn down should happen, or a turn up. The majority of the cycles point to the window of June 1st-10th as still the likely period where this market will top out and turn down hard.

But it's not an exact science of course, and there's some cycles that point to the 5th-15th (more on that later). However, we have the 759.35 FP on the SPY that has a very high odds of hitting into this cycle top, so we have to give it time to play out. Once we hit the FP next week, or even into the following week, we know the top is in... but it still shouldn't fall off a cliff until we get into late June or July where the expected low for the entire correction should happen (the middle of July roughly).

For the near term there are two possible paths...

First one, which is the one I lean toward, I still think we pullback into the end of this week, but nothing big. The pullback would a higher low then last weeks low, which would be a Tiny Wave 2 (as I've previously said). Then up into late next week to finish it all off and hit the FP of 759.35 on the SPY into or around the June 5th date.  Below is that chart and wave count...

Or, second... the pullback is a deeper one that last into early next week and goes into the mid-7250's where support is at, and that completes Small Wave 4, which I'm not leaning toward happening, but would LOVE to see it. It would be the surprise move of course as most people are looking for more upside now, and if you take out the 5/19 low everyone will think the top is in and will short the market hard.

But... that should not be the case as the 759.35 FP on the SPY has not been hit yet, and the "time window" for the top (June 1st-10th) isn't hit yet. In fact, I'd then lean toward the 10th-15th for the top to happen as a move that deep would need more time to recover and there are some cycles that point to the 5th-15th as the window where the top should be.

And, we'd have a triple negative divergence on the daily chart from the MACD's and RSI if that were to happen, which doesn't have to of course, but it would be a more powerful setup for the coming big drop. Here's the wave count below...

Yes, we could top early from the cycle (meaning we've already topped) but since I have the FP on the SPY still not hit yet I have to think the odds are stronger that it will be hit and that the cycle window of either the 1st-10th (the small pullback scenario) or the extended 5th-15th window will be when it happens. I do not know which scenario will play out... but again, if it's a small pullback for a higher low then odds favor around the 5th or so. If it's a deeper pullback then time will get pushed out into the 10th-15th most likely.

Meaning, this coming top can drag out in "time" and frustrate bulls and bears both before it finally ends and rolls over. We just need to be patience and focus on the FP as it should be hit within the next week or two, and of course it will be pierced through. That's when I'll look to short it, and give myself enough time (July 31st) to allow the entire correction to play out.

But I just can't see that 600.14 FP getting hit in the coming decline... yet it's out there, and very likely real. We'll have to wait and see I guess as forecasting the future is impossible. A realistic correction would be 61.8% from the coming high, and starting at the March low, up to the coming high, would only be into the 6800's... but maybe that's too obvious and that's why the 600.14 FP was put out? Who knows for sure.

Lastly, the VIX and the ES contract expiration and roll...

If the market decides to go for the deeper pullback, then the June quarterly expiration of the ES, and the VIX will be important and the market usually likes to crush the VIX into expiration, and since it expires on June 17th, and the ES on the 20th (but the roll on the 15th), it's lines up nicely that the final high on the ES/SPX will go into the 10th-15th window to cause any VIX longs to expire worthless.

This is the perfect setup for any longs in the June ES Futures contract to get trapped too as we roll into the new September contract, which smart money will be shorting looking for the big drop into July.  I must point this out as I can't get married to the idea that we will only pullback small in the next few days as a deeper drop into the 7250's is certainly possible... even if it's a wildcard.


Friday Bonus Update - Scenario THREE

Posted in the chatroom yesterday...

I think I know what they are going to do gang... if my hunch is right they are going to hit the 759.35 FP on the SPY sometime next week. Then they are going to pullback some (5%?) for a wave 4, and then do one final move up into the 15th area where they hit the 787.13 FP on the SPY. Then crash it into mid-July where they hit the 600.14 FP on the SPY. It's the perfect trap as if we get a 5% pullback everyone that missed it will short the move back up. But it won't be a lower high. It will keep on squeezing and squeezing until it hits the 787.13 FP, and all bears will give up then, and start calling for 8000. It might be right into the 17th where the new Fed Chief Warsh comes in. I don't know if he's going to do something crazy or not to cause the crash.. or if it's some other news event that gets blamed. But the timing is perfect for it to play out like this...

Wave Count for Scenario THREE...

Have a great weekend.

ES Morning Update May 21st 2026

0

The market is currently in Small Wave 4 down, and has been since it topped a little early on May 15th, and it appears to have bottomed for Tiny Wave A down and we are in Tiny Wave B up. Once it finishes we should see Tiny Wave C down to make a slightly lower low then Tiny Wave A, and the 7250's is probably the target zone. Timewise I think we see that low by the end of next week. Don't forget that the market is close Monday for Memorial Day, so it will be a short week and light volume I suspect. I posted a chart on X yesterday showing the wave counts, and that chart is below...

Now, for the short term bounce there was a "possible" FP on the SPY after the close yesterday showing 744.79 as a spike high. It happened at 4:40pm EST and is only a one minute candle, so it's probably the target high for the Tiny Wave B rally that we are in right now. It might hit today, or wait until Friday, but after it hits I suspect that will end Tiny Wave B up. Below is that FP...

Then Tiny Wave C down should unfold in a 5 wave pattern next week. But again, we should have light volume and a shorten week, so don't get all "beared up" looking for some big drop (not yet). It's likely to be choppy and not easy to trade (even though it's a C wave). Possibly the last day of the month is when the 3,4, and 5 wave happen and all we do is pierce the low of Tiny Wave A (but 7250-7300 seems likely).

Anyway, after that last low we should finish Small Wave 4 and setup the first week of June for Small Wave 5 up, which should at least reach the FP on the SPY of 759.35 (usually FP's are pierced), which on the ES should be 7630-7640 I'd guess? The SPX would be 7610-7620 maybe? And that first week of June could be just a straight shot up as it squeezes out the bears that will short the bottom of Tiny Wave C down late next week. Then at that new all time high everyone will start calling for 8000 but the "time" will have run out for the bulls and the bears will get the ball, so a very nasty drop should follow after the blow off top.

Have a great weekend.

ES Morning Update May 15th 2026

0

The market continues to grind higher, day after day, with no let up for the trapped bears. This should continue into Monday or Tuesday of next week to finish (finally!) Small Wave 3 up. We are in Tiny Wave 5 up now and it should reach the 7600 zone where there is strong resistance at. In fact, I was given a possible FP on the SPY of 759.35 from a member of the chatroom, which is maybe 7610-7620 on the SPX, and a little higher on the ES of course. Here's that FP...

I posted on X this week a chart of the wave count, and that still stands as "most likely". But I don't know how deep the pullback will be for Small Wave 4 down. However, it should be bigger then all the smaller pullbacks we've had since the start of Small Wave 3 up. Meaning it should be 150-200 points (at least), and could be deeper, but I don't see more then 400 points. For example, if we reach 7600 then 7200 for the pullback would be the most I could see. I really don't expect it to be more then 300 though, which would be around the 7300 zone on the SPX, and that would be about a 23.6% Fibonacci Retracement Level starting at the March 30th low where I'm starting from. Assuming we reach 7600 then 7300 is about that 23.6% retrace point, whereas the low 7100's would be 38.2%, and that's just not likely. Below is that chart posted on X...

Lastly let's look at the bigger picture again. We are still likely in Medium Wave 5 up from that March 30th low, which should end in early June, and it will complete Large Wave 5, which started at the April 4th, 2025 low. Once this completes we should see a large drop that will likely last into October and should fill the gap on the ES at 5339 from April 22nd, 2025. But, I suspect the first drop will reach the 600.14 FP on the SPY within 2 months, and then we rally into August/September, and do the last drop into October to finish it all. After that I expect another massive rally that will go into 2027 and 2028 for what should be the final blow off top similar to 1929. From there the real bear market will start.  Here's that chart...

Have a great weekend.


Add on update for X...

ES Morning Update May 8th 2026

0

Pullback In Play...

Yes, it's a small one, but that's how the bulls keep going as they don't let the trapped bears out, or new bulls onto the bull train. Today should mark the low for my Small Wave 4, and it's not looking like it's going to be very much of a pullback. Support is at 7275 SPX, which is roughly 60-65 lower then the close yesterday. That's about all I can see for this pullback, which is basically the retest of the May 1st high and a gap fill from May 5th.

I would have loved to see it retest the 7150's on the ES, which is where I labeled my S4 on the chart I posted on X Wednesday. I noted it incorrectly though, as I said "Expected low date is Friday, May 5th", which today is Friday, May 8th, and that's what I meant to type. Also, the "Expected next high date is Friday, May 11th" should be Monday, May 18th... not sure what I was thinking when I typed that up (sorry). Here's that chart again...

As you can see I was "kinda" suggesting we could retest the sideways zone in the 7150's, but it's too obvious, and won't likely be hit. Every bull (and bear) is looking for it, as bears want out and bulls want to buy that level. The zone is around 7275 SPX (7285/90 ES), and "if" it reached today I'd look to go long. This market should hit the 7600 zone easily by June 5th, and possibly 7700 or even 7800? But once that date area is hit the top is going to appear.

We should see everyone calling for 8000 around that time, and it should not hit. It's a very obvious target, and the market never gives everyone want they want and expect. If it were to hit 8000 then it would go through it by 100-200 points to take out the shorts at 8000, but I don't think it will get that high. I suspect it will be in the 7700-7800 zone when we top. Who knows? Maybe we see 7777 or something?

There's a window of June 1st to June 10th for the expected highs according to prior cycles, but most of those cycles point to around June 5th, so that's the zone to look for. For now though, whatever low we see today (which could extend into Sunday night or Monday open) is likely all we will see and it's more squeeze next week.

Have a great weekend.

s2Member®