

[protect password="1987"]
It all started back in 2010 when I discovered the stock market was rigged!
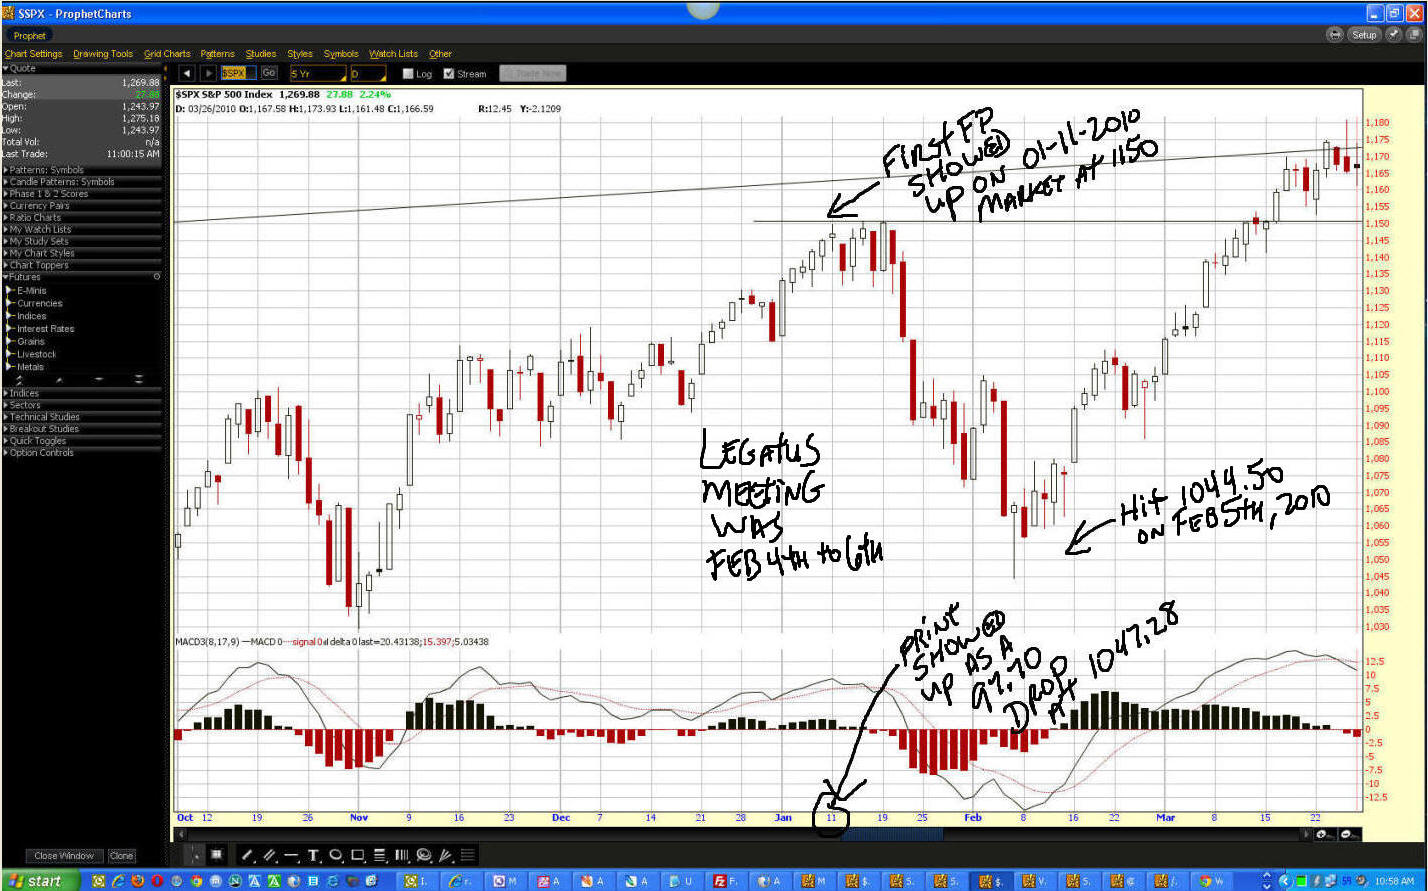
On January 11th, 2010 I happened to check the end of the day price on the SPX and discovered something strange. The market was basically flat that day trading in a tight range with an intraday high of 1149.74 SPX and low of 1142.02, which was just barely over a 7 points swing. I didn't know anything about numerology back then but later learned the importance of the date and the numbers... which I will discuss later. What was showing up on the CNN Money site was a 97.70 drop that day on the SPX (which I started calling them "fake prints" or "FP's"), putting the low at 1047.28... almost a 100 point drop on a day that didn't move but around 7 points! Talk about a big mistake, this was a doosy and would been considered a flash crash back then! Of course I was a little suspicious about it and immediately thought it was a coded message for the insiders.
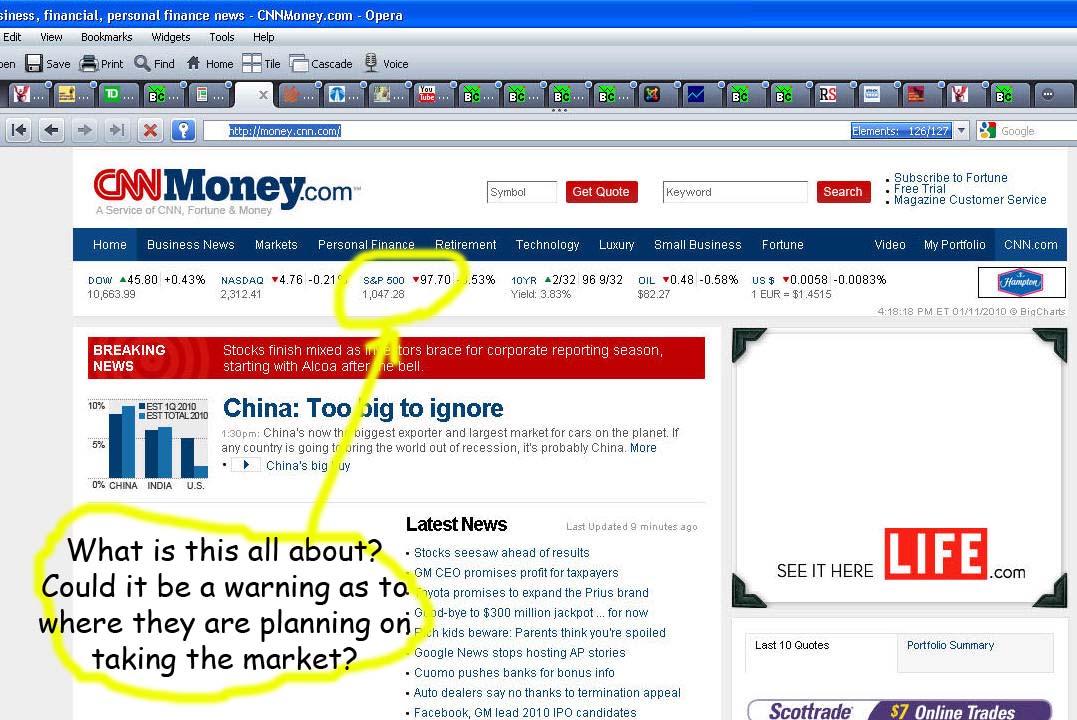
Low and behold just 25 days later (18 trading days) the SPX drops to hit that low and pierce it a few points before ripping back up for many months afterwards and finally topping out in April. Clearly this turned out to be a coded message to the insiders as to the coming low. This was also around the time I discovered the importance of Legatus events (http://legatus.org) as this was where the elite would meet and decide many things... including "when" to turn the stock market up or down. While every Legatus meeting wasn't a "turn" in the stock market many were. In fact the "pilgrimages" seemed to be the most important ones. Strangely there was a Legatus meeting between February 4th through the 6th of that year and the market bottomed right in the middle on the 5th... coincidence? I think not.
Ok, so that's all weird enough but after I learned (it was many months later) a little about numerology I went back to look at the numbers in that date and print. You see, the elite use numbers in everything and some of the most powerful to them are multiples of the number "eleven", and that would include numbers like 111, 1111, 22, 222, 33, 333, 444, 55, etc... as they are all dividable by 11. Of course the satanic number 666 or 999 (which is 666 upside down) is very important to them too. In fact they bottomed the SPX in the 2009 crash low at 666.79 just for that reason... to show off and gain power from satan because they control the stock market. (There apparently are about 5 different factions of the illuminati and the zionist are the one's controlling the market, but they all use numerology).
Getting back to that coded fake print...
First off you'll see that the date they put the print out for all to see was on the 11th of the month... next we see that the low target was 1047.28, which if you add the 4+7 together you get 11, then the 28 is 2+8, or 10. Now in numerology there's no "zero's", so they just drop them... therefore the 10 becomes just a 1, and the 1047 becomes 1011, or 111 (dropping the zero) and then all together it's 111.1, or just 1111. That's a clear code for the insiders that's the FP is a real one. To double confirm it they put it out on the 11th of the month. Insiders knew how to decipher the code and knew the low would be around the next Legatus meeting, but I was not a "member" of their satanic group so it took me many years (still learning) to understand as much as I do today.
In their rules of numerology the number 11 and multiples of it do NOT breakdown and are left as a whole number. You only add together the other digits to come up with some final number and drop out the zero's. It's tricky to understand and I certainly am NO master at it. I just have learned to play around with the numbers to see what they are saying. Then I look for further conformation with other stuff, like possibly a Legatus event and/or technical analysis and some Elliottwave.
Now if you think it's all bologna then look at this...
Later that year on May 6th, 2010 we saw a flash crash happen, but what was interesting was that it was foretold with a FP the night before around 5 minutes until midnight. I did not see it until after it happened so in the image below you'll see both the FP showing a low of 1056 on S&P500 Futures (Symbol is: /ES) and what happened the next day.
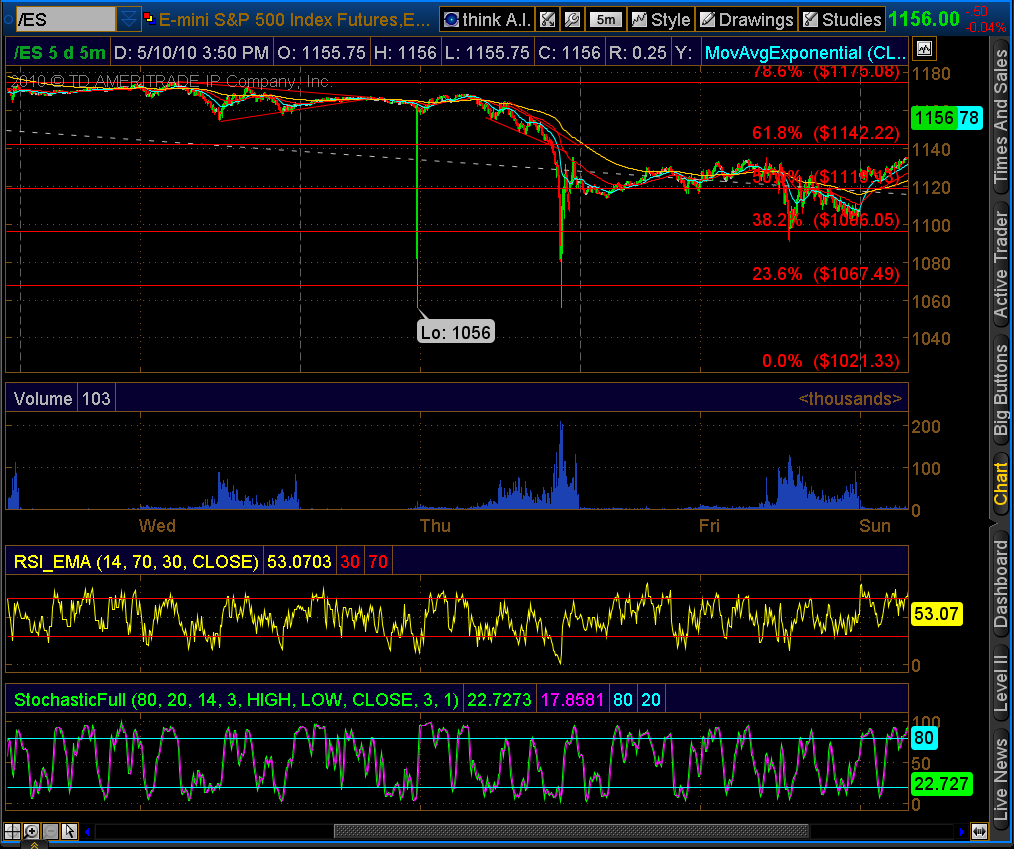
Here's another image of it on the one minute chart. You'll notice that 1056 broken down in numerology is 111, as you'll add the 5+6 to get 11, then put the 1 in front of it and drop the zero. The market dropped to almost that 1056 level the next day on May 6th, 2010 before bottoming and reversing back up hard and fast. Clearly this was another signal to the insiders.

There are many numbers used in the elites' numerology but 11, 22, 33, 322, 23, 666, and 911 are favorites I've noticed. They mix and match them and show them in television shows and movies. It's not easy to figure them out, especially for an outsider, but I do my best when I spot something of interest to note it and use it with other stuff to "try" and figure out where the market is going next.
Moving on to the current market and the "possible" near term moves...
On January 26th, 2018 the DOW hit a high of 26,616.71... which has three "six's" in it, and only about 50 points shy of being 26,666! This was a code for those that saw it. And for those that missed it there was the 666 point drop on the DOW on Friday, February 2nd 2018... another signal to the insiders.

The day before the top in the stock market we saw crude oil futures hit a high of 66.66 on January 25th... yet another signal to those "in the know". One or two times I'd call it a coincidence, but time after time after time I'd have to call it a coded message.

You know I told you that the elite use television shows and the movies for signals as well... right? For example the movies "Inception (2010)" and "Lucy (2014)" both had scenes in them where they showed a passport with the expiration dates saying August 24th, 2015... the date of the Flash Crash. If you were a real insiders you would have shorted the market the day before that and made a ton of money. That's past history for now but I wanted to give you proof on it anyway.
Ok Red, I get the message... now what else have you got for me?
Glad you ask that as it's time to move on to what I've recently discovered that has me a little worried about the month of March. First off I have to "make note" of things the elite say via some article or news story, and one of them is by Bank of America, which we all know is one of the banks on the "inside". Late last year they put out a warning news story titled "Bank of America: Flash crash in 2018 then war to follow", which I reported on my site (http://reddragonleo.com/2017/11/29/bank-of-america-flash-crash-in-2018-then-war-to-follow/). This got me thinking about 1987 again so I decided to study it some more as it was the worst crash year of the three they mentioned (1987, 1994, and 1998), and we seem to be tracking it better right now then the other two right now.
One of the things I like to do is to use a site called "Time and Date" (http://www.timeanddate.com) to play with the numbers as I know how much they are used by the elite to foretell the future. So I go back to look at the DOW in 1987 and here is what I discovered...

- The TOP was on August 25th 1987 with a close of 2,722.40
- The LOW on the first move down was on September 8th with a close of 2,545.12 (a 252.92 drop so far or 9.2%)
- Time from TOP to first low was 14 calender days.
- The first move UP topped on September 14th with a close of 2,613.04, which was a "lower high" and about a 55.6% retracement or so. (I'm not counting 9/1/87 as I'm looking for multiday bounce moves, not a half day or one day fast bounce that gets reversed thereafter)
- From the first low to that first rally high it took 6 calendar days, and 20 days from the TOP.
- Next the market dropped to a "lower low" of 2,468.99 on September 22nd before reversing hard that day to start the next move up. (a 277.71 drop so far or 10.1%)
- From that last high down to that new lower low took 8 calendar days and is 28 days in total from the TOP.
- The second rally UP topped on October 2nd with a high of 2,662.30, which was about a 70% move up from the second lower low and was a little higher then the first move UP was.
- This move up from the LOW took 10 calendar days and is now 38 days from the TOP.
- From that second rally high the market started down slowly and then faster until it crashed on October 19th and put in a slight lower low on the 20th before rallying back up hard to end the entire move down.
- That move down took 17 calendar days to make the entire move from the all time TOP high a 55 day pattern move with the intraday low the next day at 1,616.20 for a total drop of about 40% or so.
Now let's look at today's recent high to compare...

- The DOW topped on January 26th, 2018 with a high of 26,616.71
- It then fell to hit an intraday low of 23,360.29 on February 2nd, 2018 (a 3,256.42 point drop so far or 12.2%)
- From the TOP to the first low was 14 calendar days.
- The first move UP topped on February 16th with an intraday high of 25,432.42, a 2,072.13 point retracement, which is about a 63.6% so far... (I'm not counting 2/6/18 as I'm looking for multiday bounce moves, not a half day or one day fast bounce that gets reversed thereafter)
- From the first low to that first rally high it took 7 calendar days, and 21 days from the TOP.
So far the highs to lows are tracking fairly close... time wise I mean. I wouldn't expect them to be exact but to resemble each other a little if the same thing is going to happen in March of 2018 as it did in October of 1987? While I hope I'm completely wrong on this and that we DO NOT Crash I have to follow this pattern closely... and if it continues we should have a move down next week that about 8 days and puts us around day 28 from the January 26th all time high. The 28 day mark points to February 23rd, 2018 while the 8 down days from the bounce high is yet to be known as we could go a little higher Tuesday morning, or have topped on Friday?
While in 1987 the first drop was 14 days and in 2018 the first drop was also 14 days the move up in 1987 was 6 days and if we topped on Friday then it was 7 days up... a slight difference, but one that I'd expect to see so they wouldn't be too obvious.
In 1987 it the market was setting up a nice looking "Inverted Head and Shoulders" pattern with the first low being the "left shoulder" the lower low being the "head" and the slow move down that started the crash move being the "right shoulder"... that is, until it FAILED and made a lower low then the "head" of the pattern. That move down all started from the last important high on day 38 from the top. If you compare that to today it will point to March 5th being the last high (should be higher then this current rally but lower then the all time high) before the 17 day drop into the crash low. In total the 1987 crash took 55 calendar days and the 1929 crash took 56 days... very close if you ask me.
So where does this all lead us to today and is it really that close to suggest the same will happen again?
Normally I say that there's low odds of this happening again, but all those additional clues via codes with numbers and Bank of America waring of a crash has me very concerned. Then there's this... and I mean THIS! Yeah, it's a biggy that just can't be a random coincidence. I'm talking about how many days it is from the August 25th, 1987 high to the January 26th, 2018 high. If you don't count August 25th and start counting the day afterwards you'll get a total of 11,111 days from that top in 1987 to the top in 2018! Tell me that's just a coincidence and I'll sell you some oceanfront property in Kansas!
Now look, I hope I'm totally wrong on this but there's a lot of "code's" popping up in the numbers here that just shouldn't be ignored. You have a top on crude oil of 66.66, the DOW have a 666 point drop, 11,111 days from top to top, and if you breakdown the high in the SPX of 2872.87 you could say it looks like a code for 1987! Just add the 2+8 to make 10, drop the zero... then the 7+2 is 9, so you have a 1 and a 9 so far with a .87 left. Yeah, it's reaching and not really numerology but with all the other codes too this one could mean 1987.
However, in all fairness I haven't had time to compare today to 1994 or 1998 as I just don't have the time right now... and it's tracking 1987 fairly well right now. So I'm looking for some differences to appear between the current market and that in 1987, and that could be something as simple as a "higher low" setting up on the next move down next week instead of a lower low like on 9/22/1987... then another strong rally up that goes a little higher then this current bounce rally high. Maybe it takes a little longer to top and passes the 38 day mark of March 5th? It's at that point I'd be quite worried as the next 17 days the bulls will be sweating bullets time stamped 1929 and 1987! If the market can get through March without crashing I'll be a happy camper as I have other investments I'm in that really need a bull market or sideways choppy one to do well. A crash of that magnitude will be bad for everyone. But if it happens we could see some massive buying opportunities show up as inflation will surely follow... plus a war if Bank of America is correct.
If your head is spinning now... join the crowd!
There are just too many strange patterns, numbers and codes to completely refuse to believe that the market can crash in March. While I'm not a fortune teller and can NOT tell you for 100% sure that the market is going to crash I feel I needed to inform everyone of these information. You can make your own judgement on it and trade accordingly. I've never actually met anyone who called a crash in advance and successfully traded it. I hope I'm completely wrong on it and that we end up following some pattern in 1994 or 1998, but so far we are tracking 1987 the best I believe. I encourage you to study the other years and see what you come up with. The high in 1994 was on January 31st and it is 8761 days until the January 26th, 2018 high... not any ritual number that I'm aware of? The high in 1998 was July 20th and it is 7130 days from our recent high... again, not any codes there.
Anyway, make of it what you will. It's my first weekend update and video in a very long time. I felt it was of importance and should be shared with as many real people as possible. Share with your friends but please don't copy the video and text to repost publicly as that just leads to SkyNet reading it and getting too much exposure, which could change the outcome for the good or bad? If you have questions or comments feel free to stop in the chatroom. There's only a few of us and we don't chat all day. However it's a good group of people and fun to hang out with when the market stresses you out.
Good luck to us all this coming March...
Red
[/protect]

