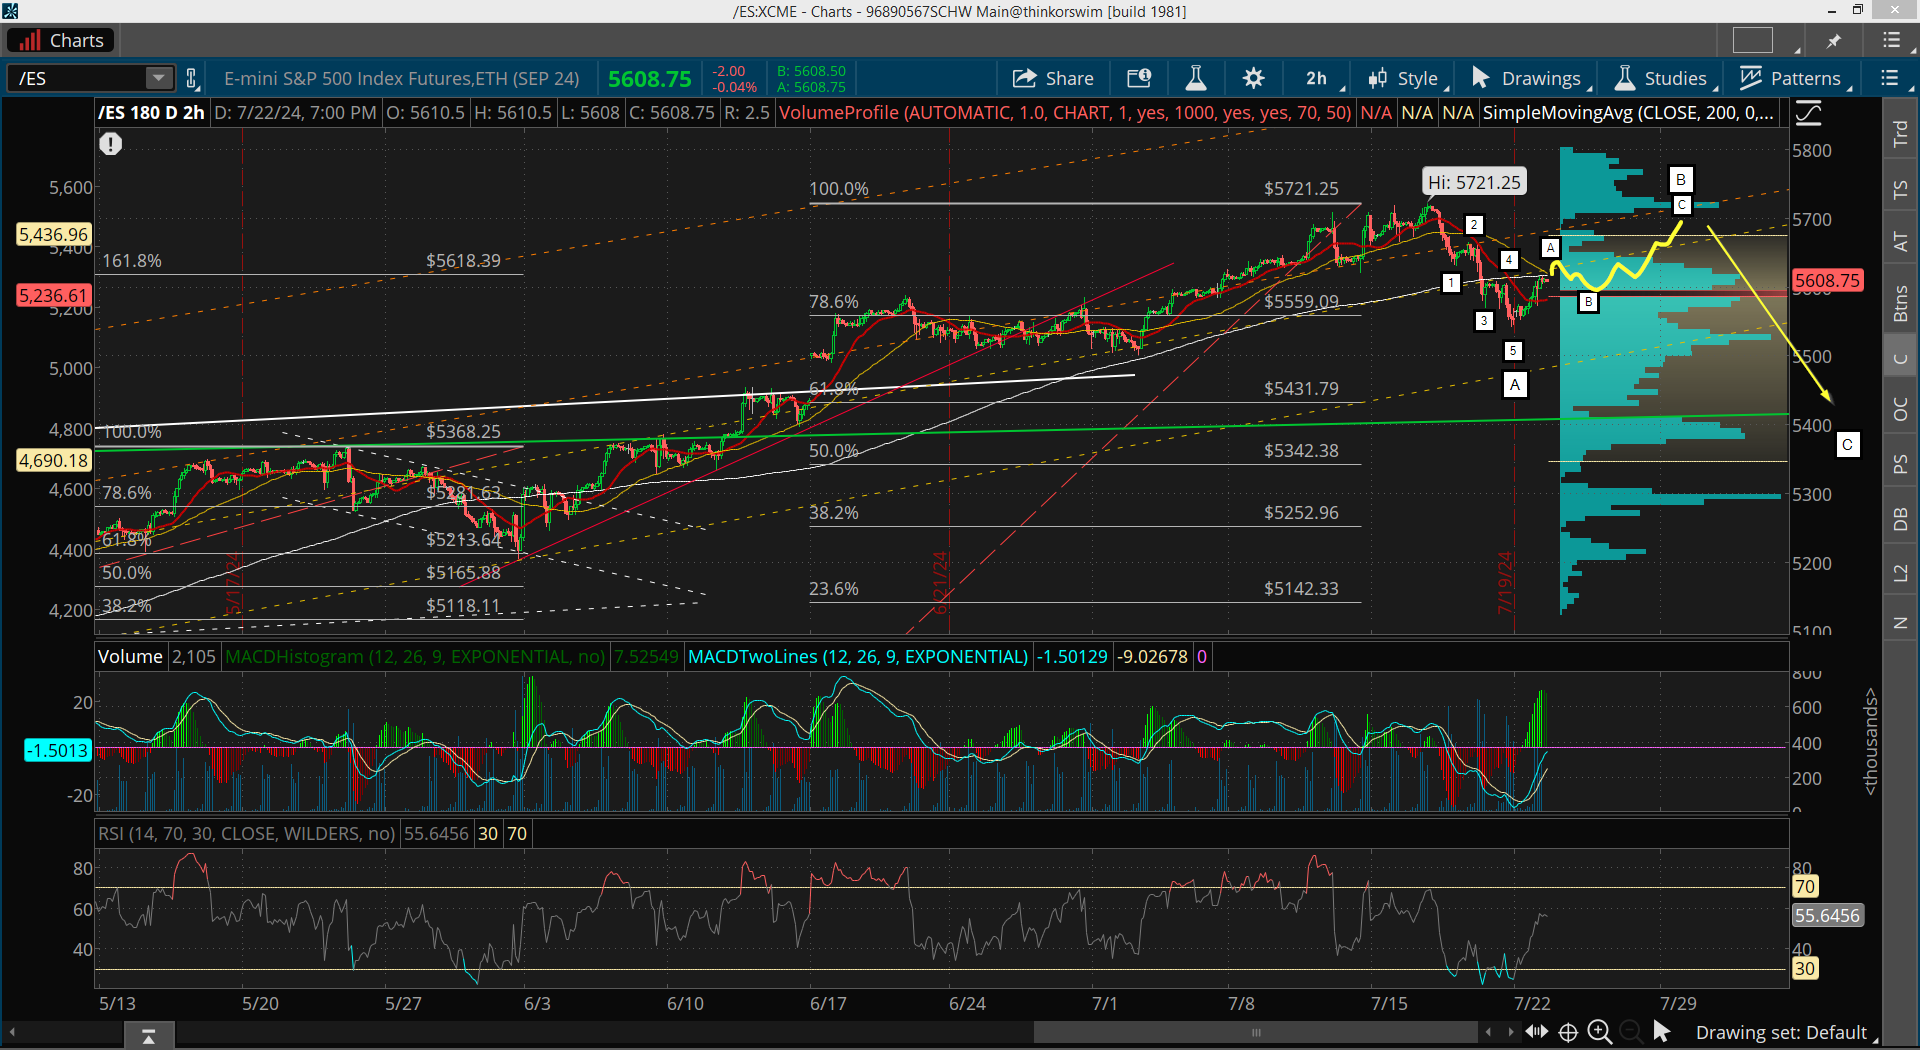
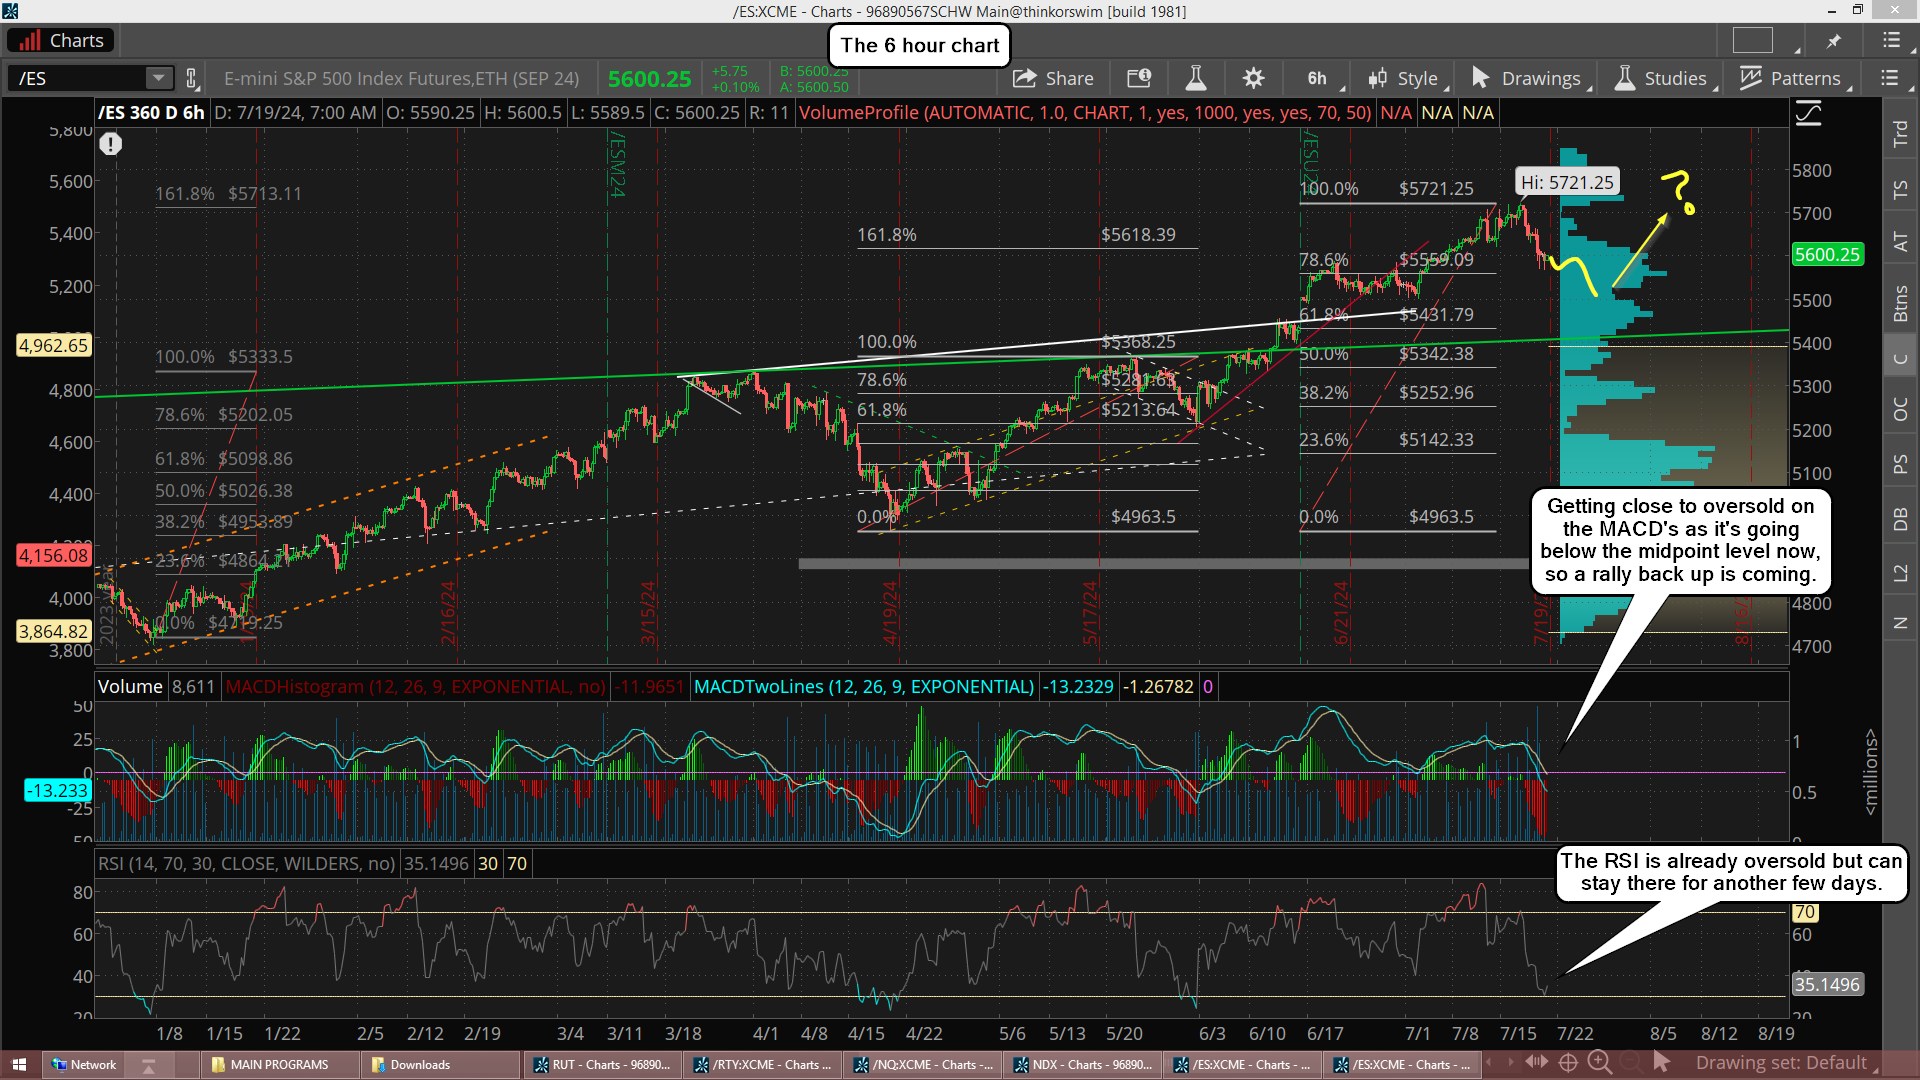
I didn't have a chance to do a post yesterday... sorry about that. Hopefully everyone figured out that the move down wasn't over with on Wednesday, and in fact I still don't think it's over, but it's close. The RSI on the 6hr chart is close now to oversold, and I suspect it will get that way today or possibly into Monday morning.
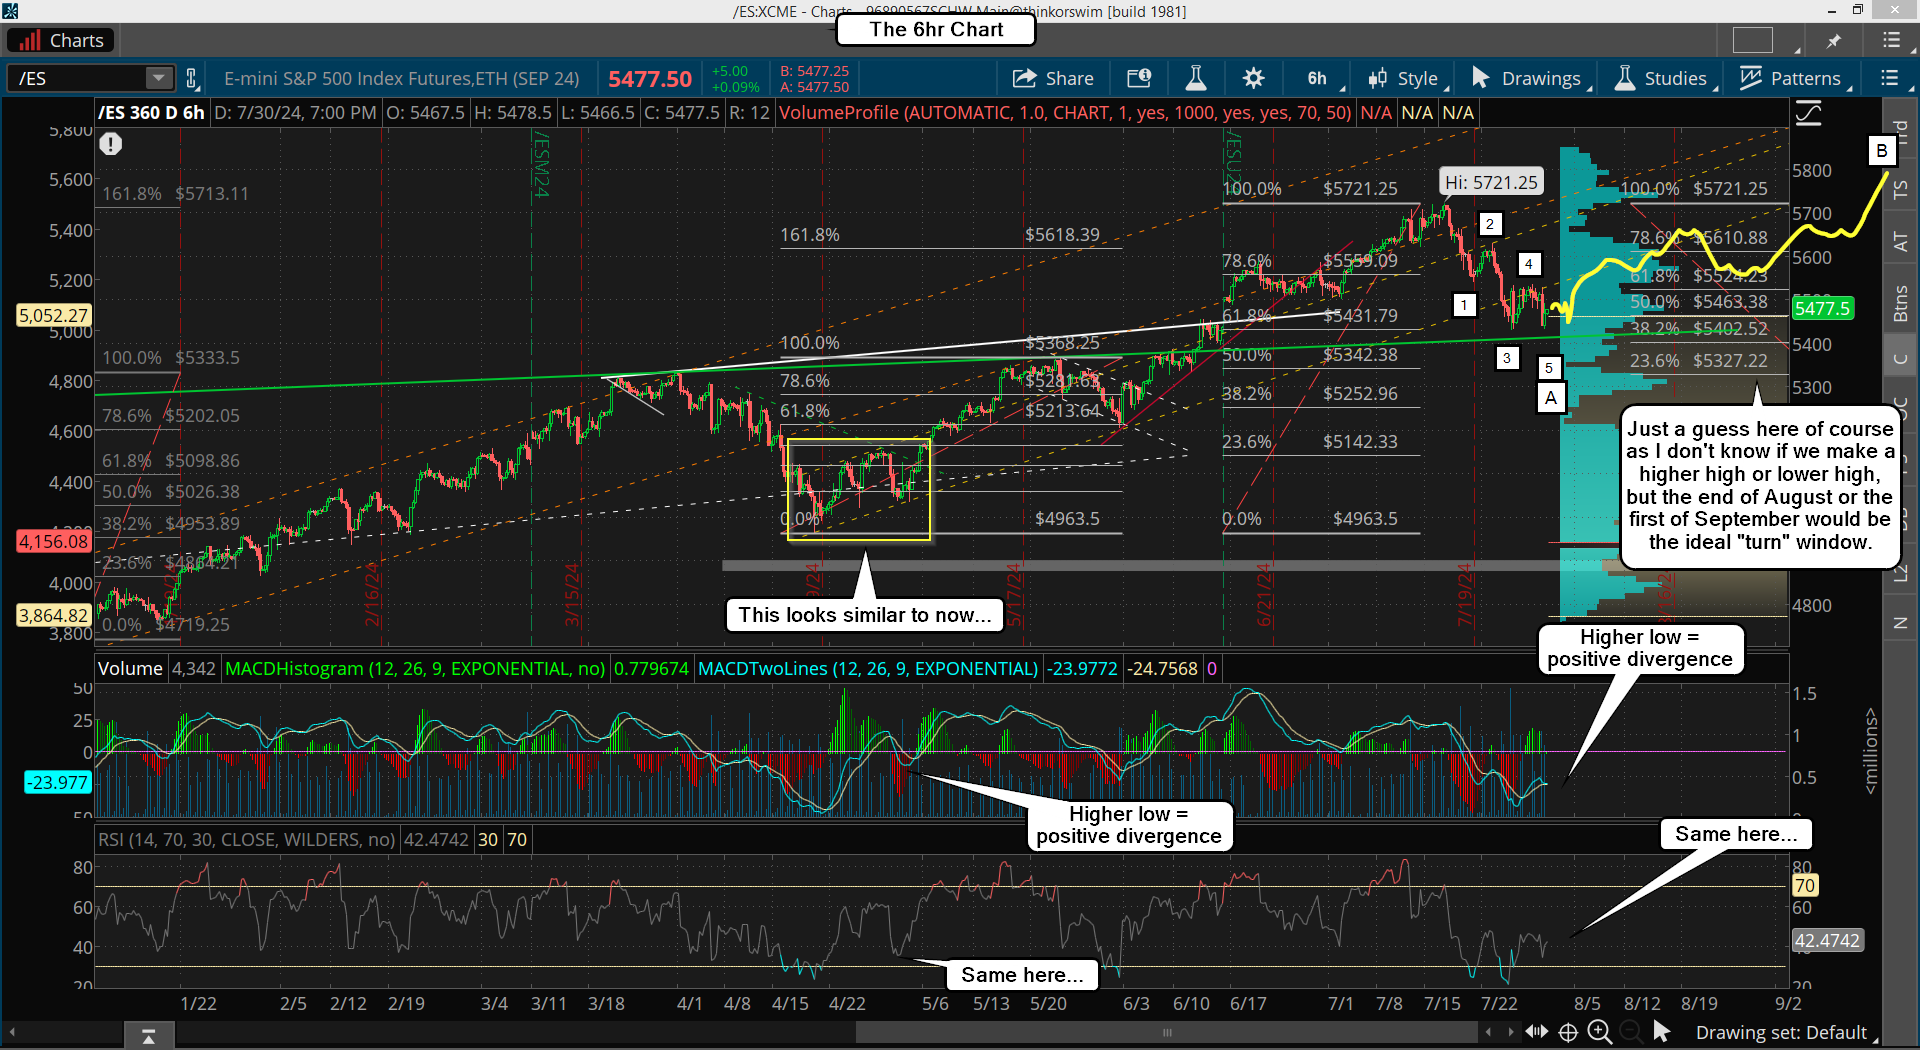
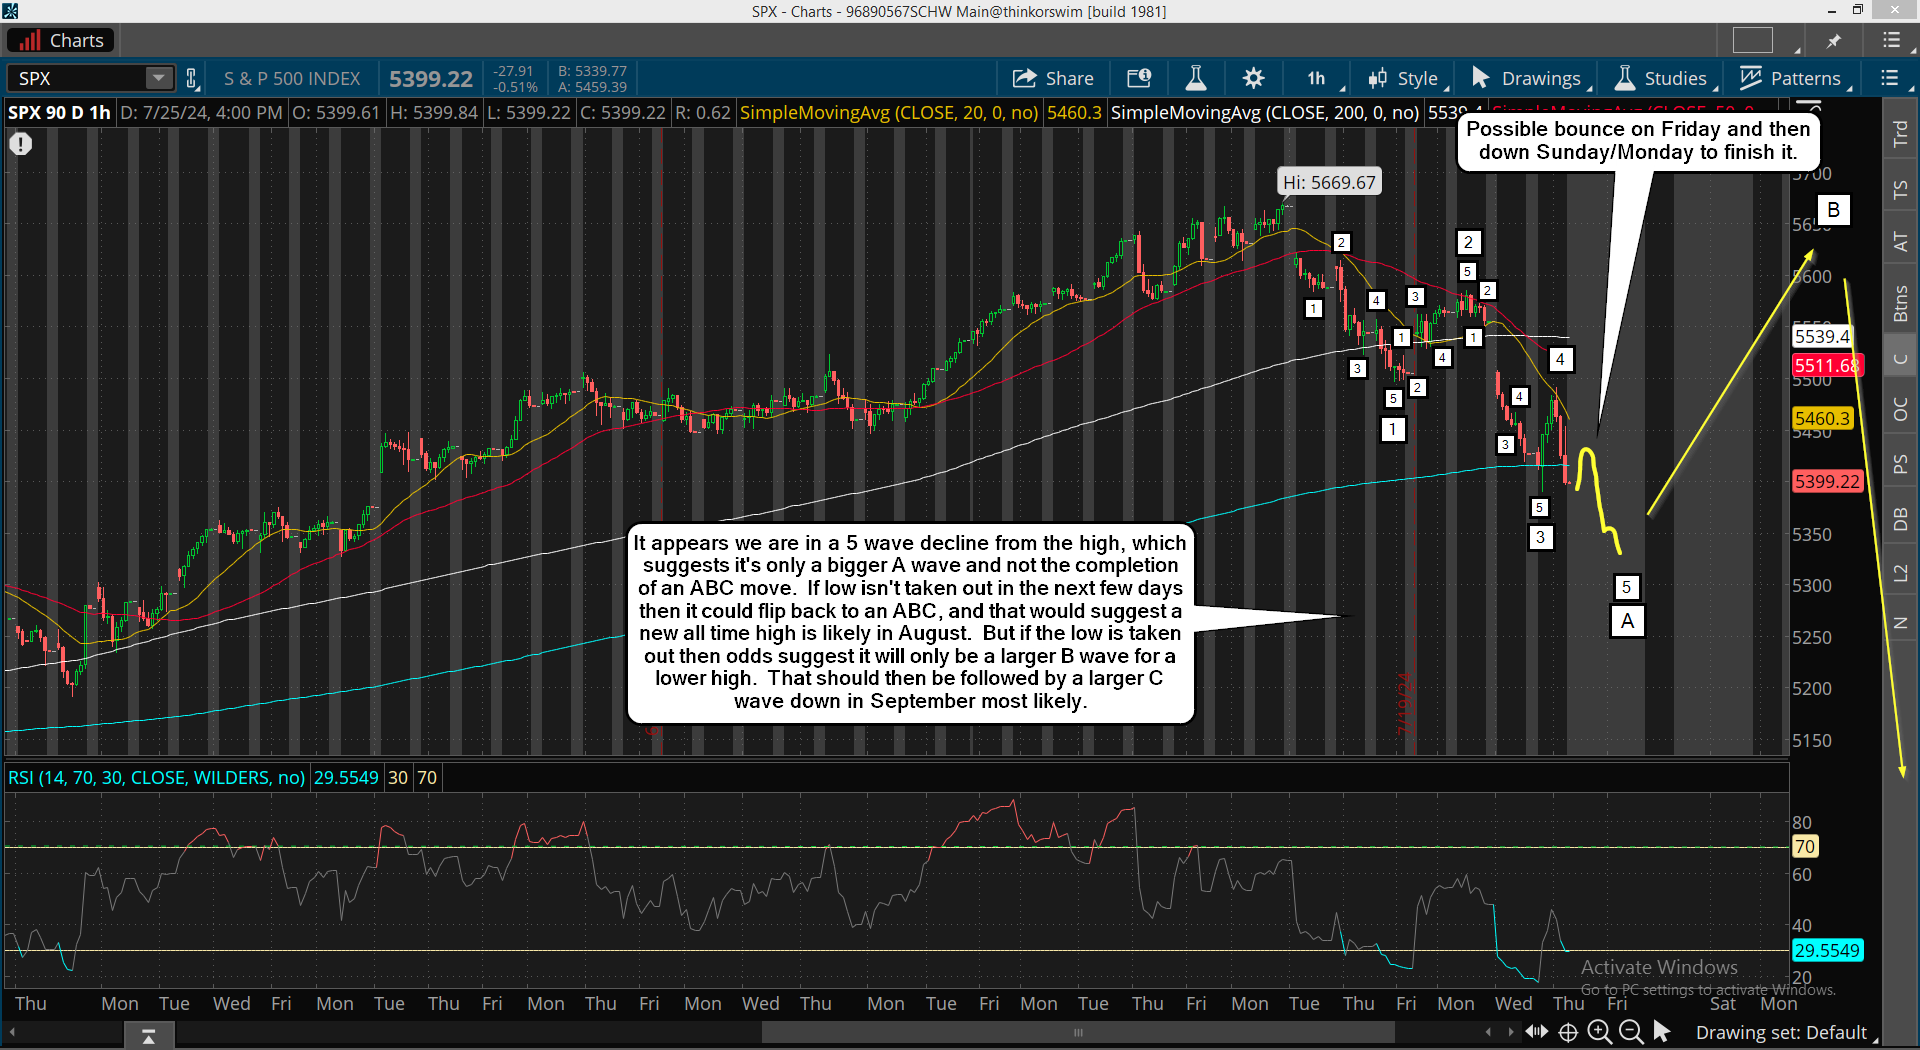
We likely had a wave 1 down Wednesday, then a small 2 up early Thursday with the wave 3 down the rest of the day. That wave 3 could subdivide into 5 smaller waves and still be in play today? Once finished, possibly a bounce into the close today to do the wave 4, and Monday finishes the 5th wave down. All of those waves should make up the A wave in an ABC down that could drag out into August. Here's that 6hr chart.
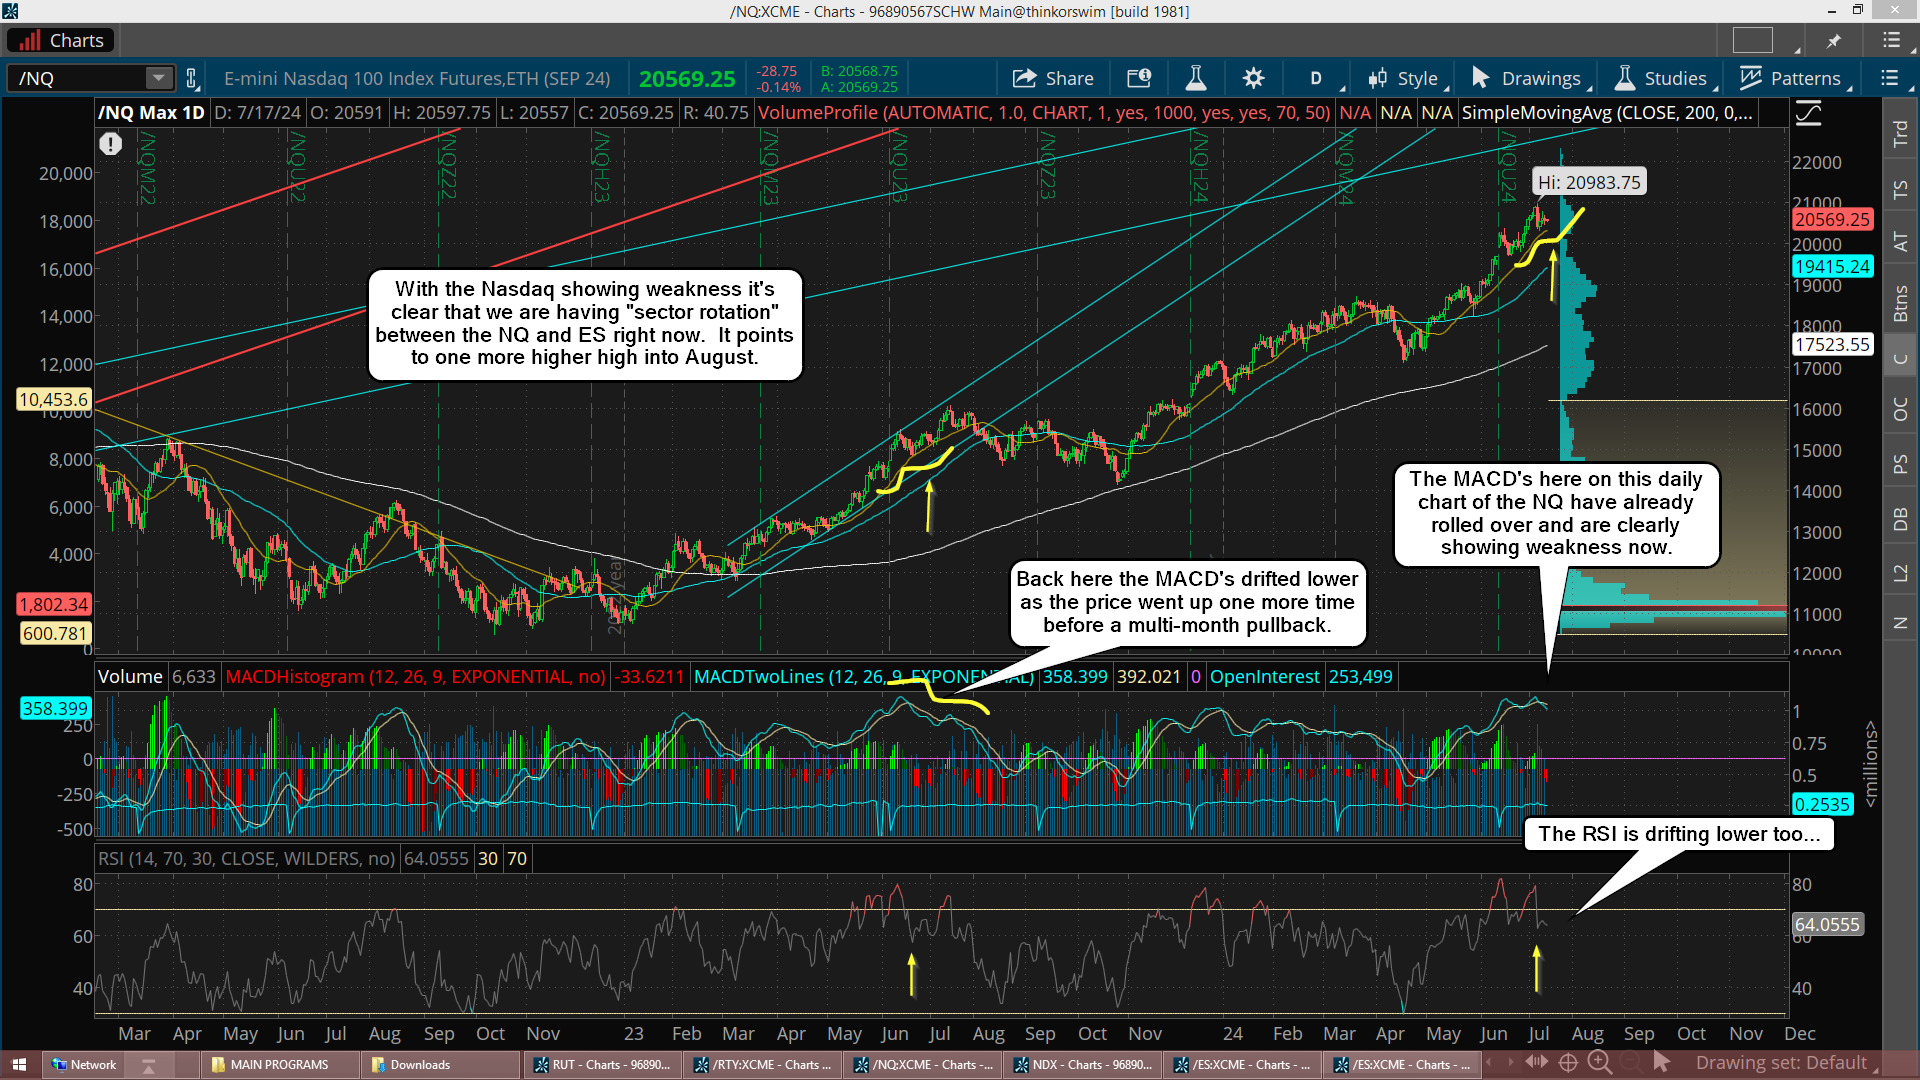
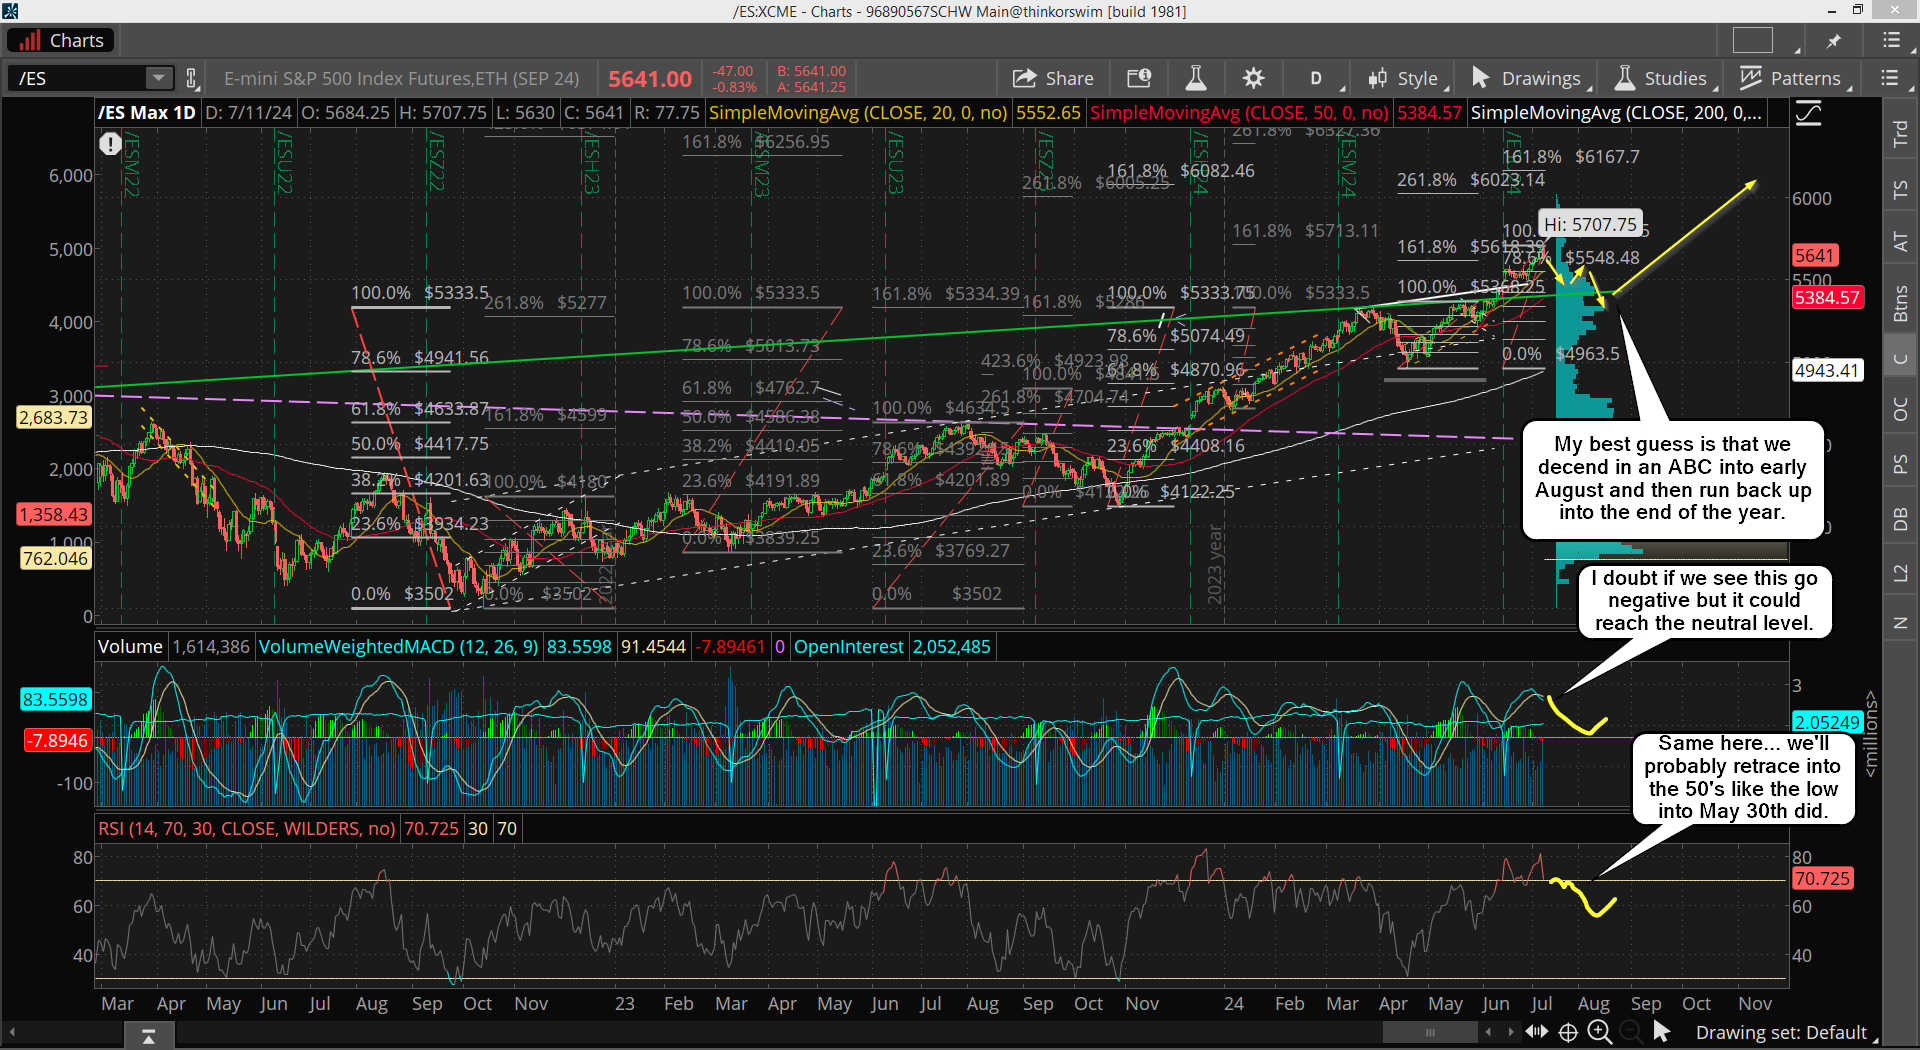
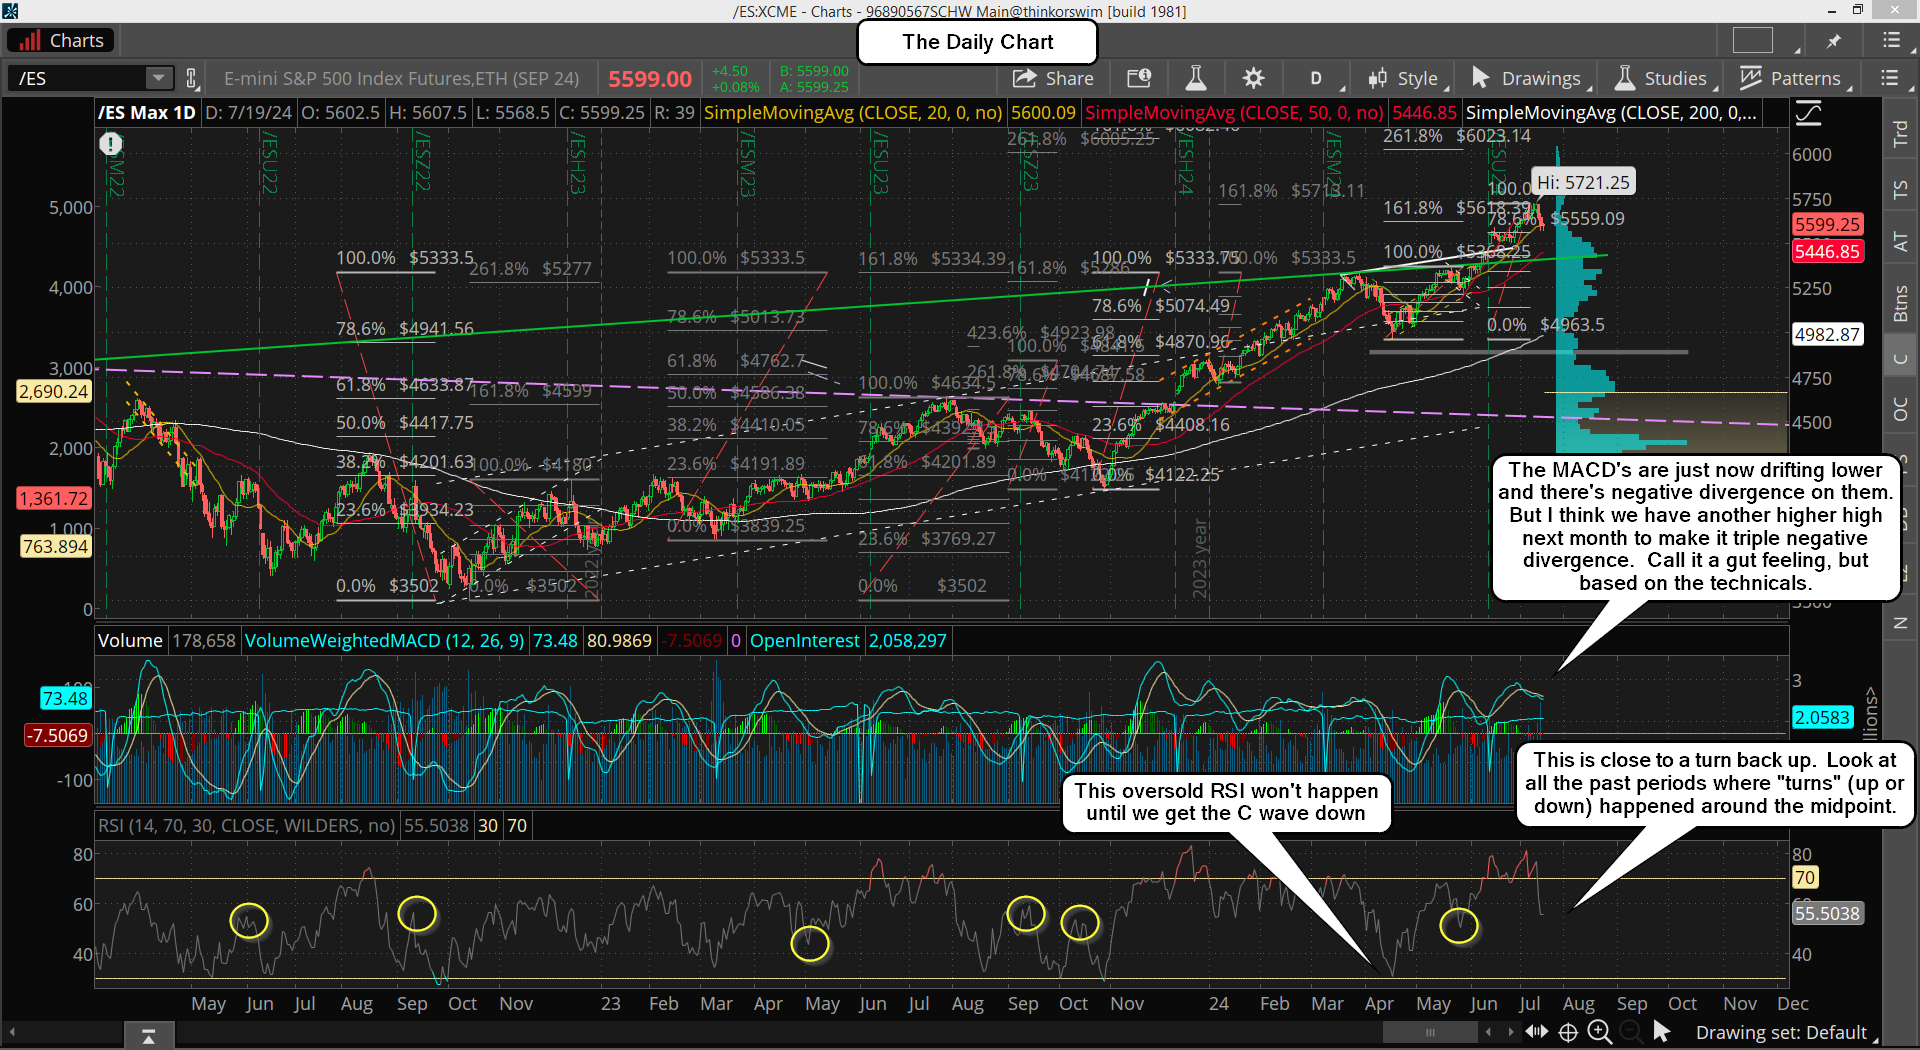
Now on the daily chart we reached the midpoint level on the RSI so a bounce is coming in a few days, but the MACD's are still up to high and will likely go negative for that C wave and then the RSI will probably reach oversold too (or close to it like 4/19/24). Let's look that chart now...
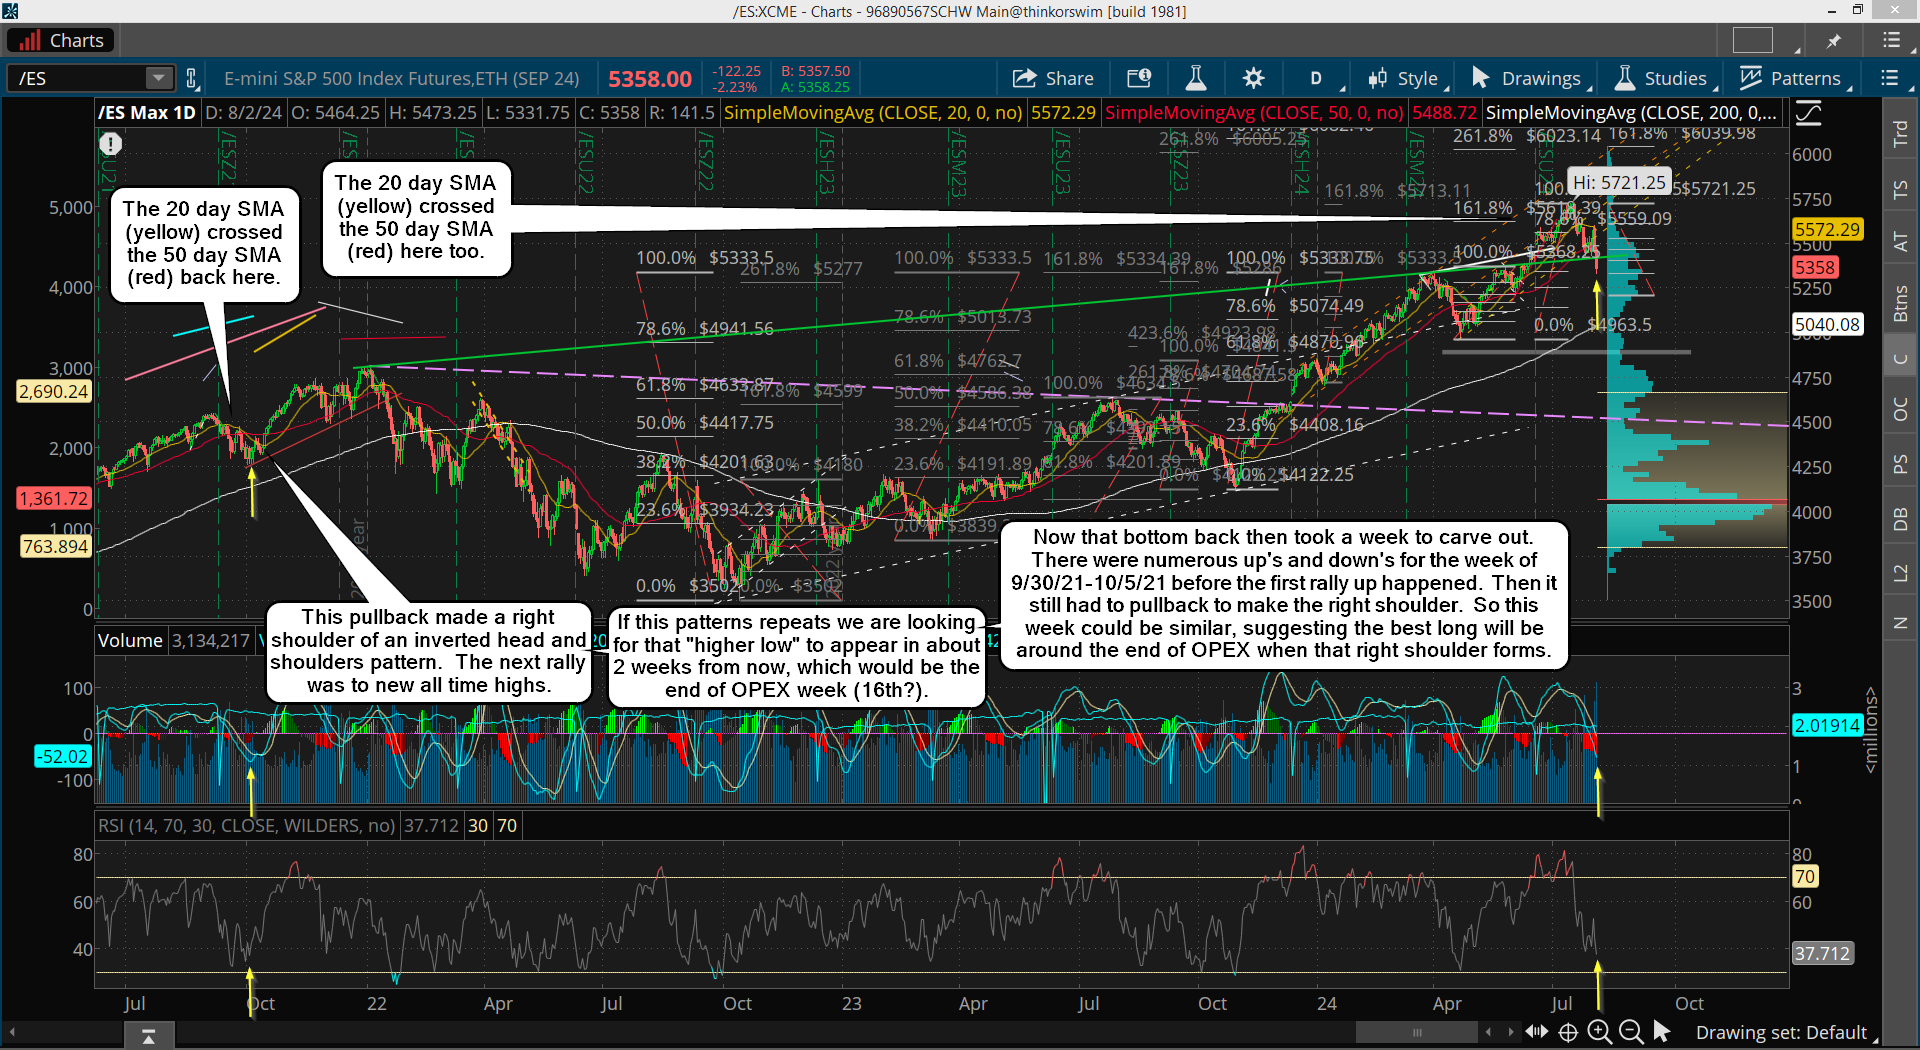
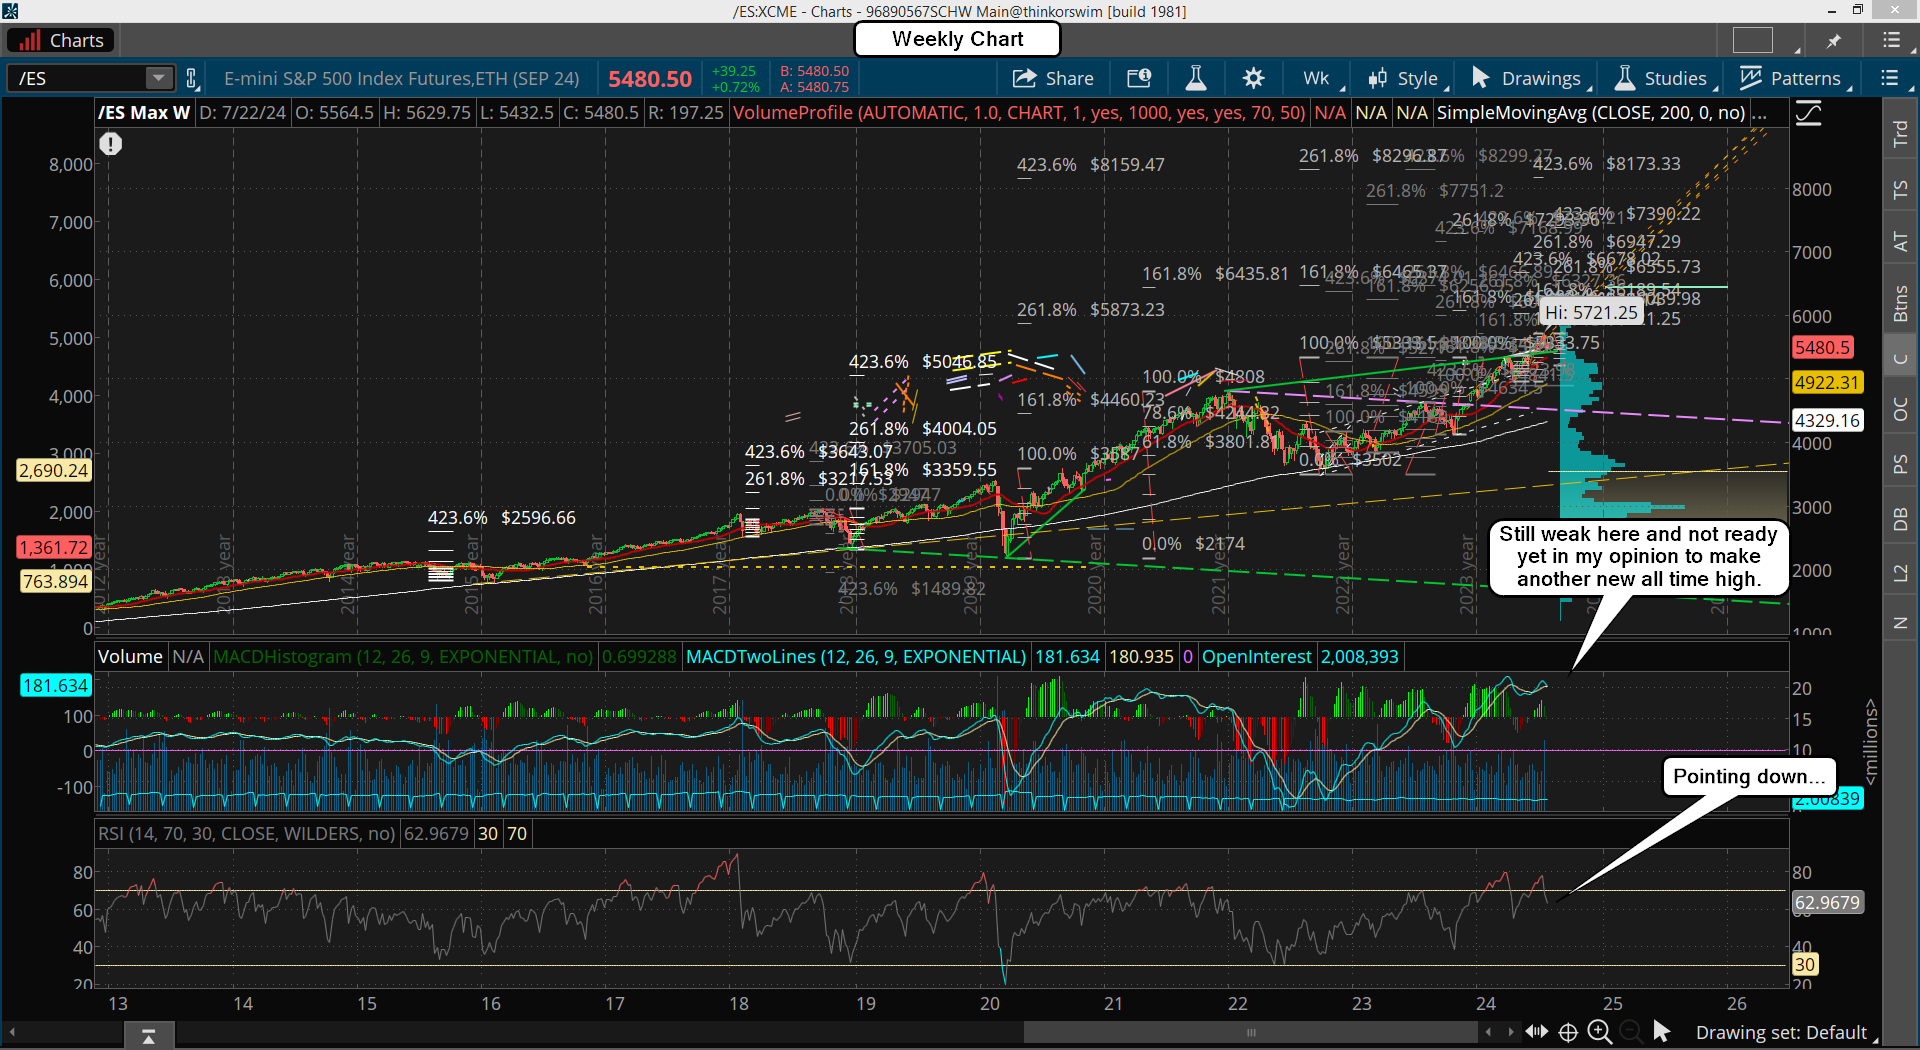
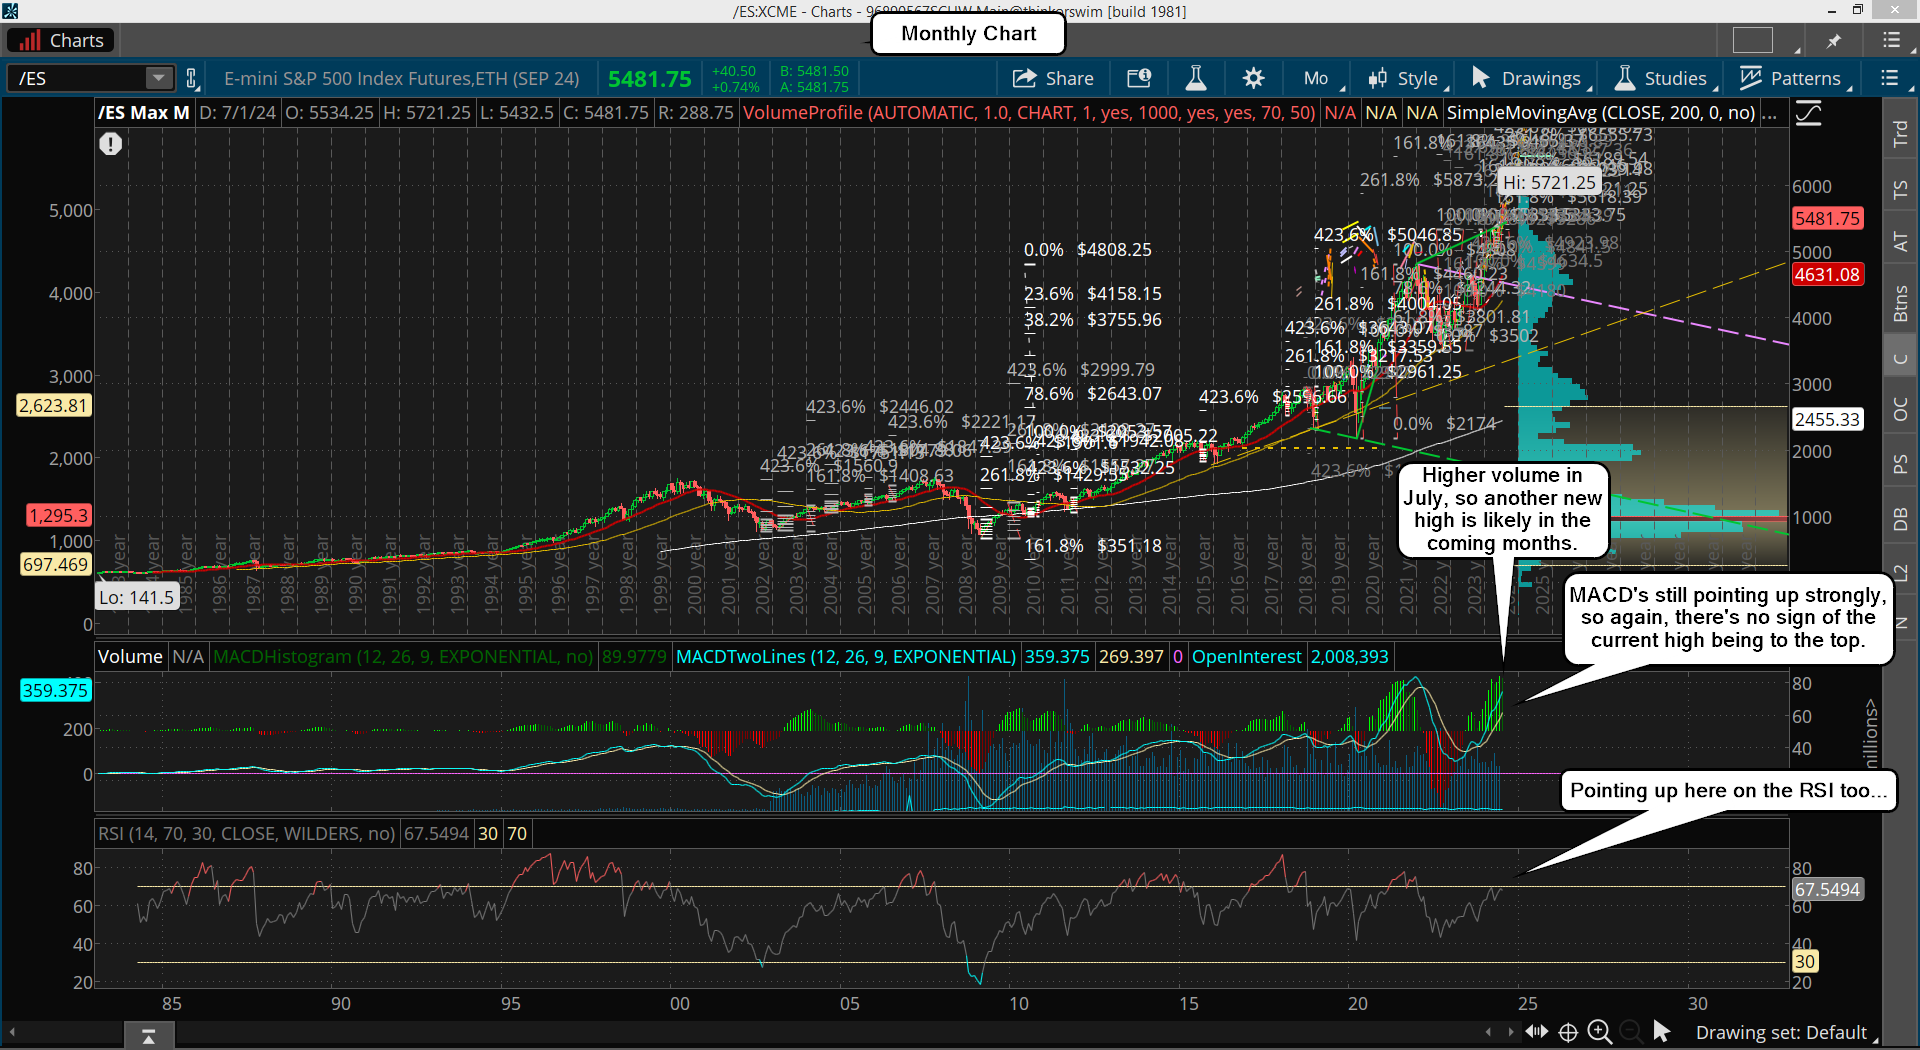
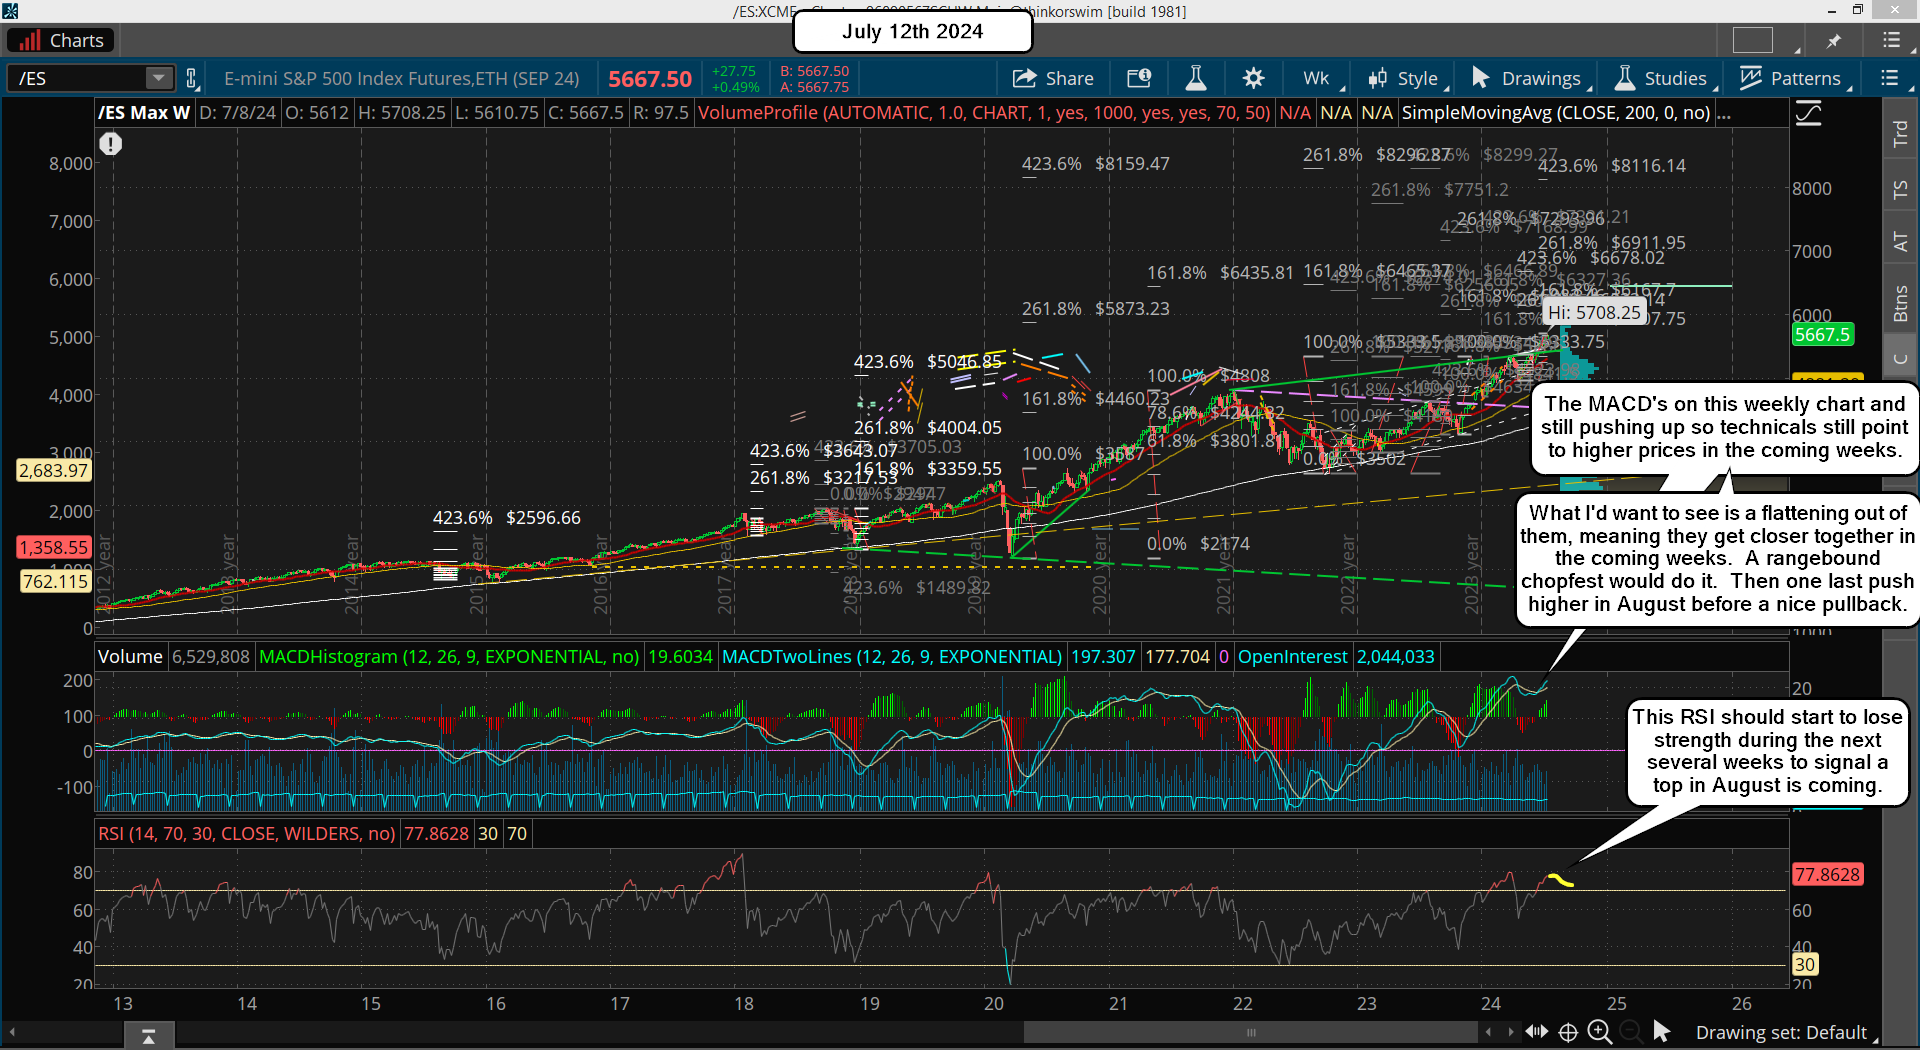
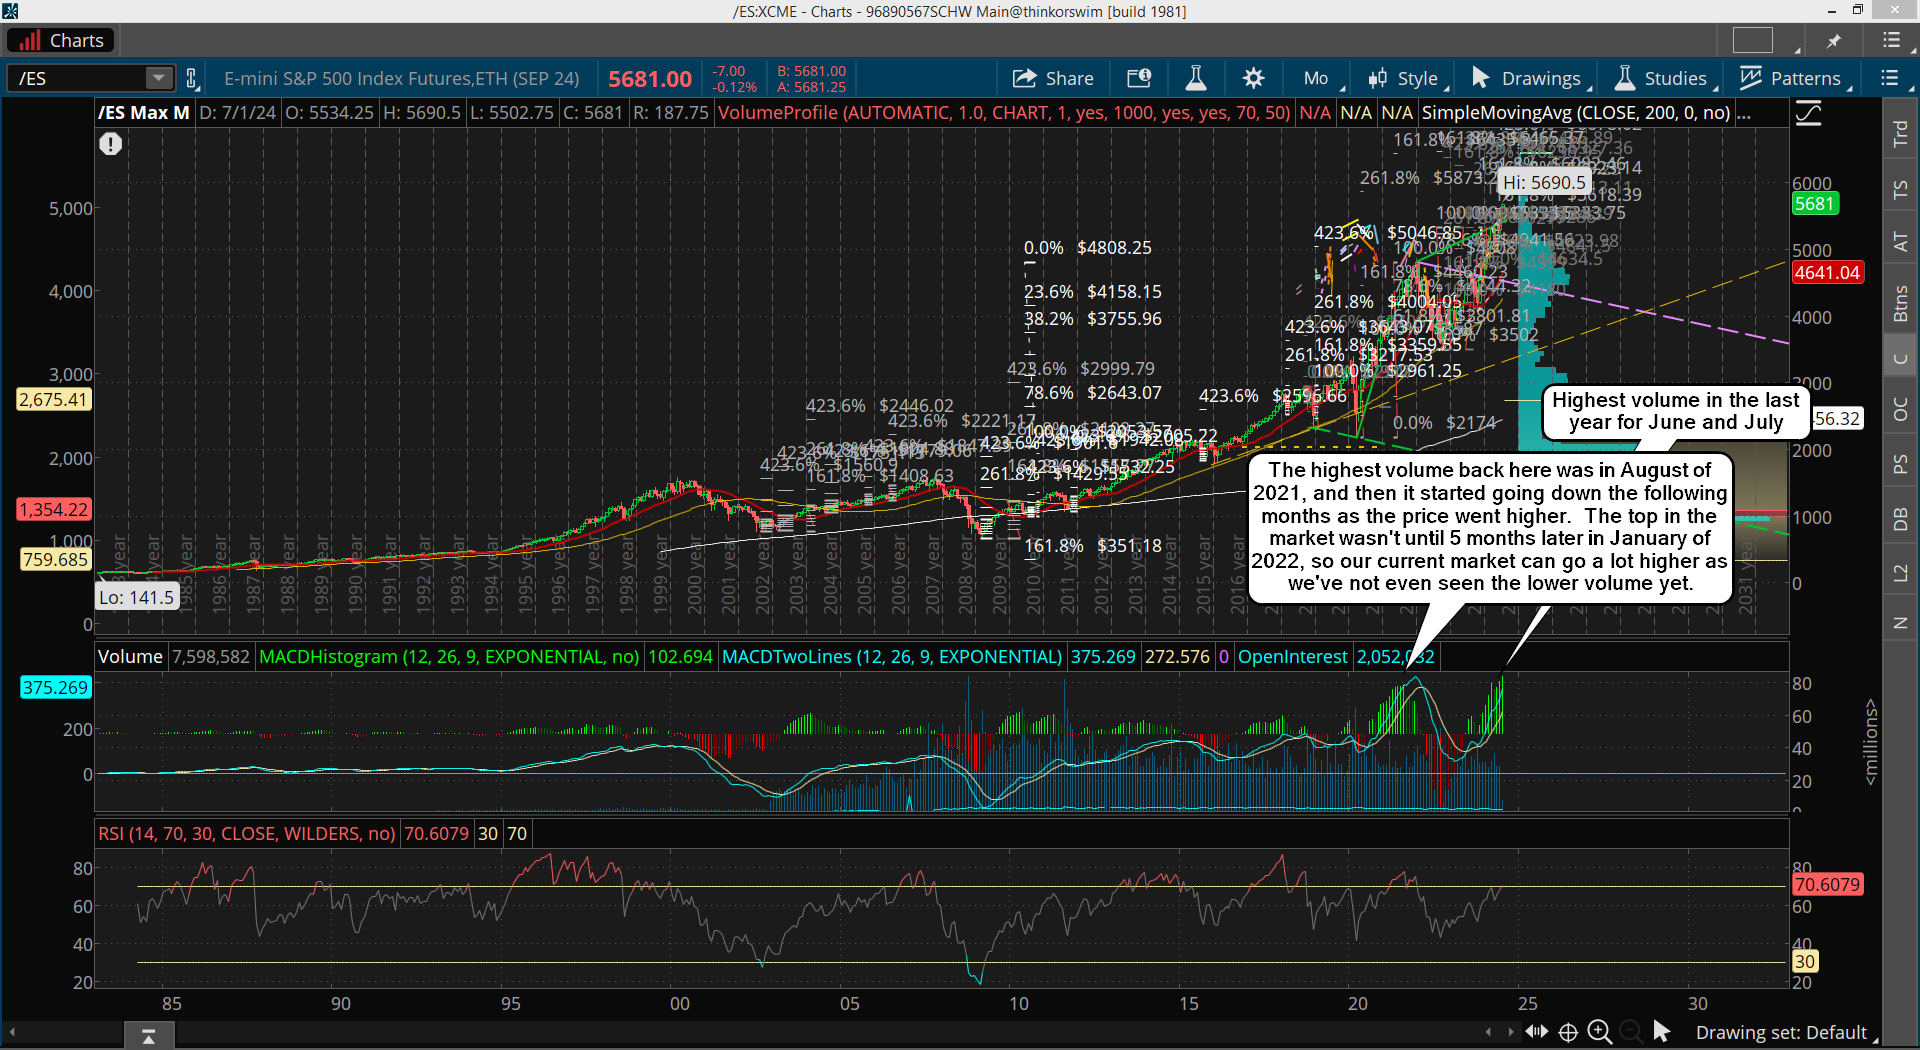
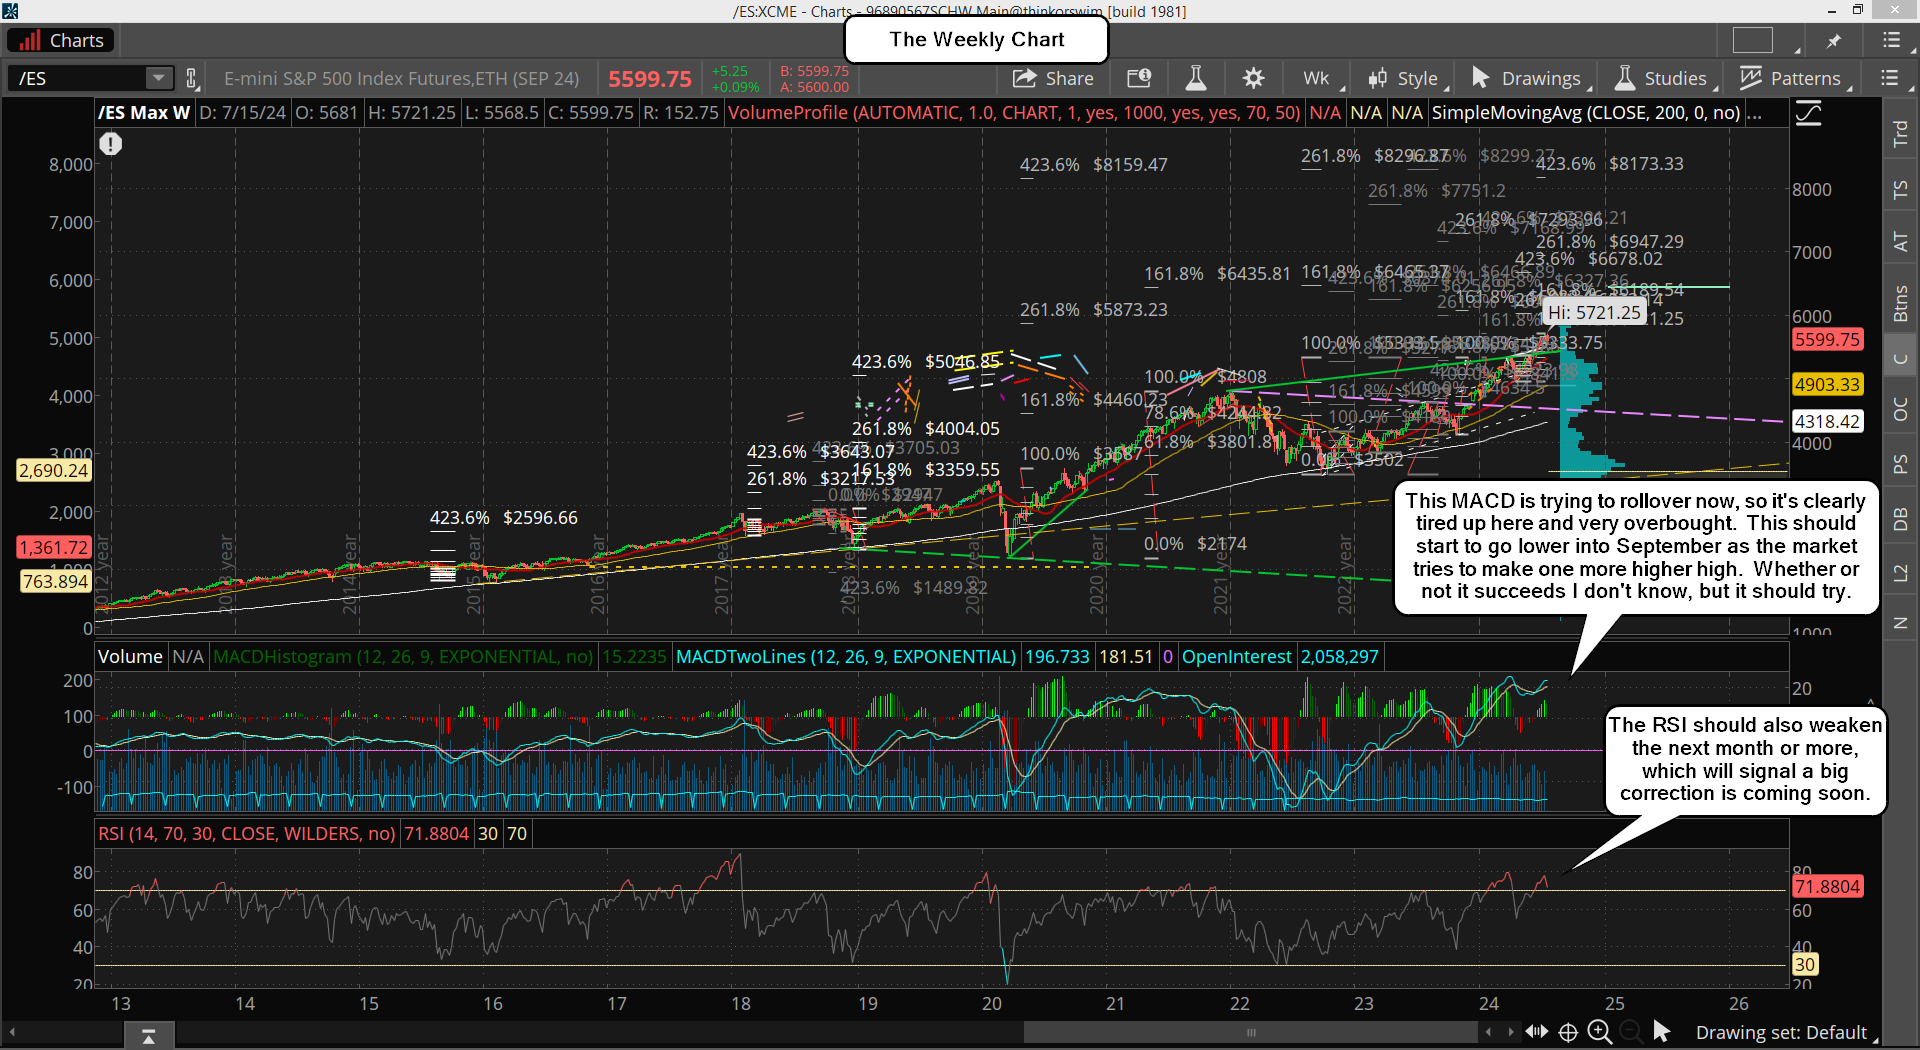
So why do I think it's going to drag out into August (possibly September) you ask? Because the weekly chart is still too high and needs more time to reset, so odds are strong that it will keep putting pressure on the market for many more weeks until it reaches a point where it's reset enough and when the daily get oversold enough. Here's that chart...
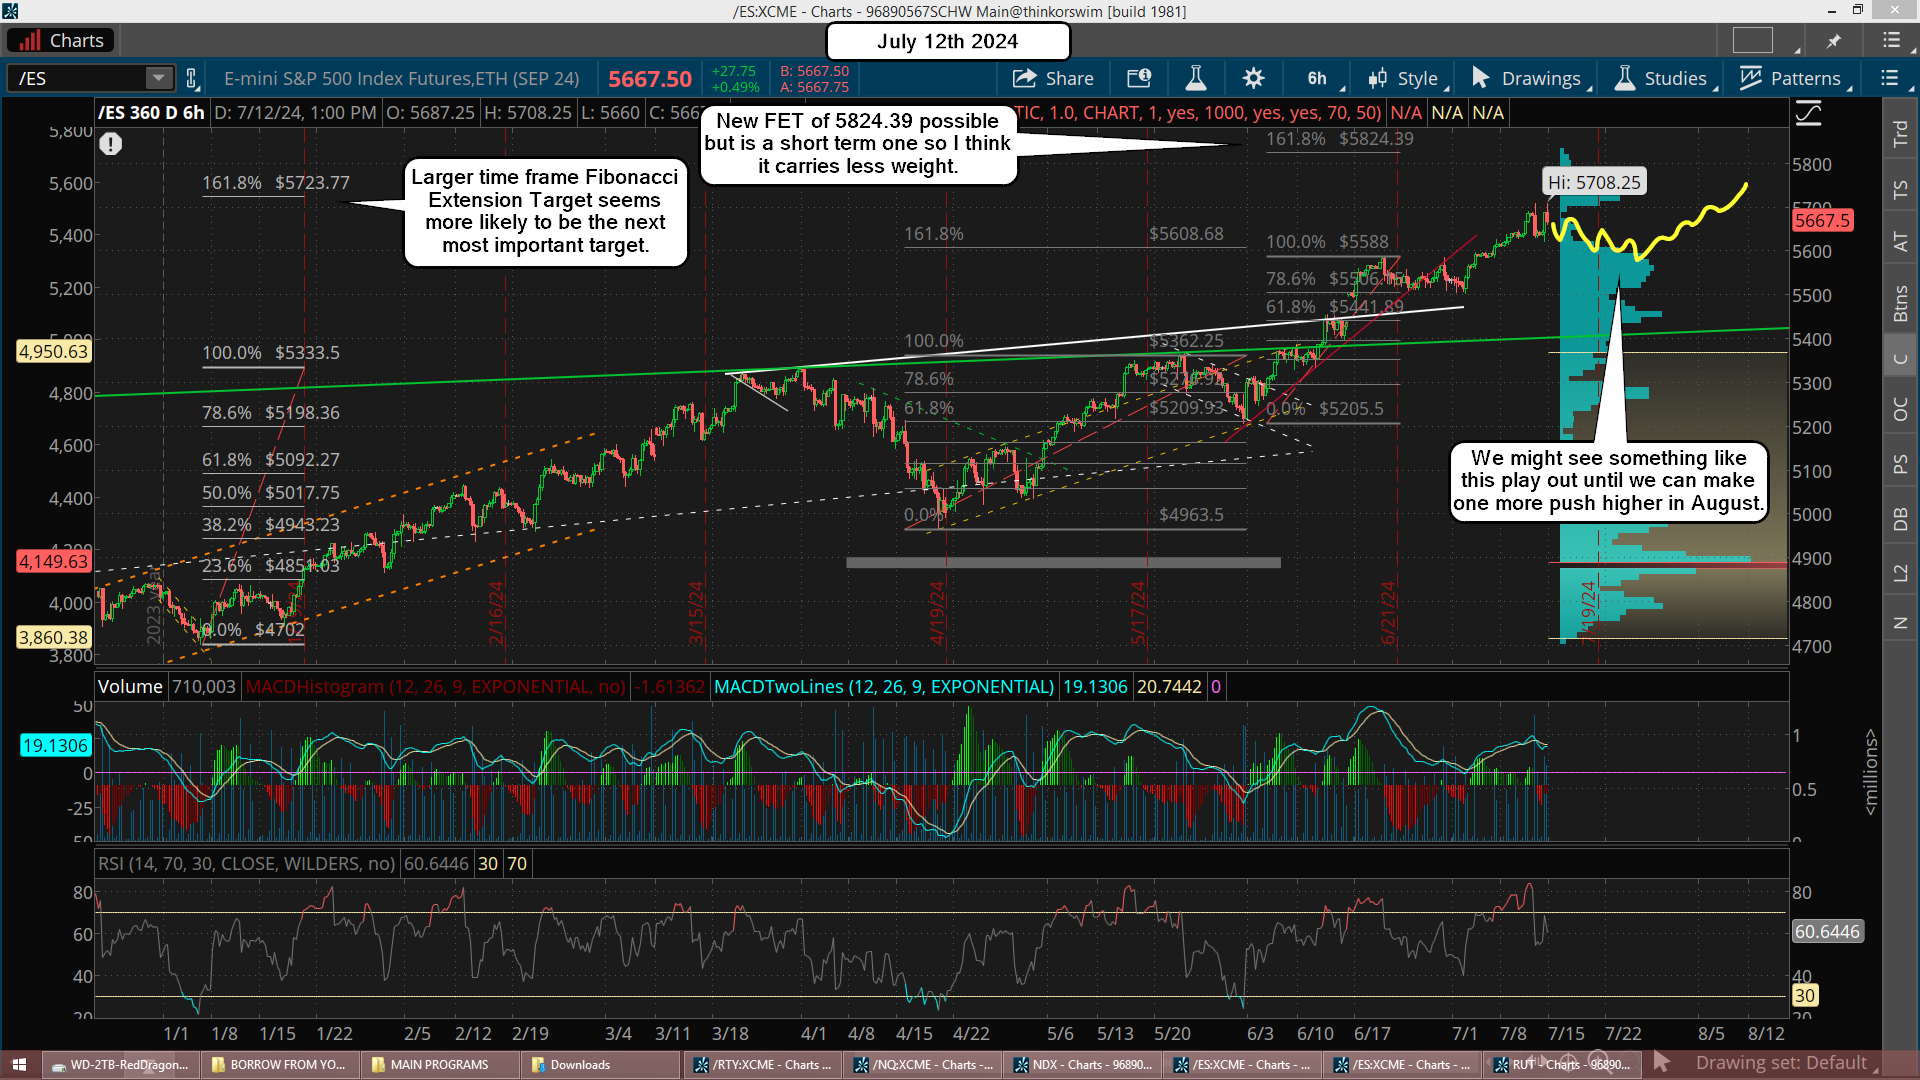
Support is around the 5500 zone from the sideways chop that started on 6/17 and ended on 7/2 before making that last rally up to the current all time high. I think that's where we are headed into next week and that should be where we start B wave up, which I suspect will drag out for several weeks to frustrate bulls and bears both.
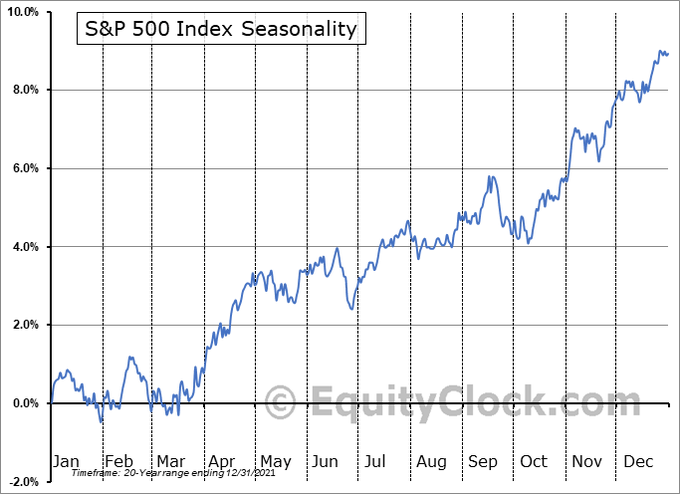
The wild card will be that this pullback (once it ends today or Monday) will complete the move totally and we'll be going up to new higher highs into mid-late August. That could be the plan as an important date of interest in the future is the September 18th FOMC meeting. If we do make a higher high in August then of course the ABC down will have NOT started yet.
Instead we'd likely see the A wave down into late August, early Septermber and a strong B wave up starting right after the September 2nd Labor Day weekend. That move would carry right into the 18th and if we see the Fed do a rate cut (or just say one is coming soon... aka, "tease" the market) we'll then see that C wave down follow.
I would not be surprised to see this wildcard scenario play out as I get the feeling that any rally back up into August, for what could be a B wave, will be shorted heavily and that will force a squeeze to higher highs and kill the B wave completely. So while I don't know if that's going to play out or not I do lean that way.
Have a great weekend.