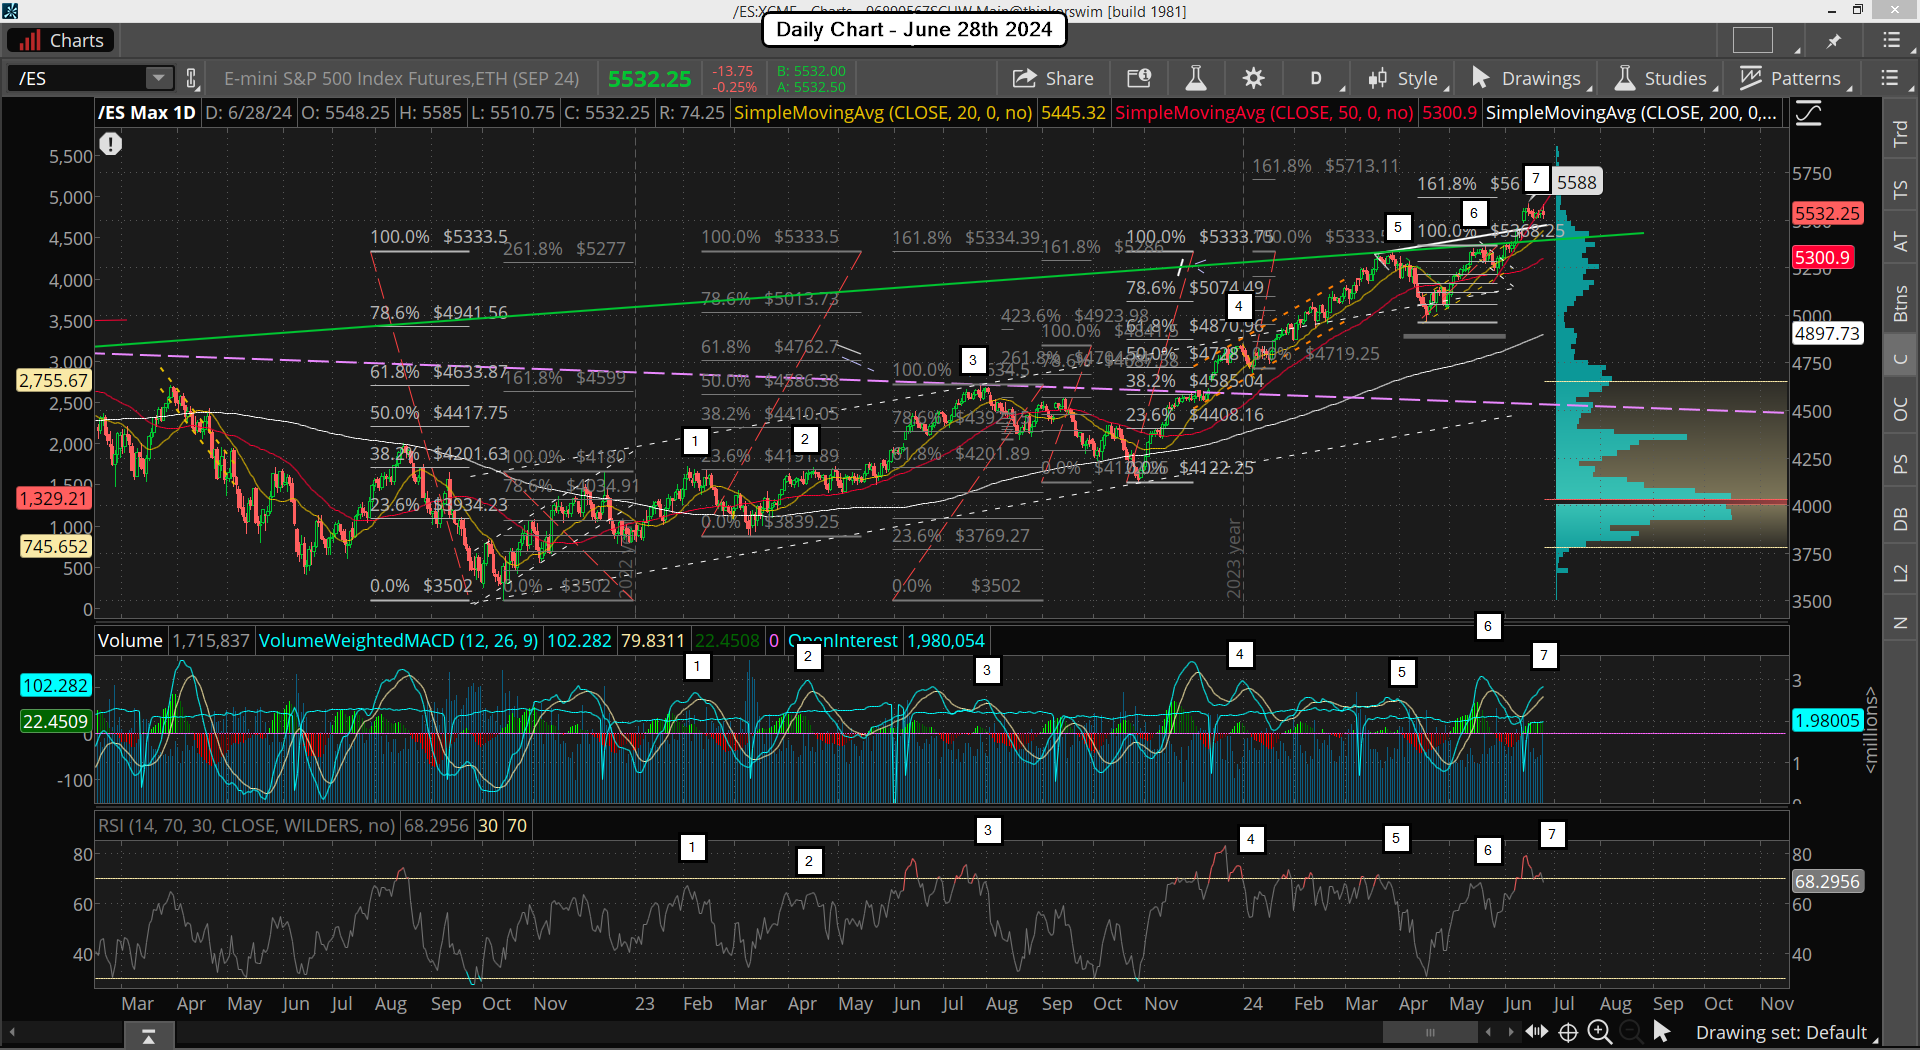
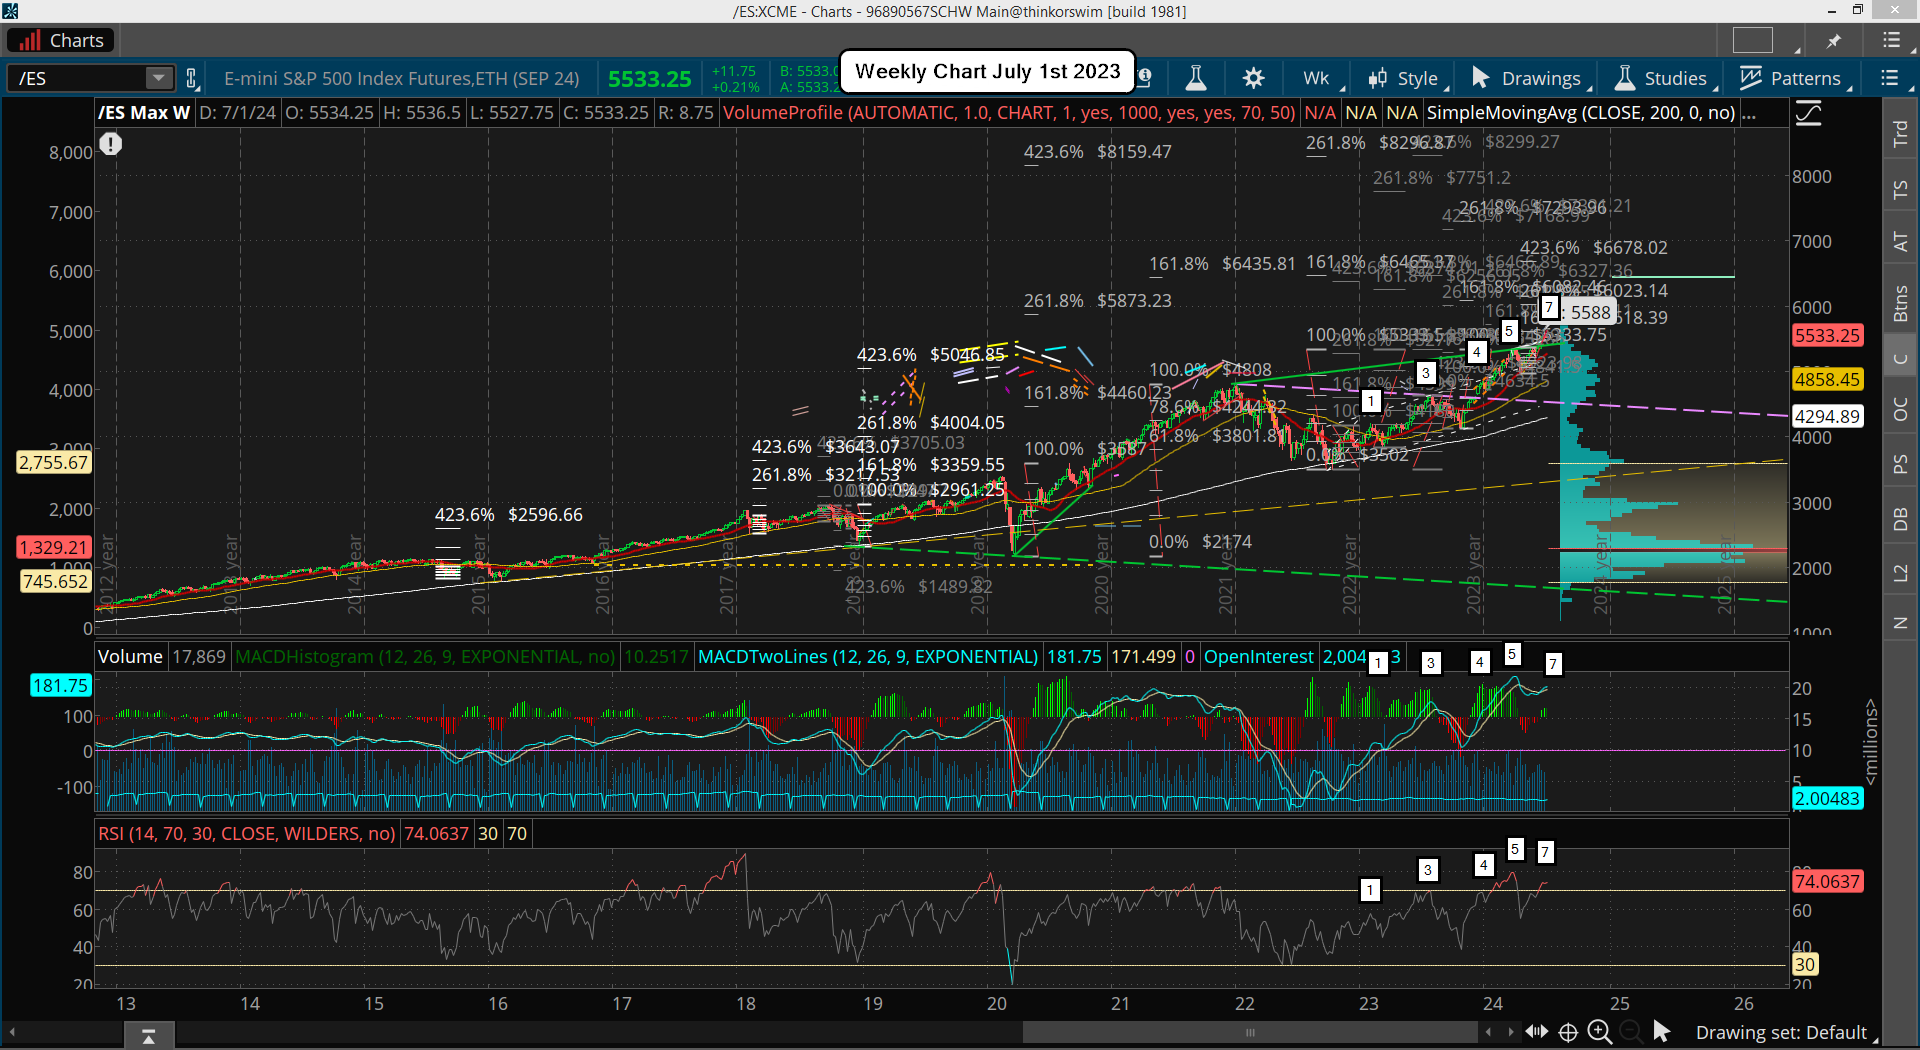
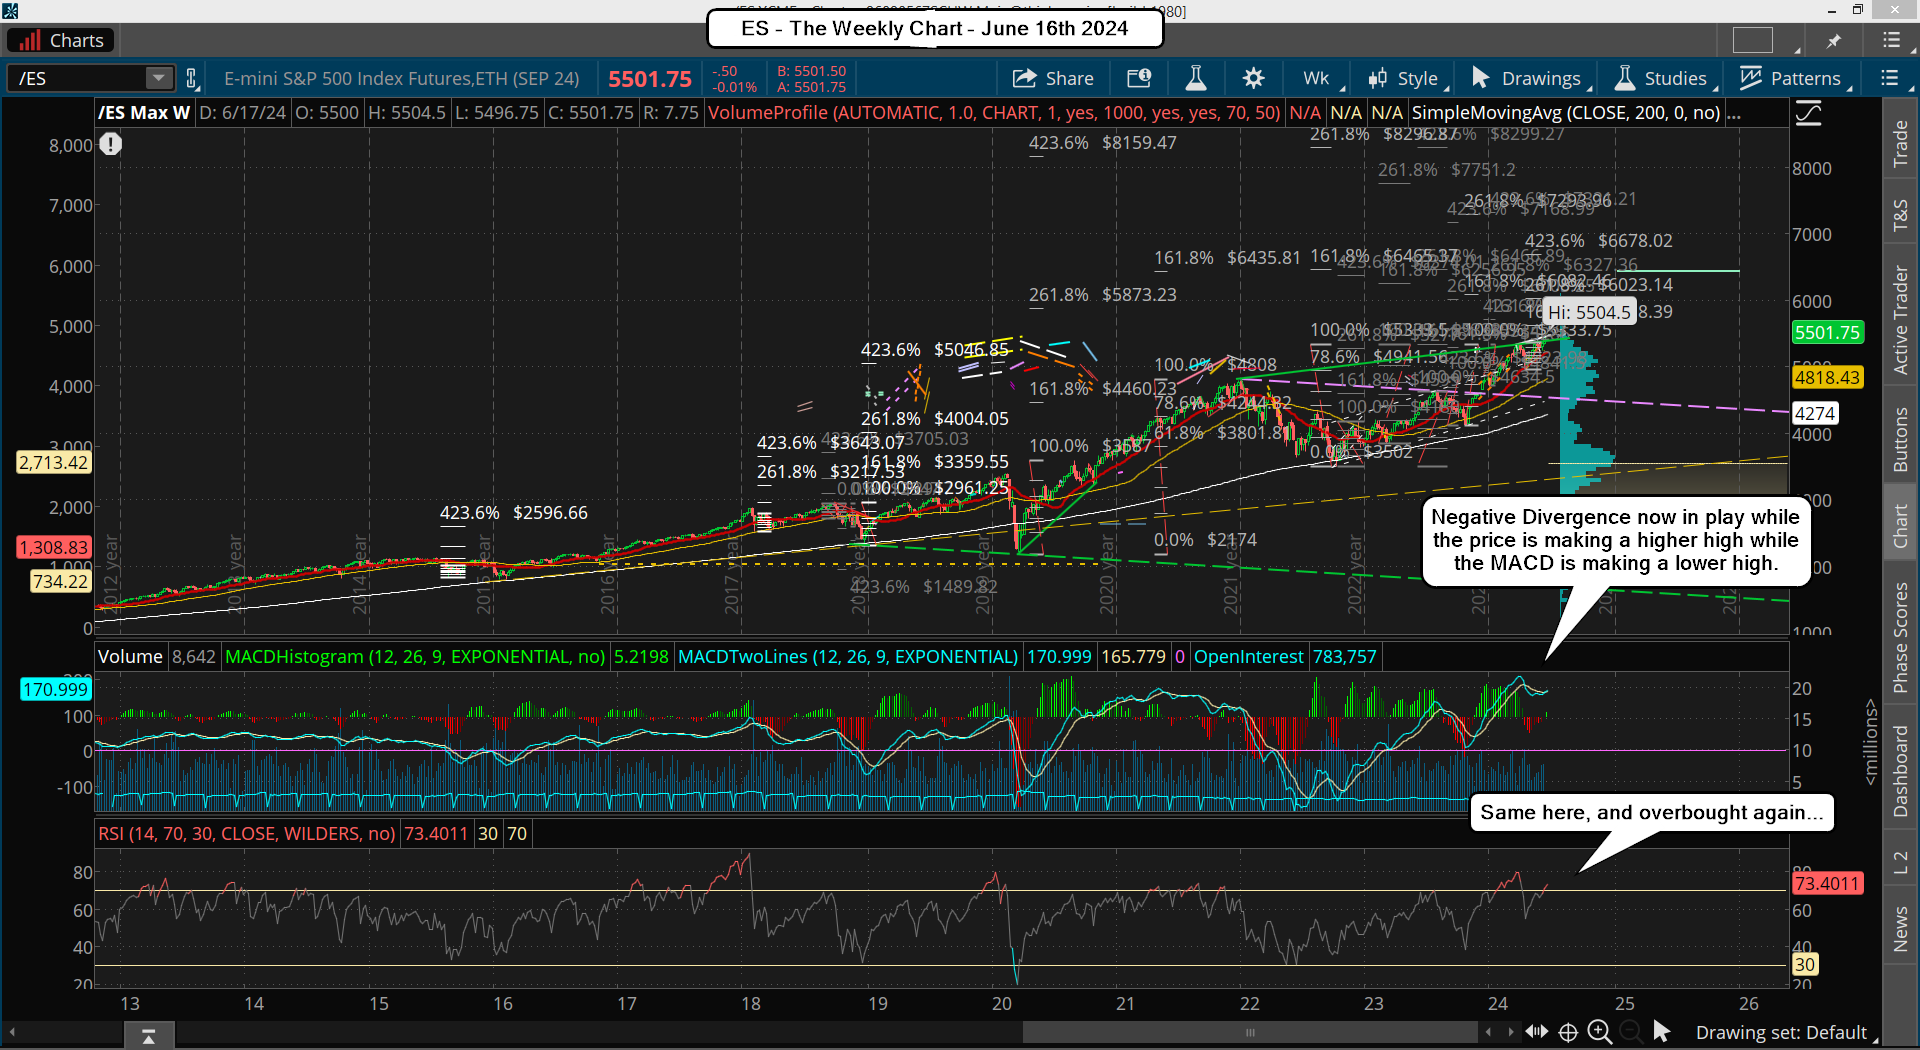
Last Friday was as expected, a nothing day. We did have an early bounce but it didn't hold and we pulled back again and just chopped the rest of the day closing slightly down. This is the last week of the June and as I said previously "turns" commonly happen around the end or beginning of every month. The technicals are overbought pretty much everywhere, from the weekly, daily and down to the 6hr chart.
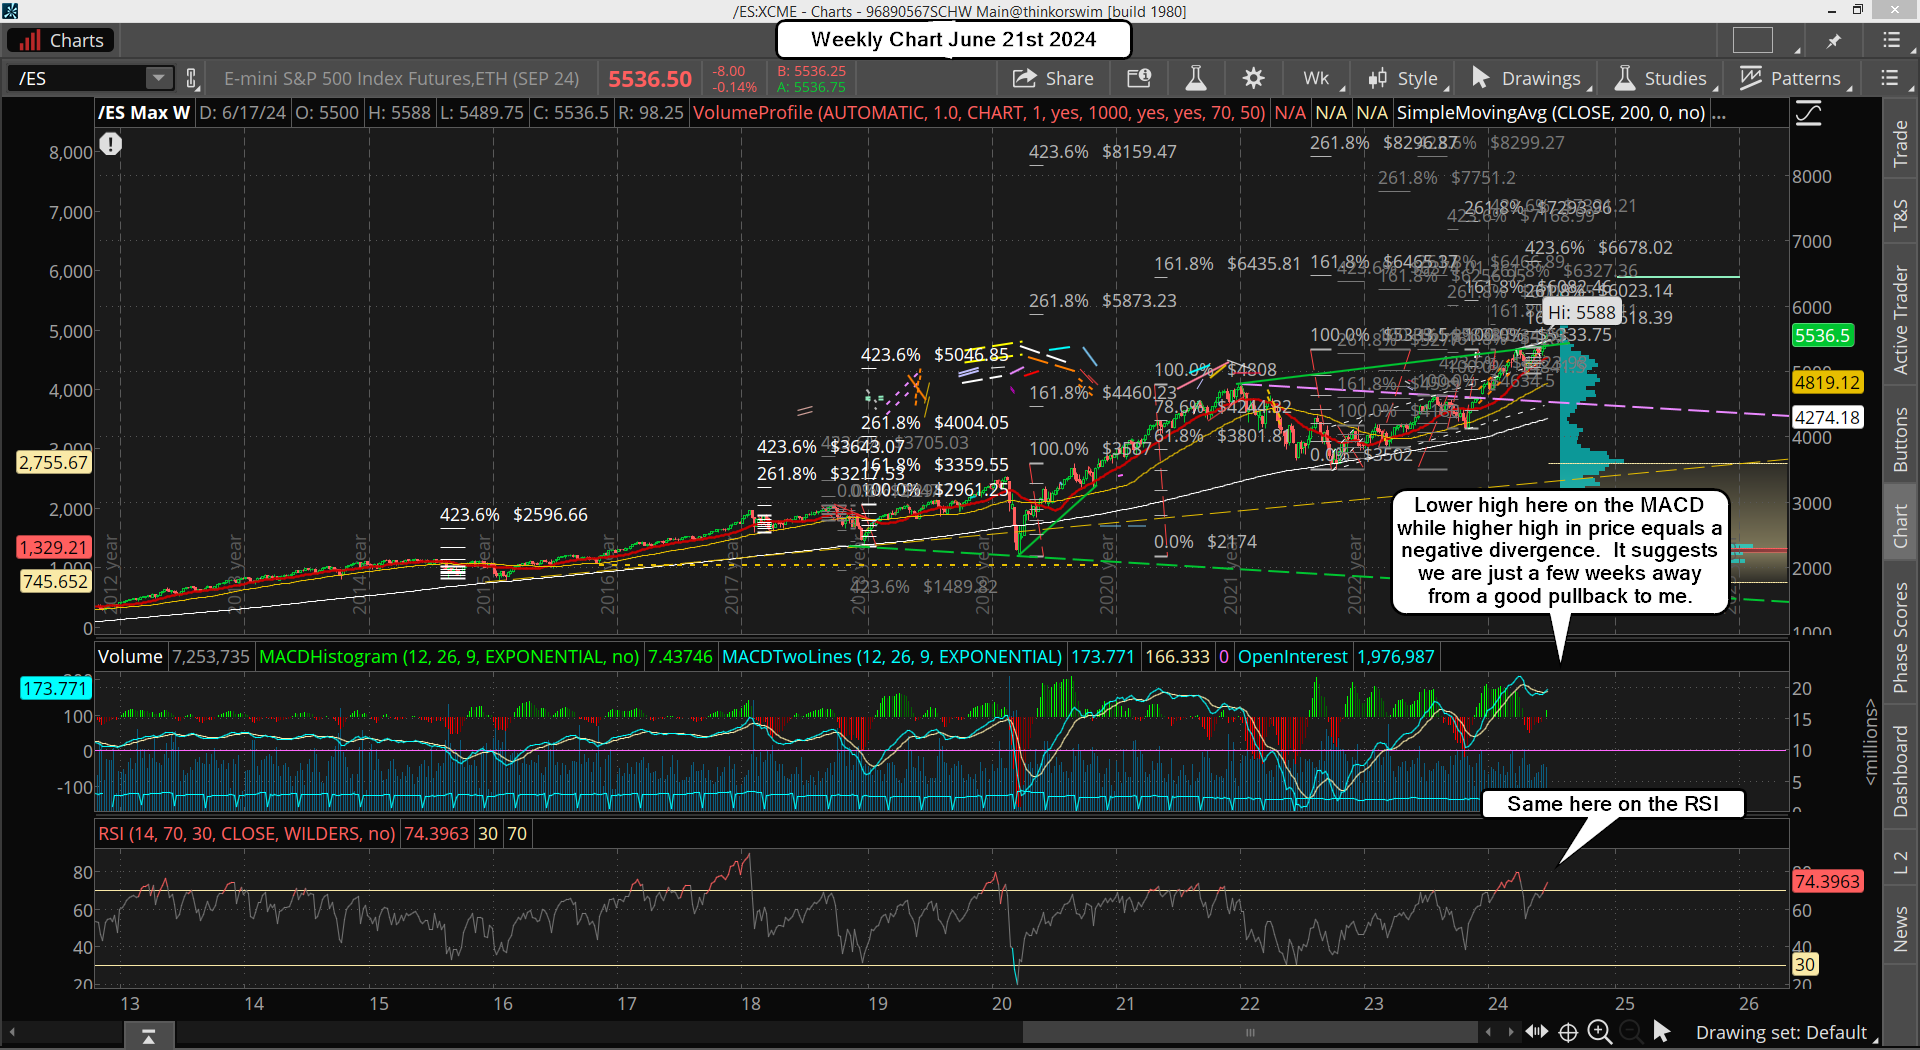
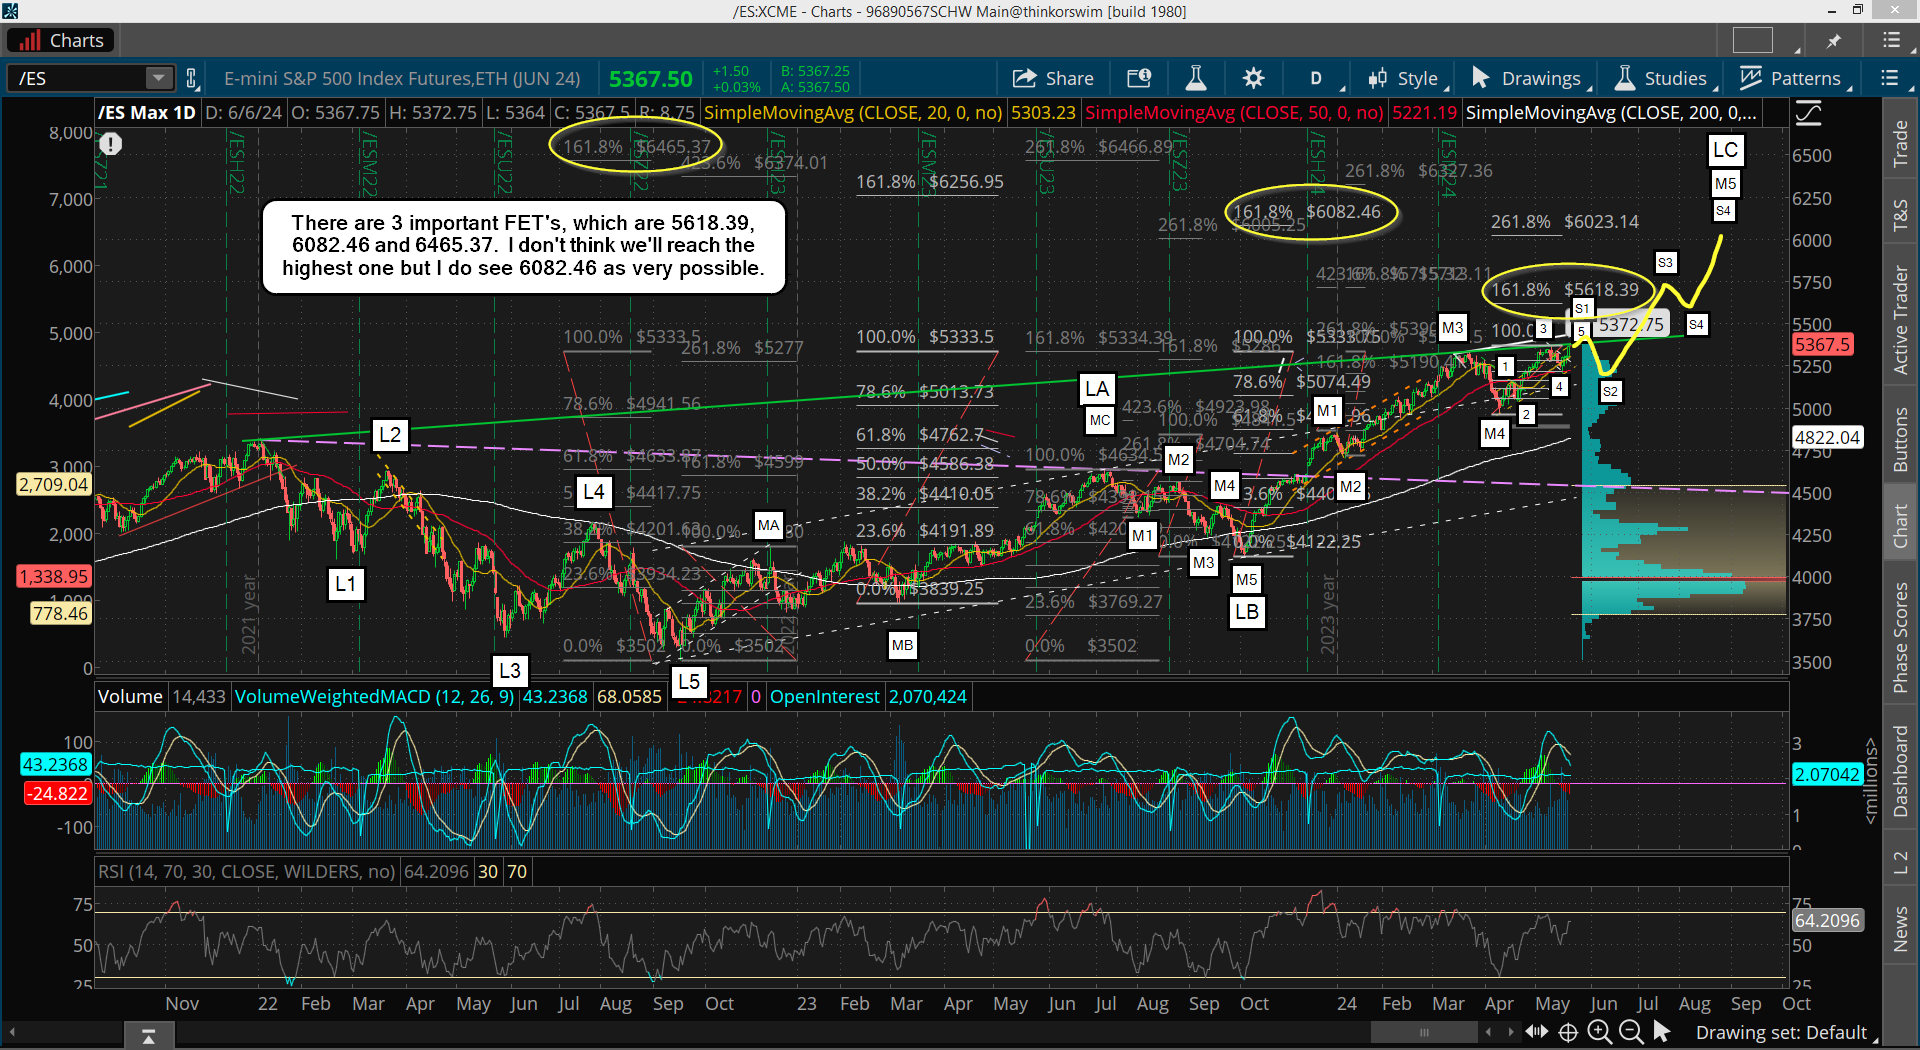
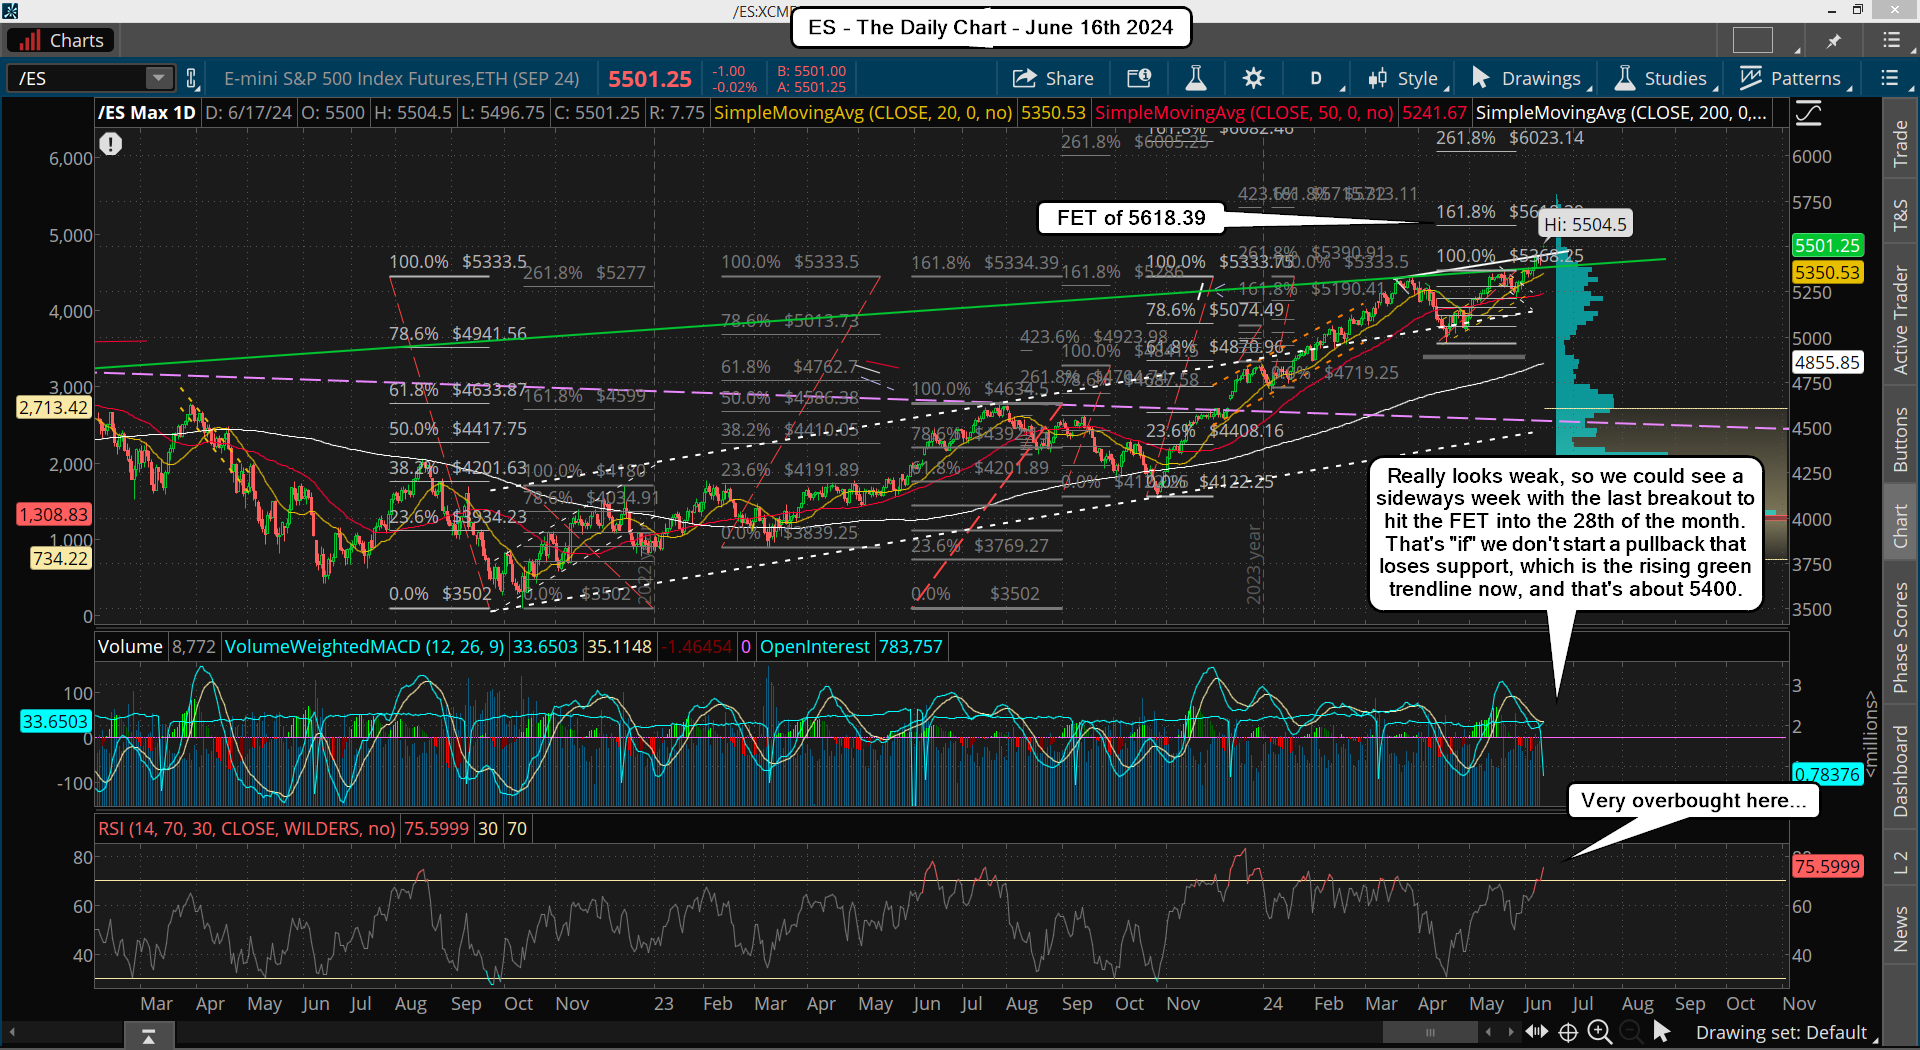
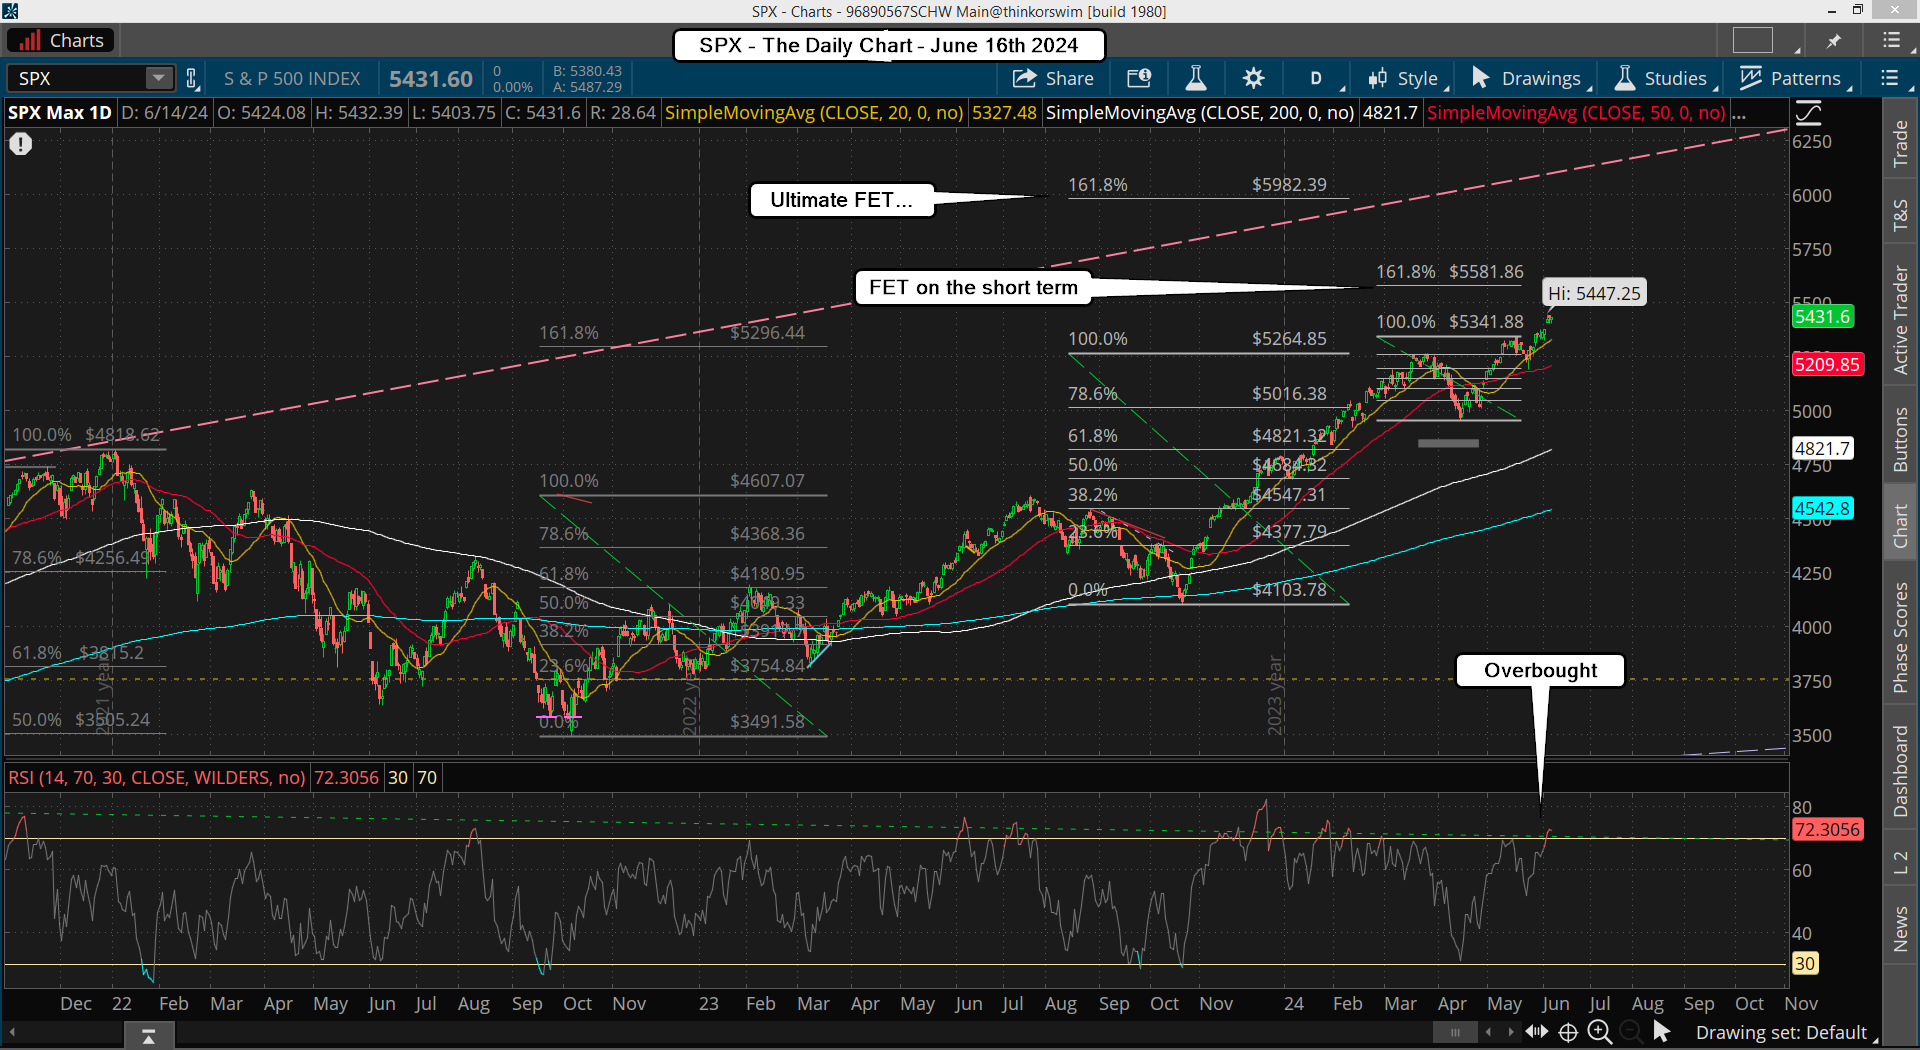
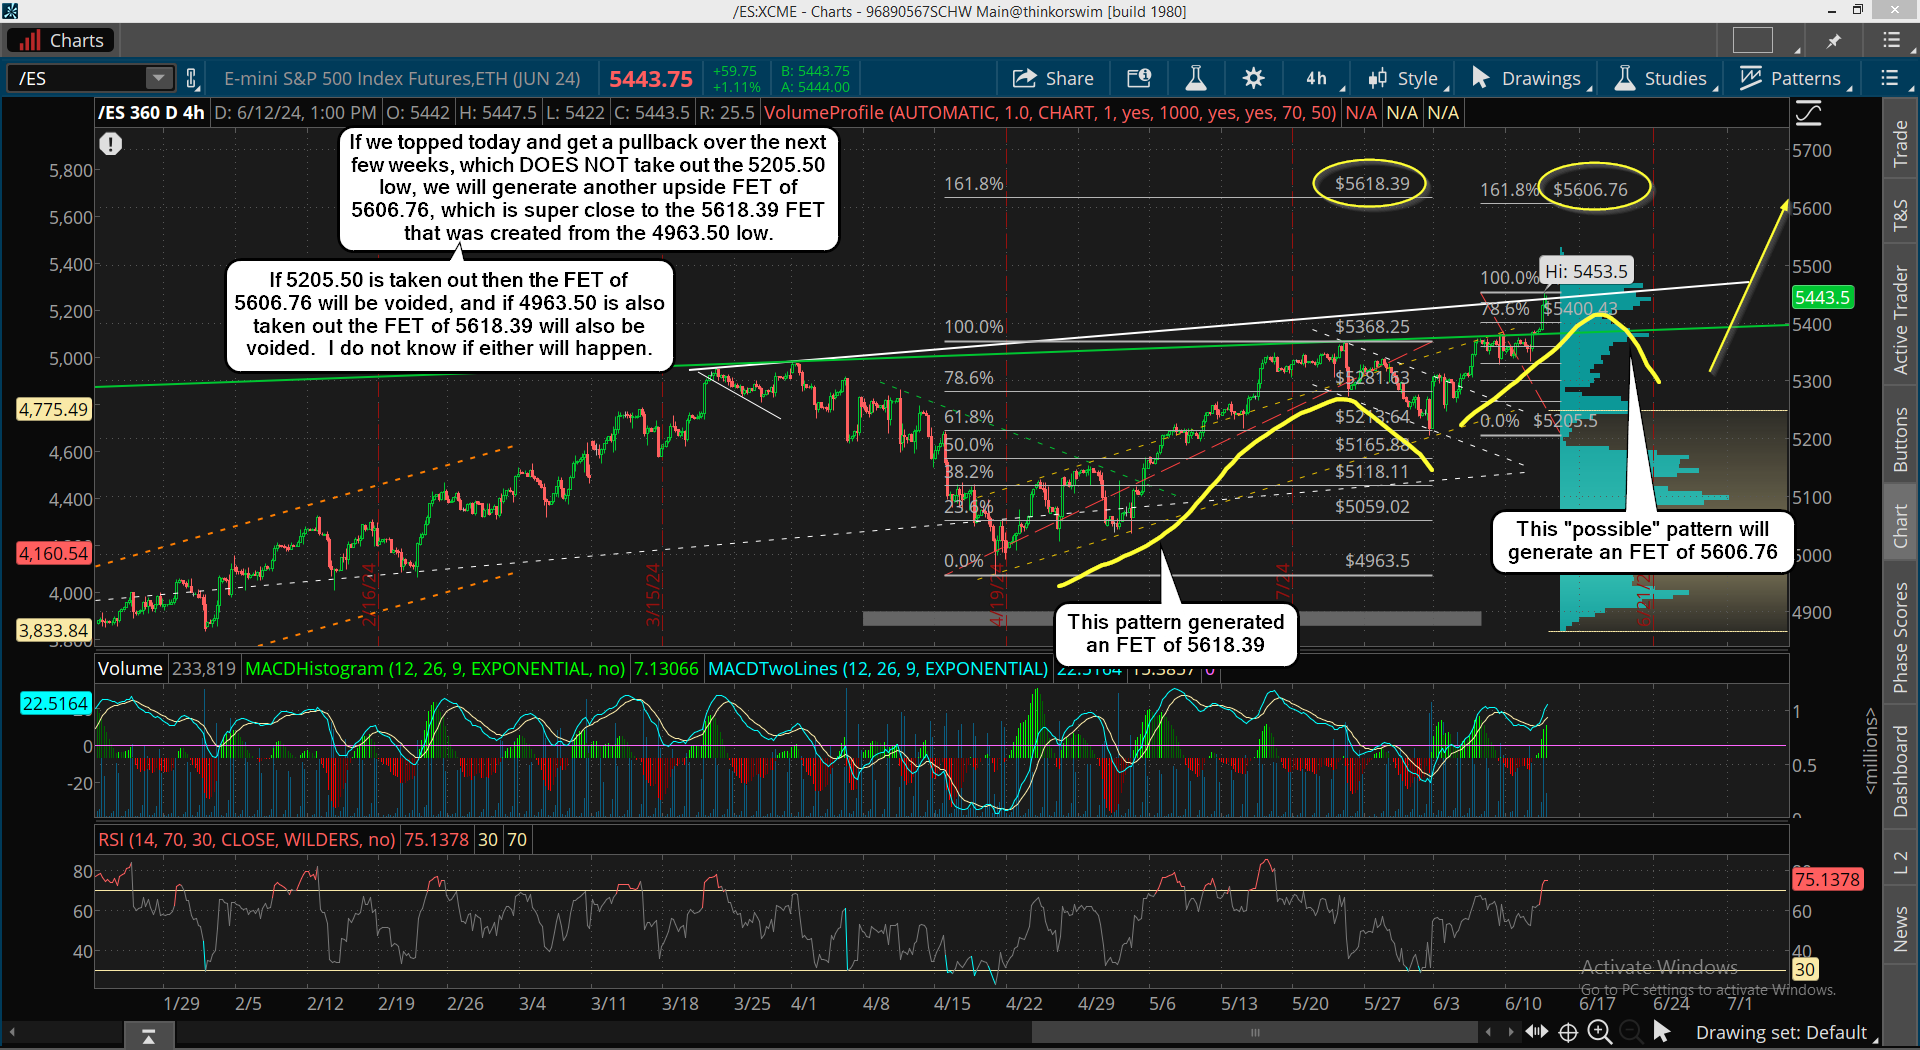
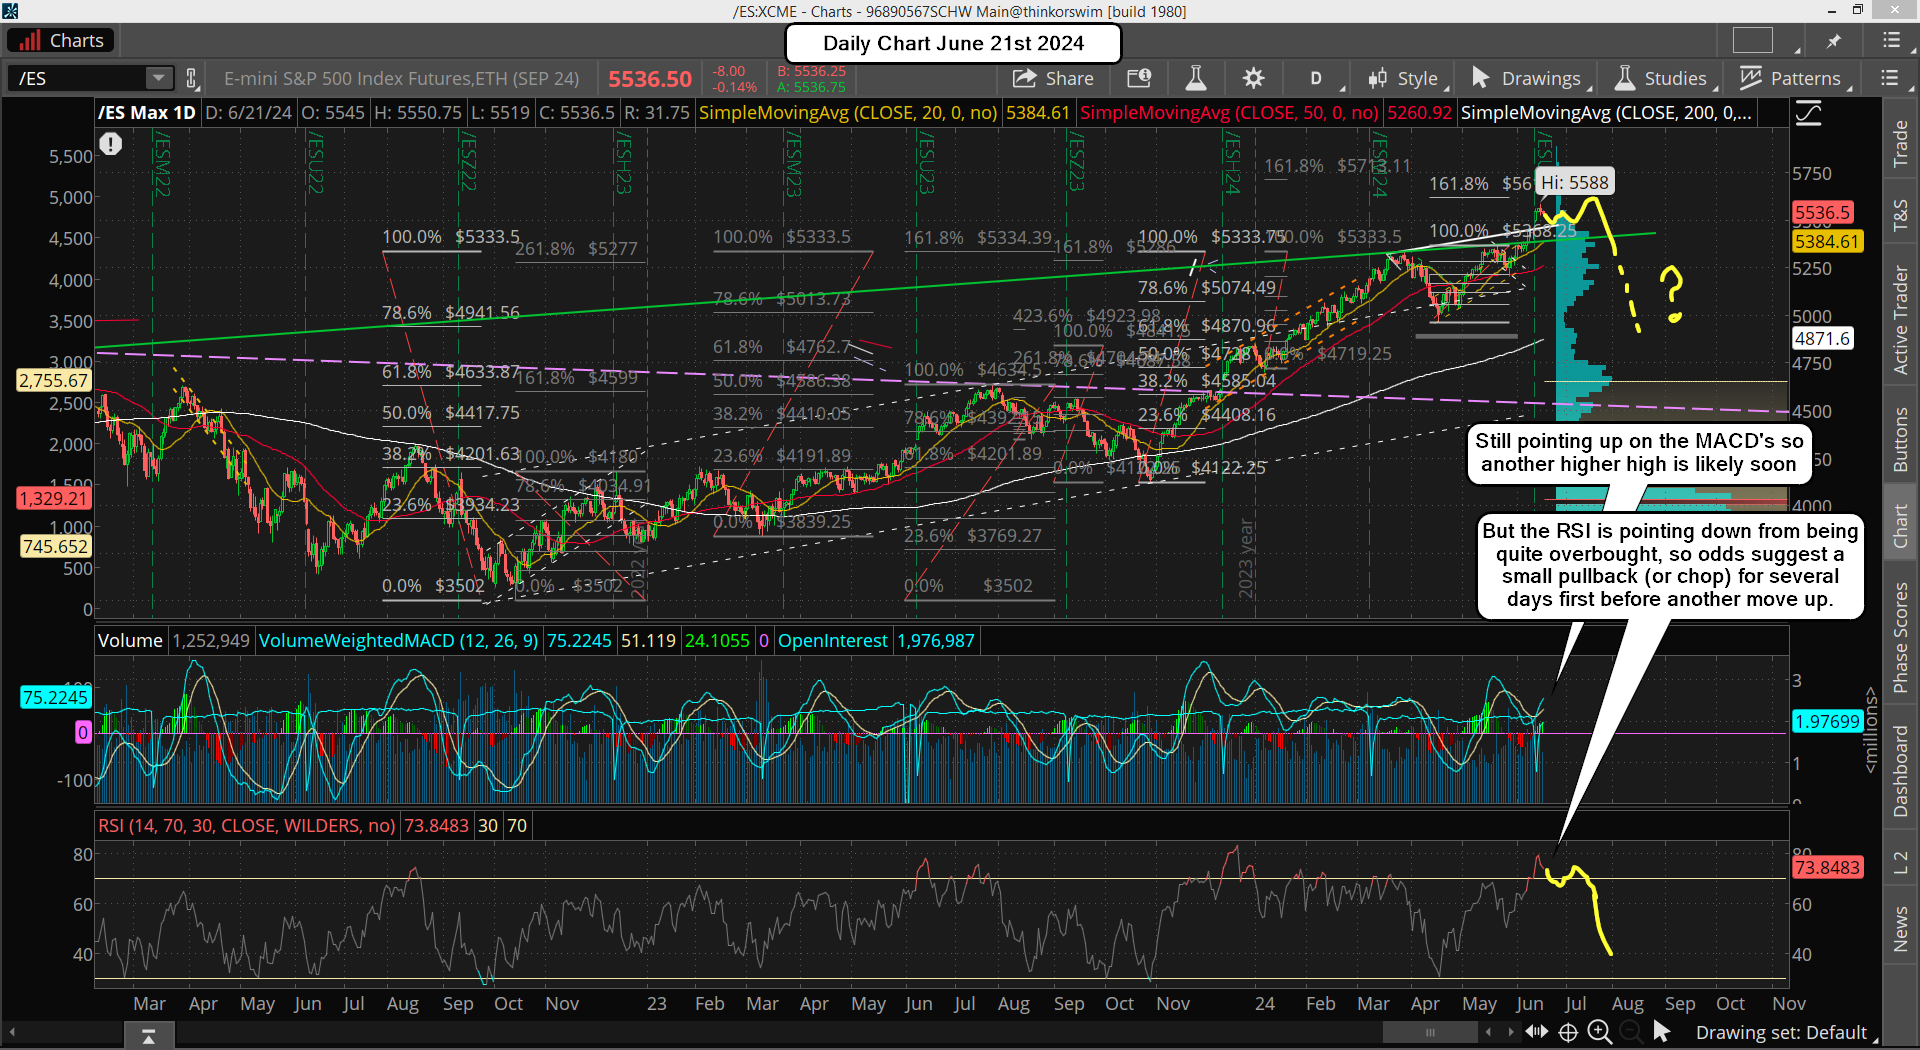
But the time frames less then 6hr could get oversold early this week and allow for one more push up into the end of the month to hit the FET of 5618, which I think still has pretty good odds of it being reached. If this happens then the "turn" will be a move down of course, whereas if instead we pullback then the turn will be up... and this really feels like a lower odds forecast as I just think we are so close to the FET, and the bigger time frames are so overbought, that a significant pullback is coming. Not a 1,2 or even 3 percent move, but a possible 10% move, which should last for a few week I'd think so that the weekly chart can reset from being so overbought.
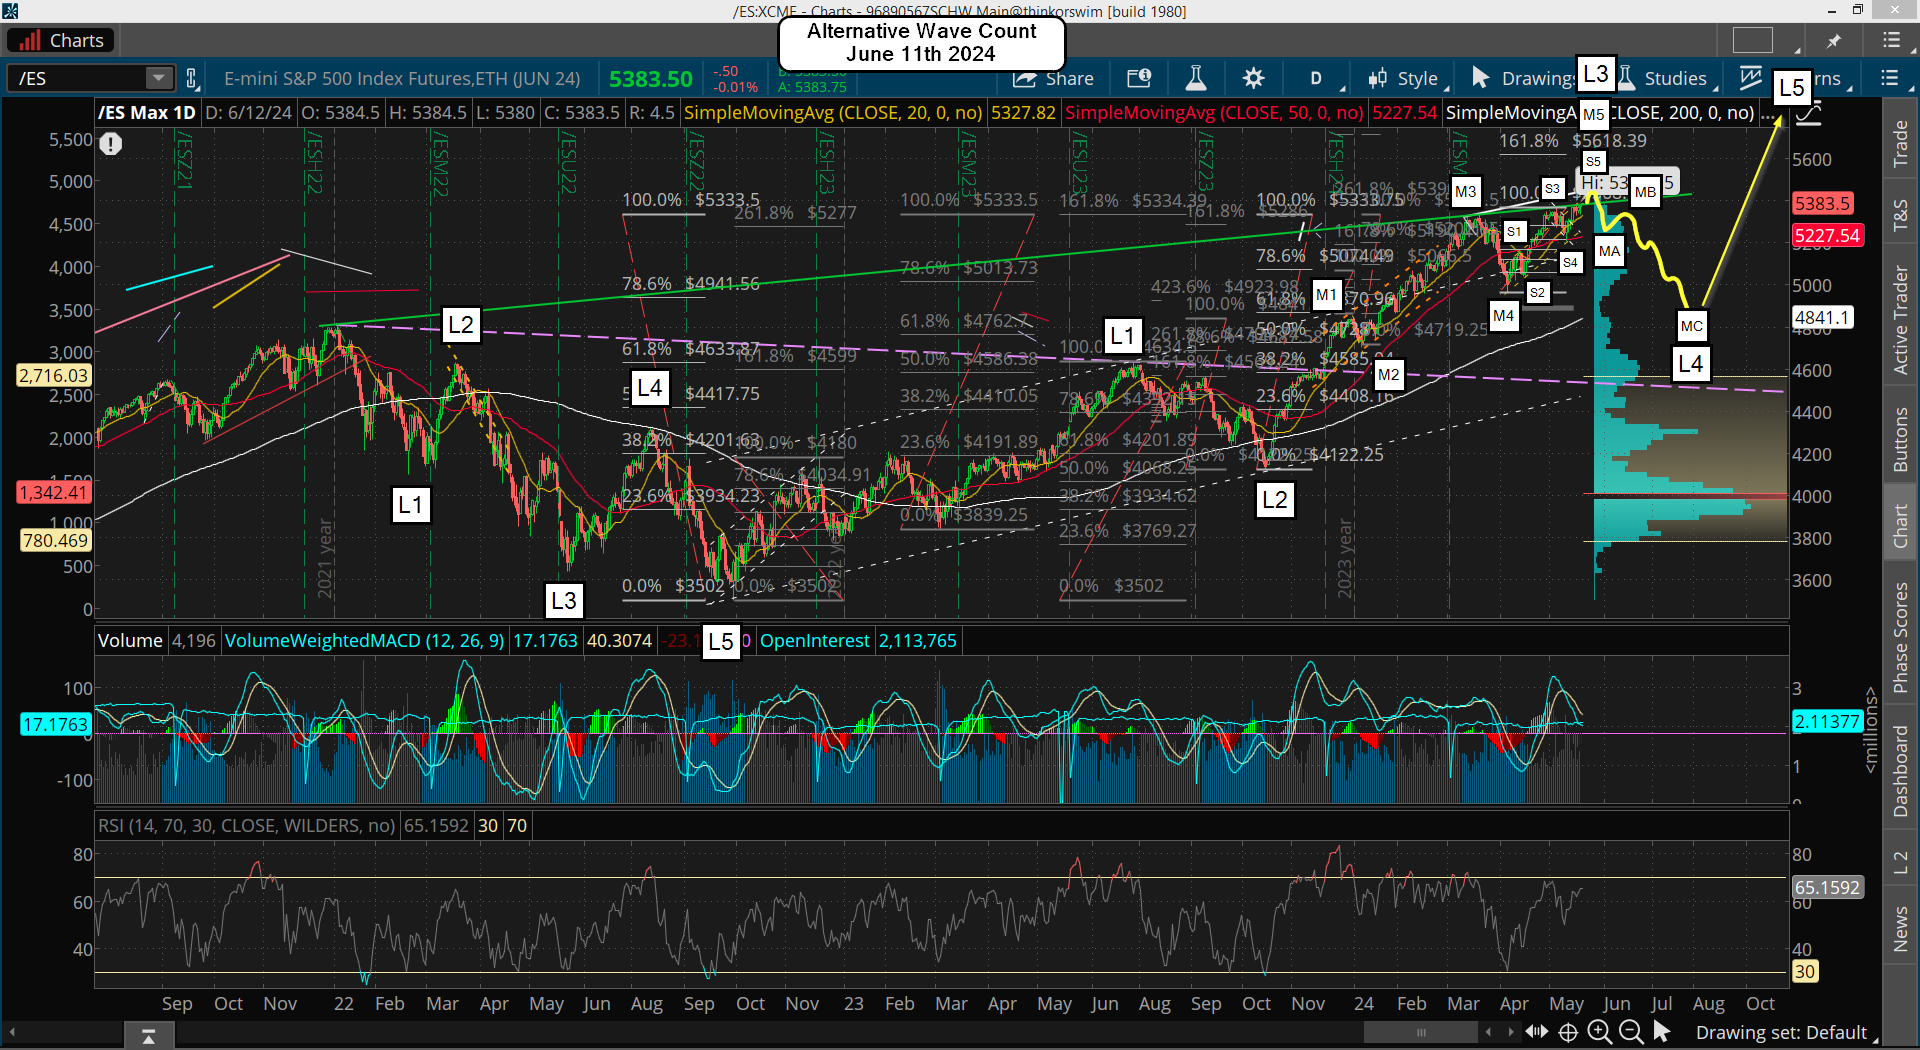
As far as "what" could spark the big move down I point to the CPI on July 11th as a possible one, and that's also the date President Trump gets his sentence about whether or not he goes to jail for being a patriot convicted of 34 felonys with no actual charges. Yes, we now live in a communism country, and if we pullback early July, (an A wave?) and bounce into the 11th (a B wave?), we could have a nasty drop follow that opens the door again for the FP on the SPY from the Yahoo site as a possible target again.
The 11th of July will be an important date for sure, and normally we pullback some in front of important dates due to the "unknown" factor, as most traders want to be less exposed. This could take the form of an A wave down and B wave up, or maybe do the entire ABC in front of it and bottom into it? I doubt that happens but anything is possible I guess. We could also top into the date but again, there's low odds of that happening in my opinion. Most likely we top this week or early next week around my FET and then start down into the 11th with a possible one or two day squeeze for the B wave in front of (or after) that important date.
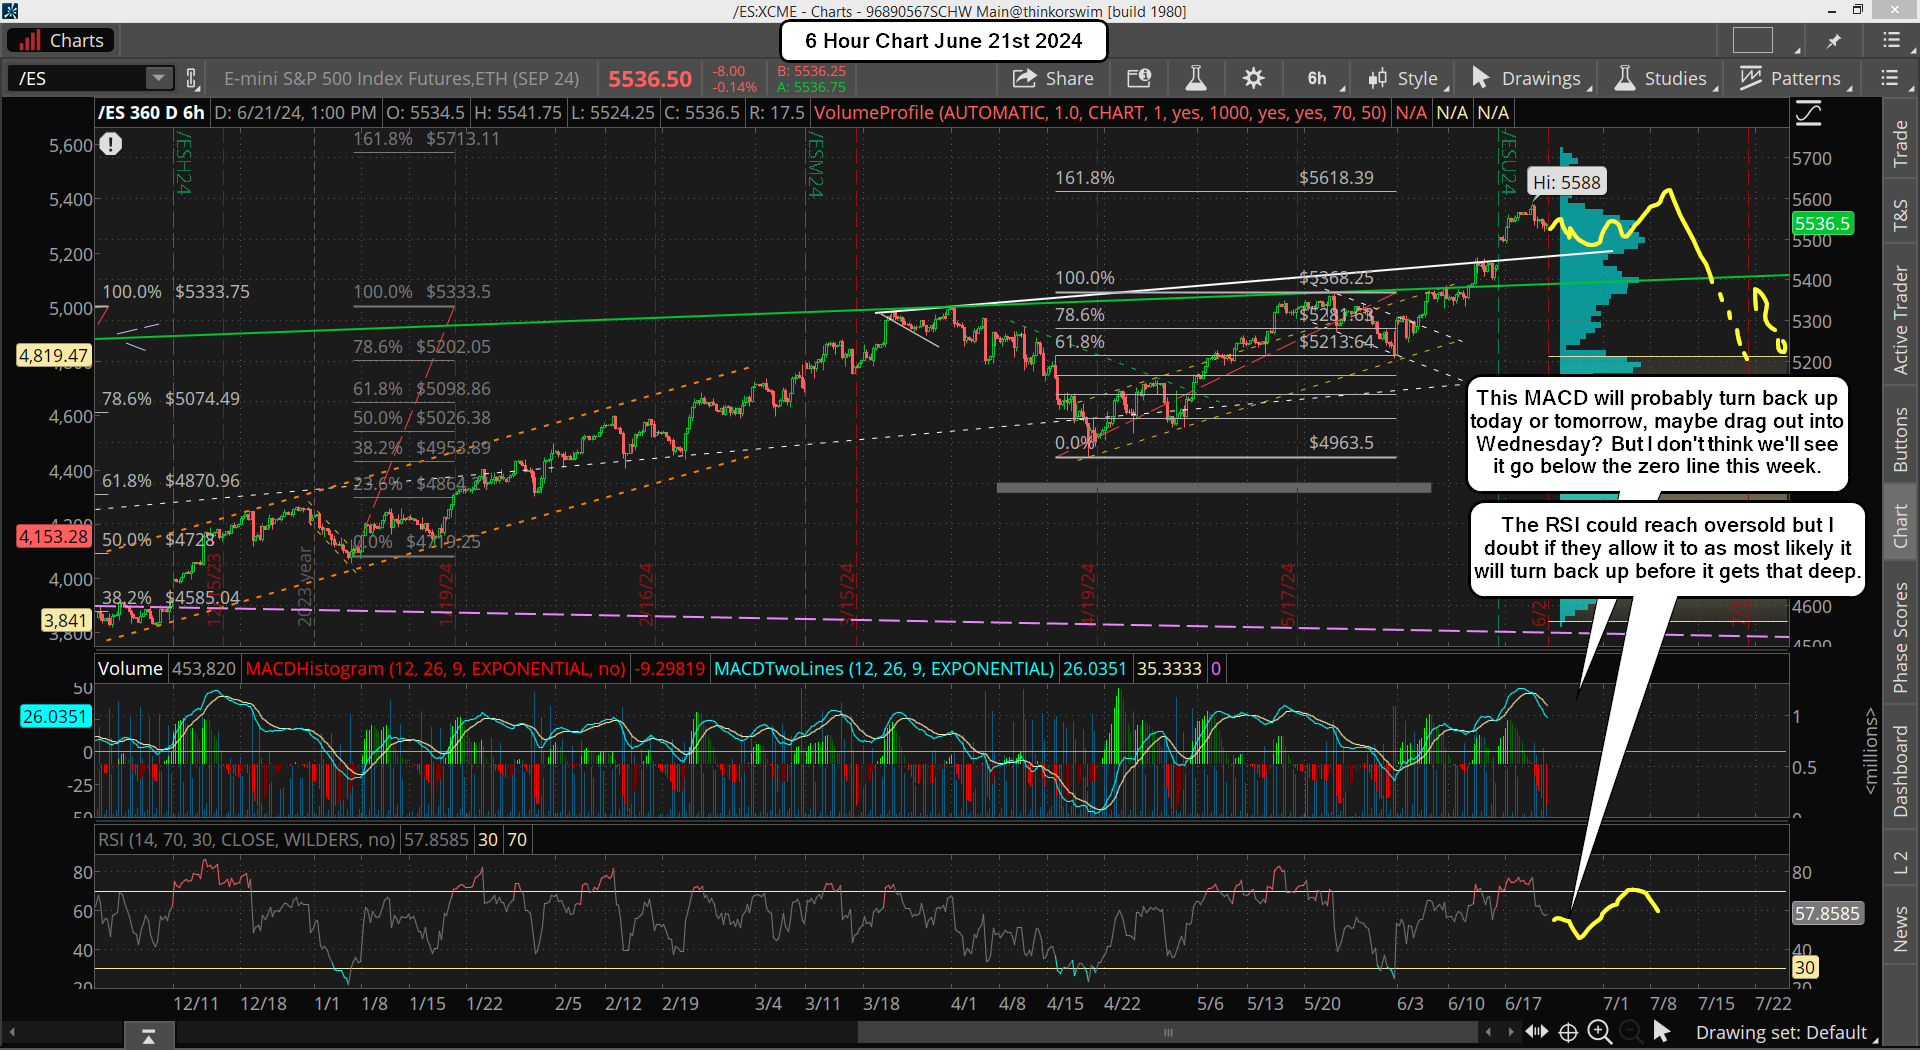
For the short term I think we pullback to find support around the rising white trendline, which is about 5500 or so on the ES, then bounce and possibly do one more trip down to test it again (might pierce it?) before we rally back up for the move to hit by FET at 5618, which again... could be hit by the end of this week, or early next week.
Have a blessed day.