
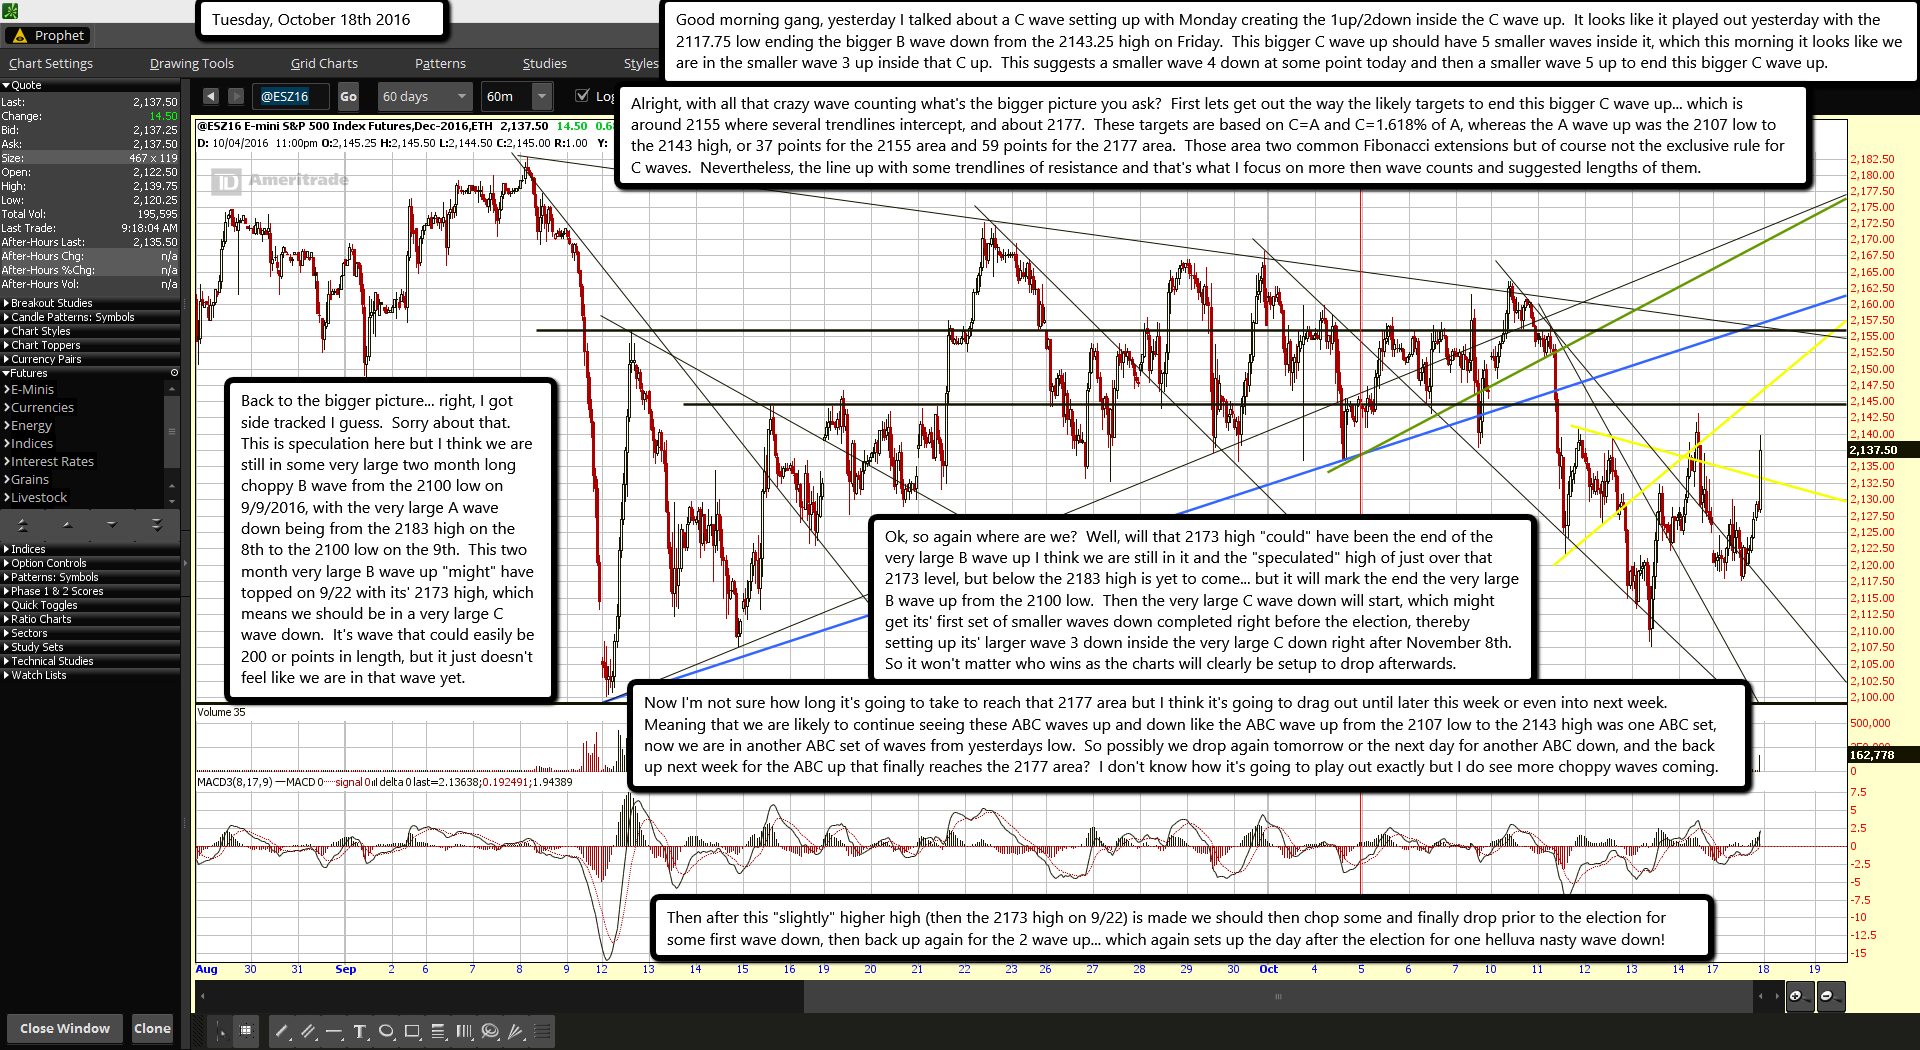
Good morning gang, yesterday I talked about a C wave setting up with Monday creating the 1up/2down inside the C wave up. It looks like it played out yesterday with the 2117.75 low ending the bigger B wave down from the 2143.25 high on Friday. This bigger C wave up should have 5 smaller waves inside it, which this morning it looks like we are in the smaller wave 3 up inside that C up. This suggests a smaller wave 4 down at some point today and then a smaller wave 5 up to end this bigger C wave up.
Alright, with all that crazy wave counting what's the bigger picture you ask? First lets get out the way the likely targets to end this bigger C wave up... which is around 2155 where several trendlines intercept, and about 2177. These targets are based on C=A and C=1.618% of A, whereas the A wave up was the 2107 low to the 2143 high, or 37 points for the 2155 area and 59 points for the 2177 area. Those area two common Fibonacci extensions but of course not the exclusive rule for C waves. Nevertheless, the line up with some trendlines of resistance and that's what I focus on more then wave counts and suggested lengths of them.
Back to the bigger picture... right, I got side tracked I guess. Sorry about that. This is speculation here but I think we are still in some very large two month long choppy B wave from the 2100 low on 9/9/2016, with the very large A wave down being from the 2183 high on the 8th to the 2100 low on the 9th. This two month very large B wave up "might" have topped on 9/22 with its' 2173 high, which means we should be in a very large C wave down. It's wave that could easily be 200 or points in length, but it just doesn't feel like we are in that wave yet.
Ok, so again where are we? Well, will that 2173 high "could" have been the end of the very large B wave up I think we are still in it and the "speculated" high of just over that 2173 level, but below the 2183 high is yet to come... but it will mark the end the very large B wave up from the 2100 low. Then the very large C wave down will start, which might get its' first set of smaller waves down completed right before the election, thereby setting up its' larger wave 3 down inside the very large C down right after November 8th. So it won't matter who wins as the charts will clearly be setup to drop afterwards.
Now I'm not sure how long it's going to take to reach that 2177 area but I think it's going to drag out until later this week or even into next week. Meaning that we are likely to continue seeing these ABC waves up and down like the ABC wave up from the 2107 low to the 2143 high was one ABC set, now we are in another ABC set of waves from yesterdays low. So possibly we drop again tomorrow or the next day for another ABC down, and the back up next week for the ABC up that finally reaches the 2177 area? I don't know how it's going to play out exactly but I do see more choppy waves coming.
Then after this "slightly" higher high (then the 2173 high on 9/22) is made we should then chop some and finally drop prior to the election for some first wave down, then back up again for the 2 wave up... which again sets up the day after the election for one helluva nasty wave down!
Final note for those that went long yesterday... don't be greedy. Take profits as I don't know for certain that this opening gap up will have a smaller wave 4 down and smaller wave 5 up later today. It might only be another ABC pattern move instead of a 5 wave move? So be smart.

