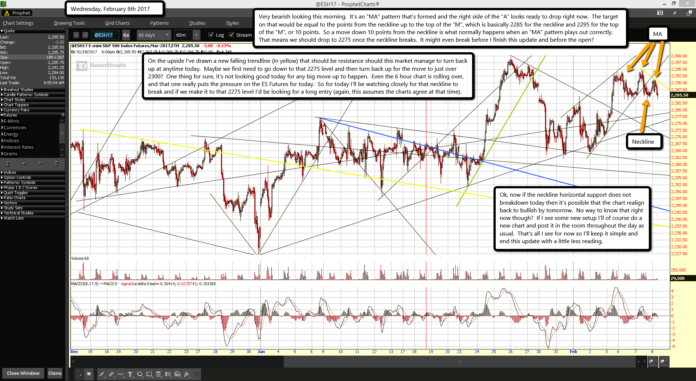
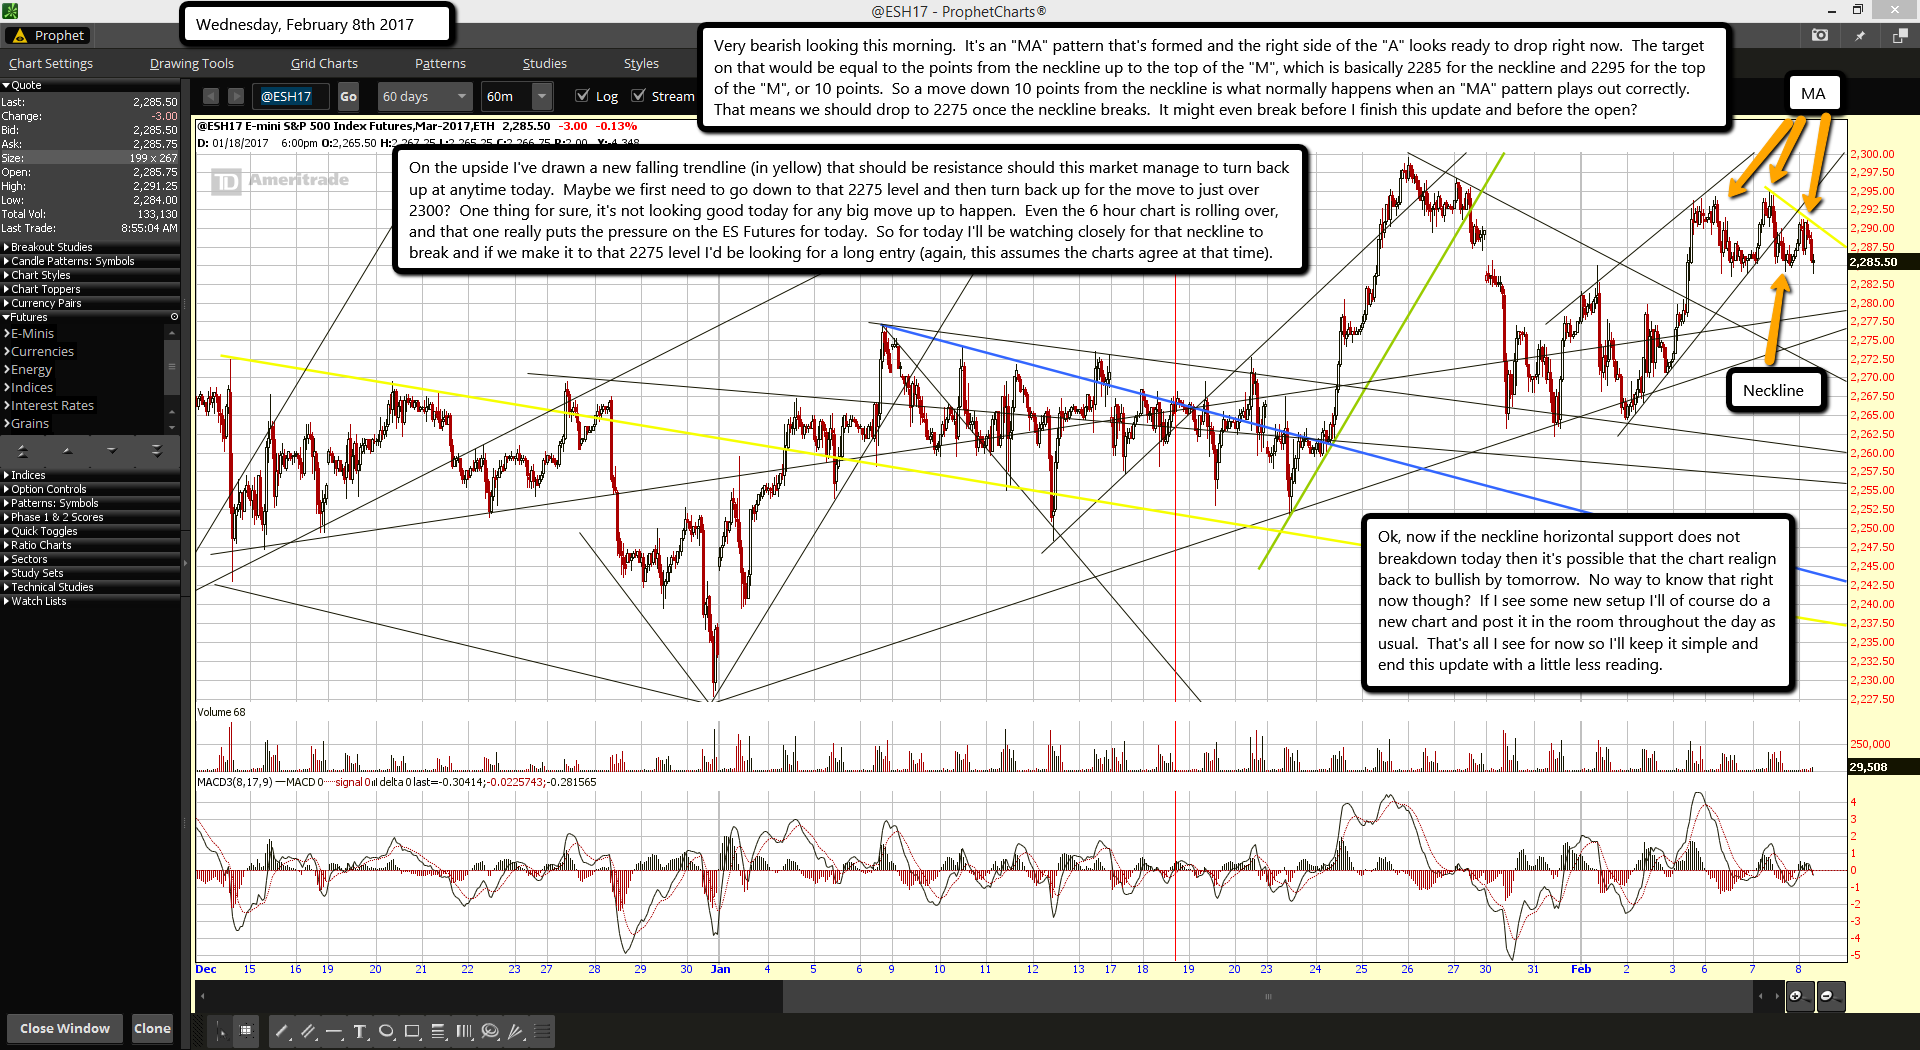
Very bearish looking this morning. It's an "MA" pattern that's formed and the right side of the "A" looks ready to drop right now. The target on that would be equal to the points from the neckline up to the top of the "M", which is basically 2285 for the neckline and 2295 for the top of the "M", or 10 points. So a move down 10 points from the neckline is what normally happens when an "MA" pattern plays out correctly. That means we should drop to 2275 once the neckline breaks. It might even break before I finish this update and before the open?
On the upside I've drawn a new falling trendline (in yellow) that should be resistance should this market manage to turn back up at anytime today. Maybe we first need to go down to that 2275 level and then turn back up for the move to just over 2300? One thing for sure, it's not looking good today for any big move up to happen. Even the 6 hour chart is rolling over, and that one really puts the pressure on the ES Futures for today. So for today I'll be watching closely for that neckline to break and if we make it to that 2275 level I'd be looking for a long entry (again, this assumes the charts agree at that time).
Ok, now if the neckline horizontal support does not breakdown today then it's possible that the chart realign back to bullish by tomorrow. No way to know that right now though? If I see some new setup I'll of course do a new chart and post it in the room throughout the day as usual. That's all I see for now so I'll keep it simple and end this update with a little less reading.


