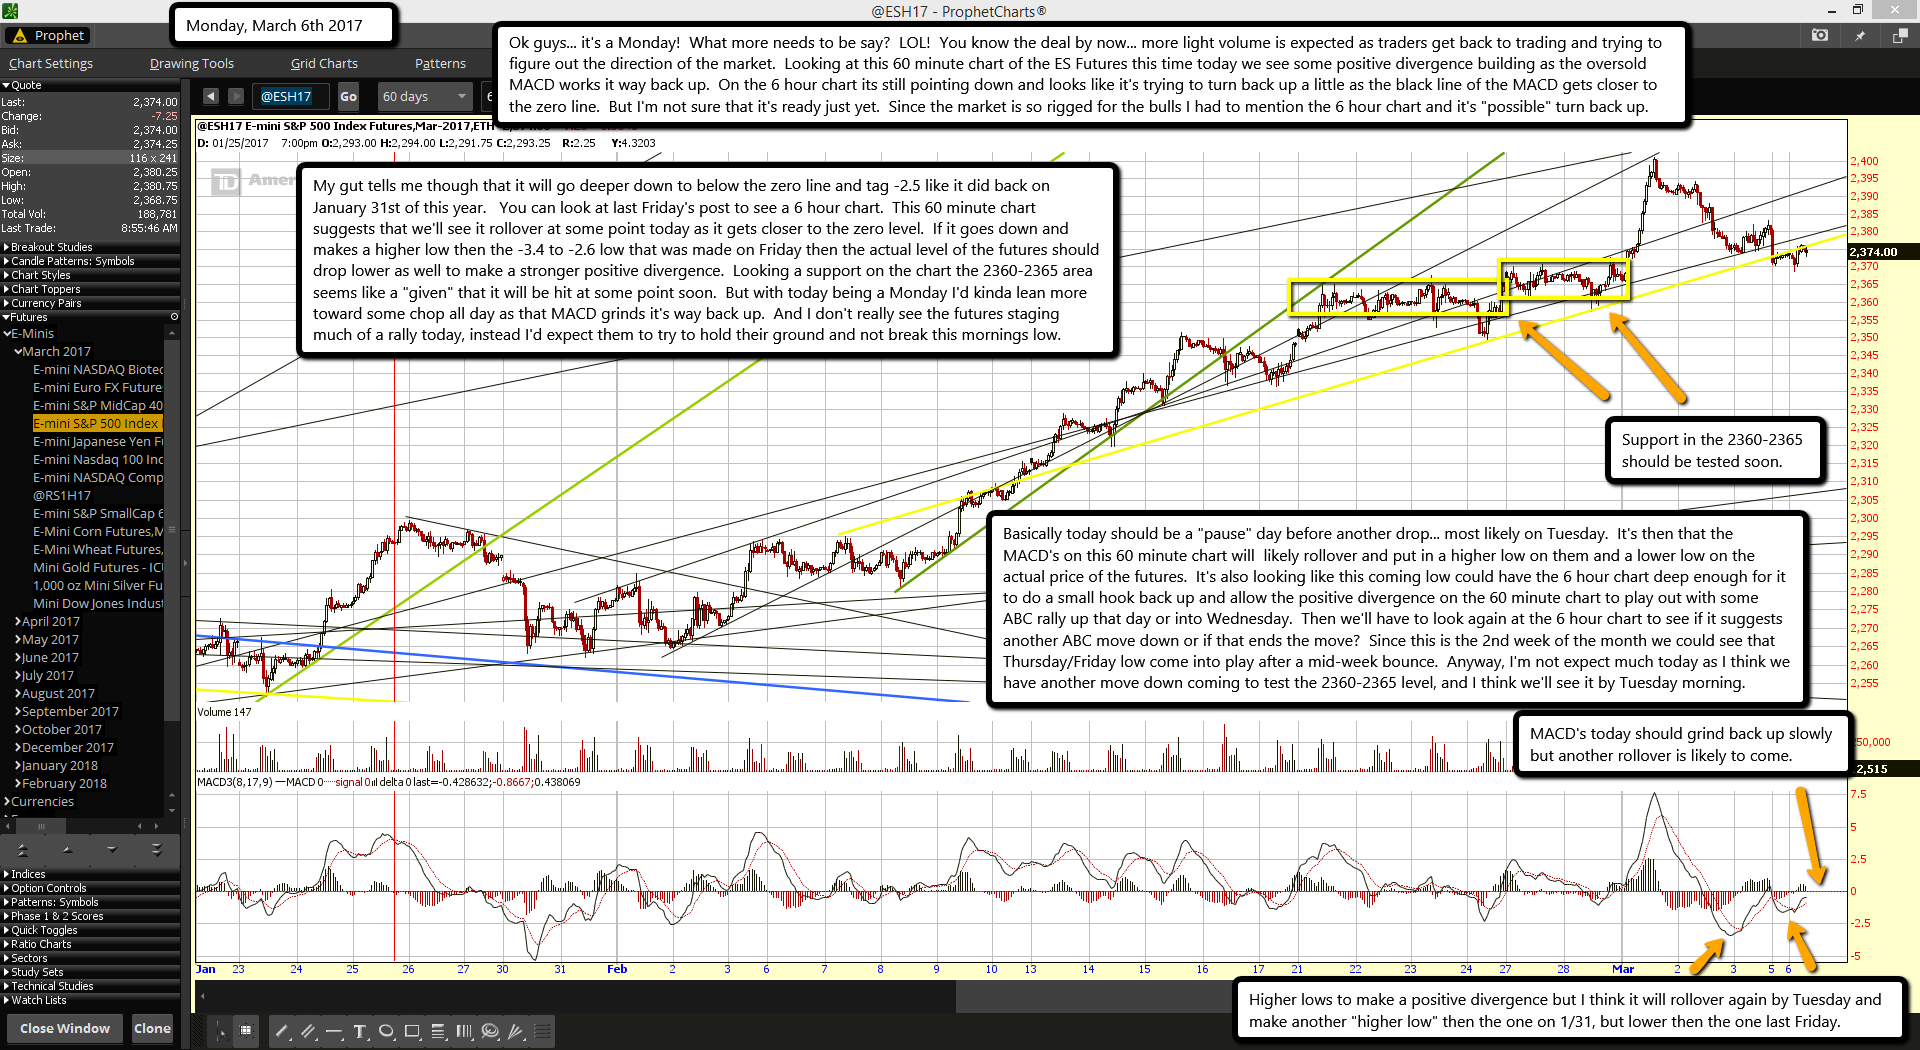
Ok guys... it's a Monday! What more needs to be say? LOL! You know the deal by now... more light volume is expected as traders get back to trading and trying to figure out the direction of the market. Looking at this 60 minute chart of the ES Futures this time today we see some positive divergence building as the oversold MACD works it way back up. On the 6 hour chart its still pointing down and looks like it's trying to turn back up a little as the black line of the MACD gets closer to the zero line. But I'm not sure that it's ready just yet. Since the market is so rigged for the bulls I had to mention the 6 hour chart and it's "possible" turn back up.
My gut tells me though that it will go deeper down to below the zero line and tag -2.5 like it did back on January 31st of this year. You can look at last Friday's post to see a 6 hour chart. This 60 minute chart suggests that we'll see it rollover at some point today as it gets closer to the zero level. If it goes down and makes a higher low then the -3.4 to -2.6 low that was made on Friday then the actual level of the futures should drop lower as well to make a stronger positive divergence. Looking a support on the chart the 2360-2365 area seems like a "given" that it will be hit at some point soon. But with today being a Monday I'd kinda lean more toward some chop all day as that MACD grinds it's way back up. And I don't really see the futures staging much of a rally today, instead I'd expect them to try to hold their ground and not break this mornings low.
Basically today should be a "pause" day before another drop... most likely on Tuesday. It's then that the MACD's on this 60 minute chart will likely rollover and put in a higher low on them and a lower low on the actual price of the futures. It's also looking like this coming low could have the 6 hour chart deep enough for it to do a small hook back up and allow the positive divergence on the 60 minute chart to play out with some ABC rally up that day or into Wednesday. Then we'll have to look again at the 6 hour chart to see if it suggests another ABC move down or if that ends the move? Since this is the 2nd week of the month we could see that Thursday/Friday low come into play after a mid-week bounce. Anyway, I'm not expect much today as I think we have another move down coming to test the 2360-2365 level, and I think we'll see it by Tuesday morning.


