I finally made it back... sheesh, what a week it's been! The guys took two days to get my hardwood floor in and then I got sick with that flu bug going around and spent 3-4 days in bed. But I finally got well enough to spend 2 days assembling my new "U-shaped" desk and re-hooking up all my computers. It was a pain in the butt of course, but worth it in the end.
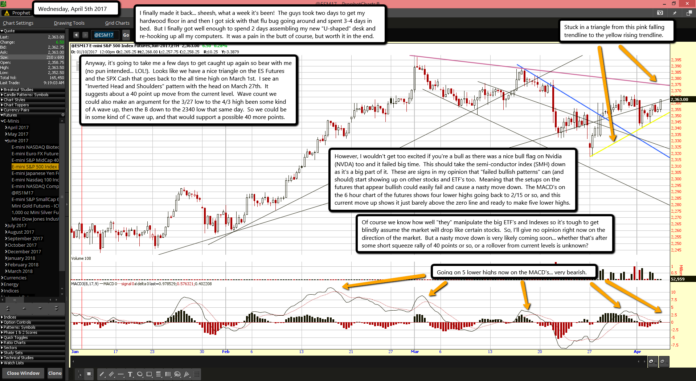
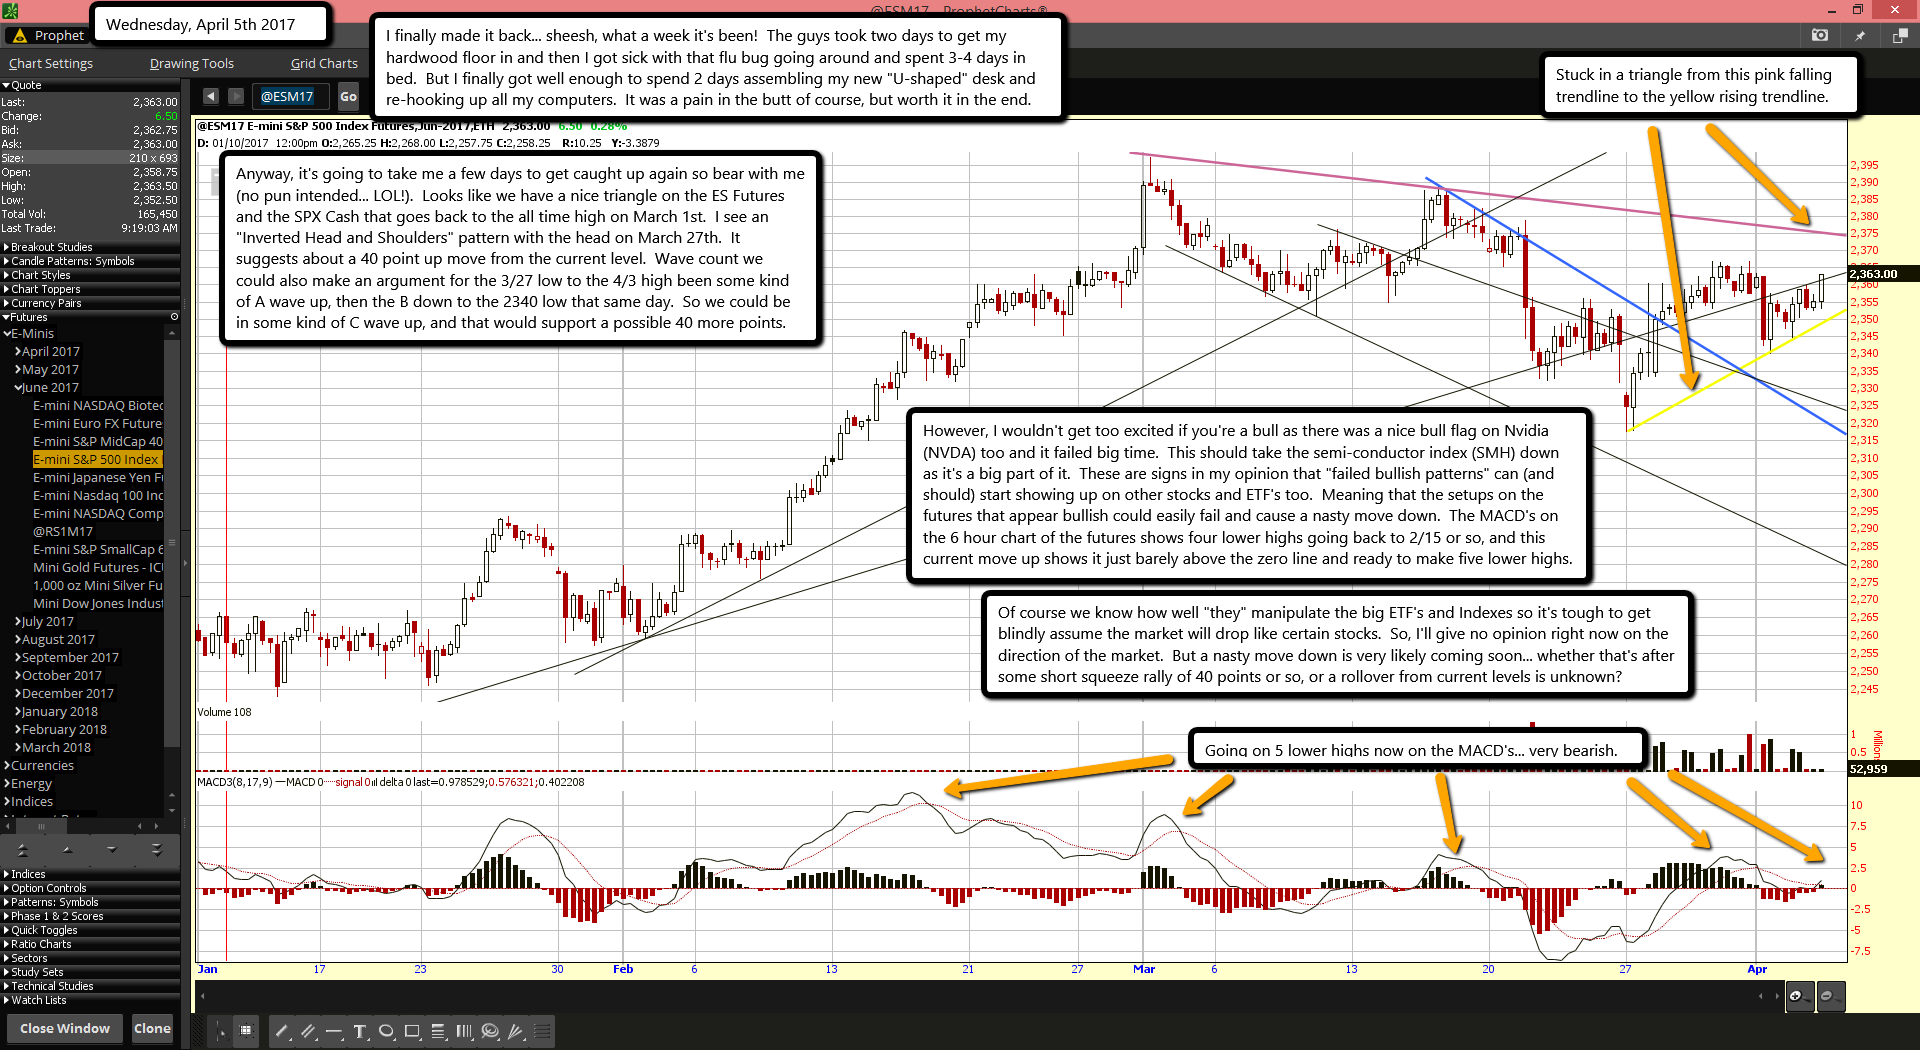
Anyway, it's going to take me a few days to get caught up again so bear with me (no pun intended... LOL!). Looks like we have a nice triangle on the ES Futures and the SPX Cash that goes back to the all time high on March 1st. I see an "Inverted Head and Shoulders" pattern with the head on March 27th. It suggests about a 40 point up move from the current level. Wave count we could also make an argument for the 3/27 low to the 4/3 high been some kind of A wave up, then the B down to the 2340 low that same day. So we could be in some kind of C wave up, and that would support a possible 40 more points.
However, I wouldn't get too excited if you're a bull as there was a nice bull flag on Nvidia (NVDA) too and it failed big time. This should take the semi-conductor index (SMH) down as it's a big part of it. These are signs in my opinion that "failed bullish patterns" can (and should) start showing up on other stocks and ETF's too. Meaning that the setups on the futures that appear bullish could easily fail and cause a nasty move down. The MACD's on the 6 hour chart of the futures shows four lower highs going back to 2/15 or so, and this current move up shows it just barely above the zero line and ready to make five lower highs.
Of course we know how well "they" manipulate the big ETF's and Indexes so it's tough to get blindly assume the market will drop like certain stocks. So, I'll give no opinion right now on the direction of the market. But a nasty move down is very likely coming soon... whether that's after some short squeeze rally of 40 points or so, or a rollover from current levels is unknown?


