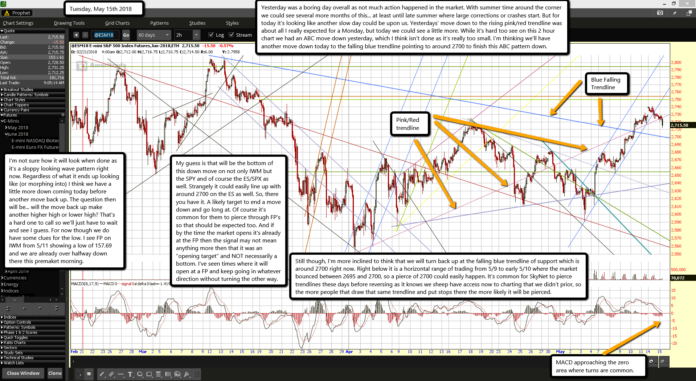
Yesterday was a boring day overall as not much action happened in the market. With summer time around the corner we could see several more months of this... at least until late summer where large corrections or crashes start. But for today it's looking like another slow day could be upon us. Yesterdays' move down to the rising pink/red trendline was about all I really expected for a Monday, but today we could see a little more. While it's hard too see on this 2 hour chart we had an ABC move down yesterday, which I think isn't done as it's really too small. I'm thinking we'll have another move down today to the falling blue trendline pointing to around 2700 to finish this ABC pattern down.
I'm not sure how it will look when done as it's a sloppy looking wave pattern right now. Regardless of what it ends up looking like (or morphing into) I think we have a little more down coming today before another move back up. The question then will be... will the move back up make another higher high or lower high? That's a hard one to call so we'll just have to wait and see I guess. For now though we do have some clues for the low. I see FP on IWM from 5/11 showing a low of 157.69 and we are already over halfway down there this premaket morning.
My guess is that will be the bottom of this down move on not only IWM but the SPY and of course the ES/SPX as well. Strangely it could easily line up with around 2700 on the ES as well. So, there you have it. A likely target to end a move down and go long at. Of course it's common for them to pierce through FP's so that should be expected too. And if by the time the market opens it's already at the FP then the signal may not mean anything more then that it was an "opening target" and NOT necessarily a bottom. I've seen times where it will open at a FP and keep going in whatever direction without turning the other way.
Still though, I'm more inclined to think that we will turn back up at the falling blue trendline of support which is around 2700 right now. Right below it is a horizontal range of trading from 5/9 to early 5/10 where the market bounced between 2695 and 2700, so a pierce of 2700 could easily happen. It's common for SkyNet to pierce trendlines these days before reversing as it knows we sheep have access now to charting that we didn't prior, so the more people that draw that same trendline and put stops there the more likely it will be pierced.


