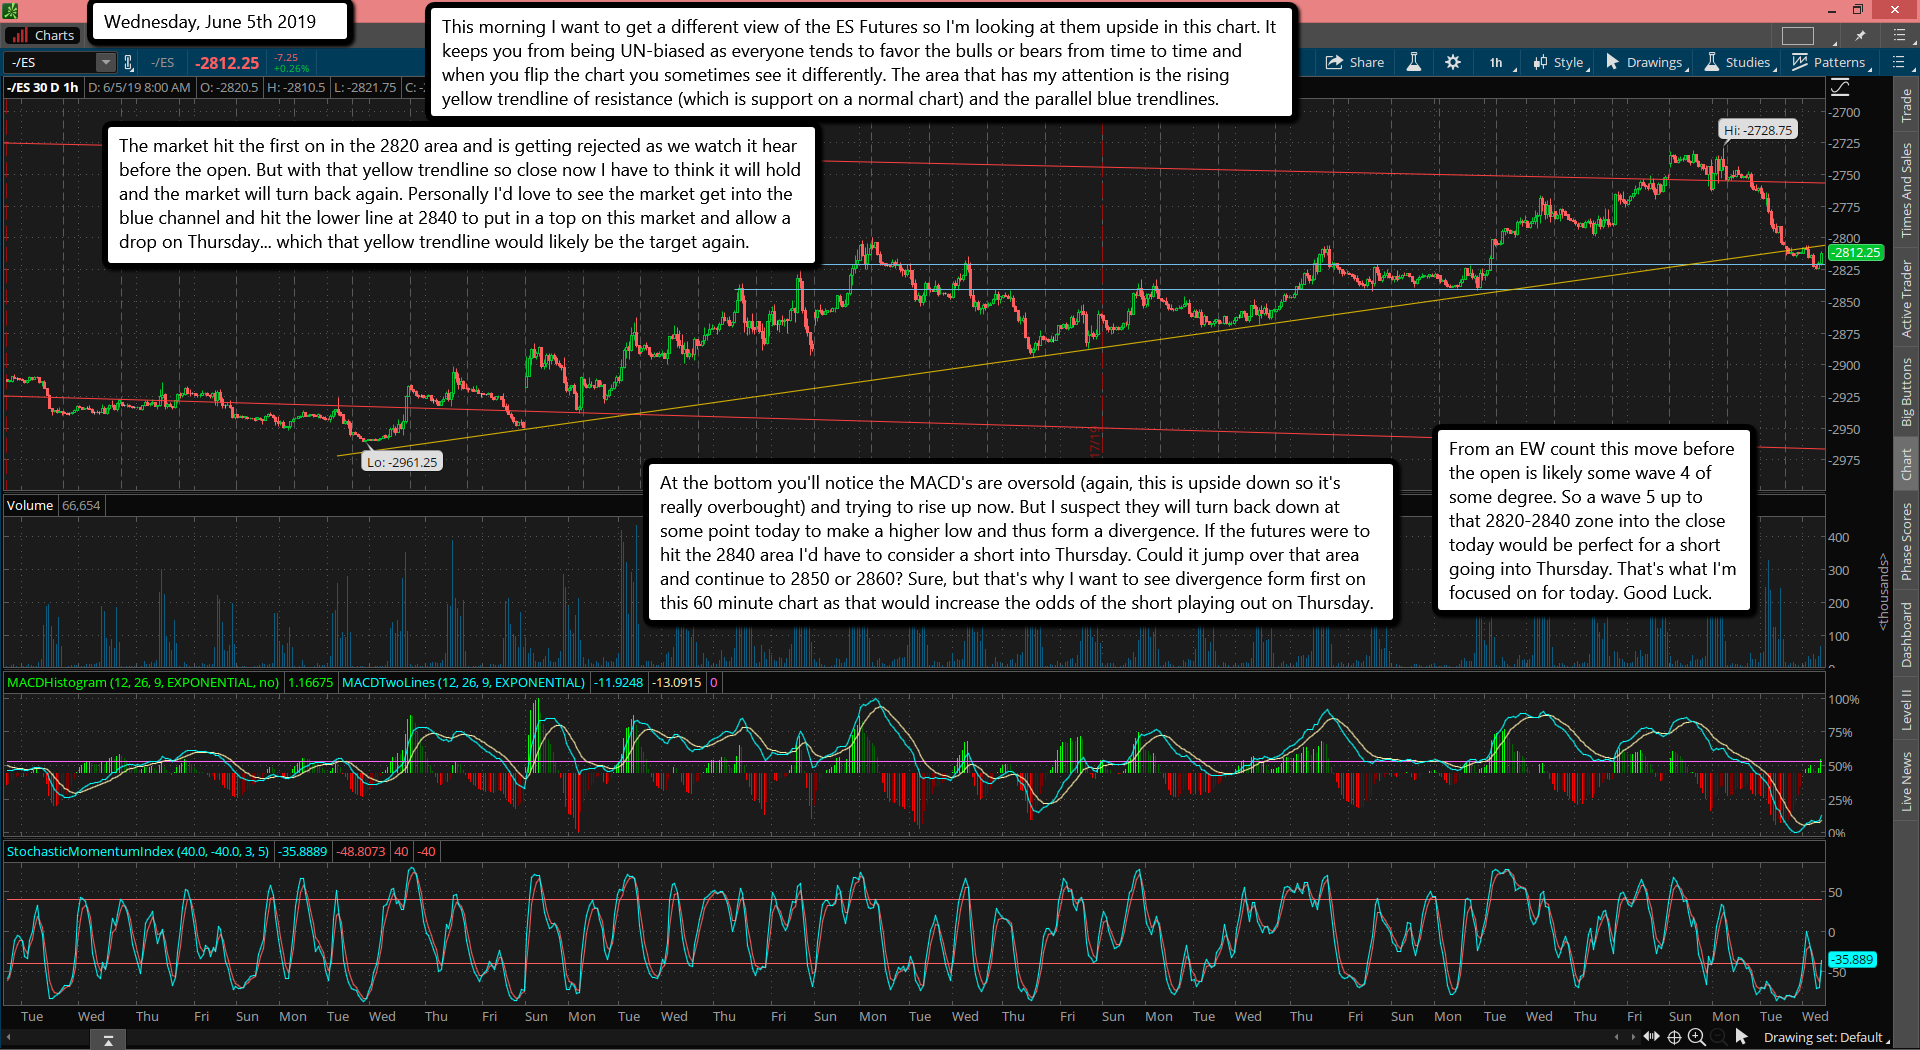
This morning I want to get a different view of the ES Futures so I'm looking at them upside in this chart. It keeps you from being UN-biased as everyone tends to favor the bulls or bears from time to time and when you flip the chart you sometimes see it differently. The area that has my attention is the rising yellow trendline of resistance (which is support on a normal chart) and the parallel blue trendlines.
The market hit the first on in the 2820 area and is getting rejected as we watch it hear before the open. But with that yellow trendline so close now I have to think it will hold and the market will turn back again. Personally I'd love to see the market get into the blue channel and hit the lower line at 2840 to put in a top on this market and allow a drop on Thursday... which that yellow trendline would likely be the target again.
At the bottom you'll notice the MACD's are oversold (again, this is upside down so it's really overbought) and trying to rise up now. But I suspect they will turn back down at some point today to make a higher low and thus form a divergence. If the futures were to hit the 2840 area I'd have to consider a short into Thursday. Could it jump over that area and continue to 2850 or 2860? Sure, but that's why I want to see divergence form first on this 60 minute chart as that would increase the odds of the short playing out on Thursday.
From an EW count this move before the open is likely some wave 4 of some degree. So a wave 5 up to that 2820-2840 zone into the close today would be perfect for a short going into Thursday. That's what I'm focused on for today. Good Luck.


