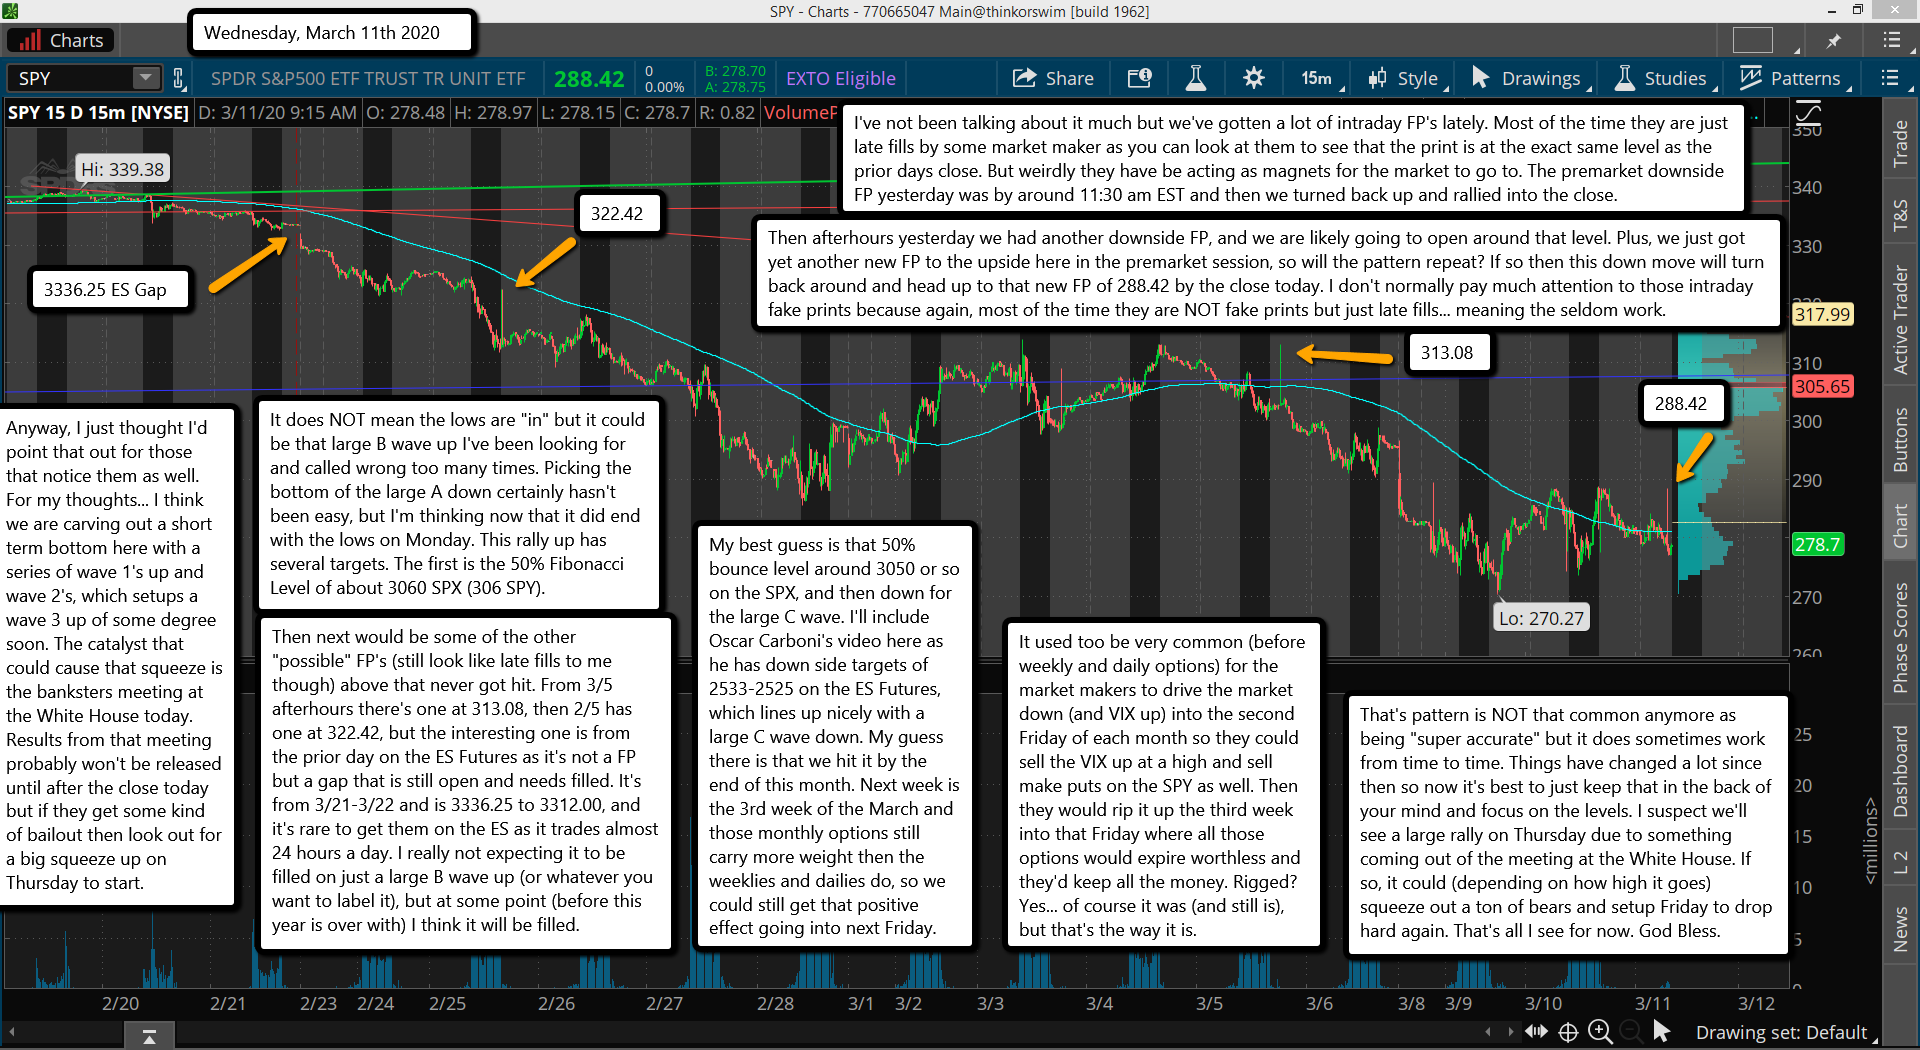
I've not been talking about it much but we've gotten a lot of intraday FP's lately. Most of the time they are just late fills by some market maker as you can look at them to see that the print is at the exact same level as the prior days close. But weirdly they have be acting as magnets for the market to go to. The premarket downside FP yesterday was by around 11:30 am EST and then we turned back up and rallied into the close.
Then afterhours yesterday we had another downside FP, and we are likely going to open around that level. Plus, we just got yet another new FP to the upside here in the premarket session, so will the pattern repeat? If so then this down move will turn back around and head up to that new FP of 288.42 by the close today. I don't normally pay much attention to those intraday fake prints because again, most of the time they are NOT fake prints but just late fills... meaning the seldom work.
Anyway, I just thought I'd point that out for those that notice them as well. For my thoughts... I think we are carving out a short term bottom here with a series of wave 1's up and wave 2's, which setups a wave 3 up of some degree soon. The catalyst that could cause that squeeze is the banksters meeting at the White House today. Results from that meeting probably won't be released until after the close today but if they get some kind of bailout then look out for a big squeeze up on Thursday to start.
It does NOT mean the lows are "in" but it could be that large B wave up I've been looking for and called wrong too many times. Picking the bottom of the large A down certainly hasn't been easy, but I'm thinking now that it did end with the lows on Monday. This rally up has several targets. The first is the 50% Fibonacci Level of about 3060 SPX (306 SPY).
Then next would be some of the other "possible" FP's (still look like late fills to me though) above that never got hit. From 3/5 afterhours there's one at 313.08, then 2/5 has one at 322.42, but the interesting one is from the prior day on the ES Futures as it's not a FP but a gap that is still open and needs filled. It's from 3/21-3/22 and is 3336.25 to 3312.00, and it's rare to get them on the ES as it trades almost 24 hours a day. I really not expecting it to be filled on just a large B wave up (or whatever you want to label it), but at some point (before this year is over with) I think it will be filled.
My best guess is that 50% bounce level around 3050 or so on the SPX, and then down for the large C wave. I'll include Oscar Carboni's video here as he has down side targets of 2533-2525 on the ES Futures, which lines up nicely with a large C wave down. My guess there is that we hit it by the end of this month. Next week is the 3rd week of the March and those monthly options still carry more weight then the weeklies and dailies do, so we could still get that positive effect going into next Friday.
It used too be very common (before weekly and daily options) for the market makers to drive the market down (and VIX up) into the second Friday of each month so they could sell the VIX up at a high and sell make puts on the SPY as well. Then they would rip it up the third week into that Friday where all those options would expire worthless and they'd keep all the money. Rigged? Yes... of course it was (and still is), but that's the way it is.
That's pattern is NOT that common anymore as being "super accurate" but it does sometimes work from time to time. Things have changed a lot since then so now it's best to just keep that in the back of your mind and focus on the levels. I suspect we'll see a large rally on Thursday due to something coming out of the meeting at the White House. If so, it could (depending on how high it goes) squeeze out a ton of bears and setup Friday to drop hard again. That's all I see for now. God Bless.


