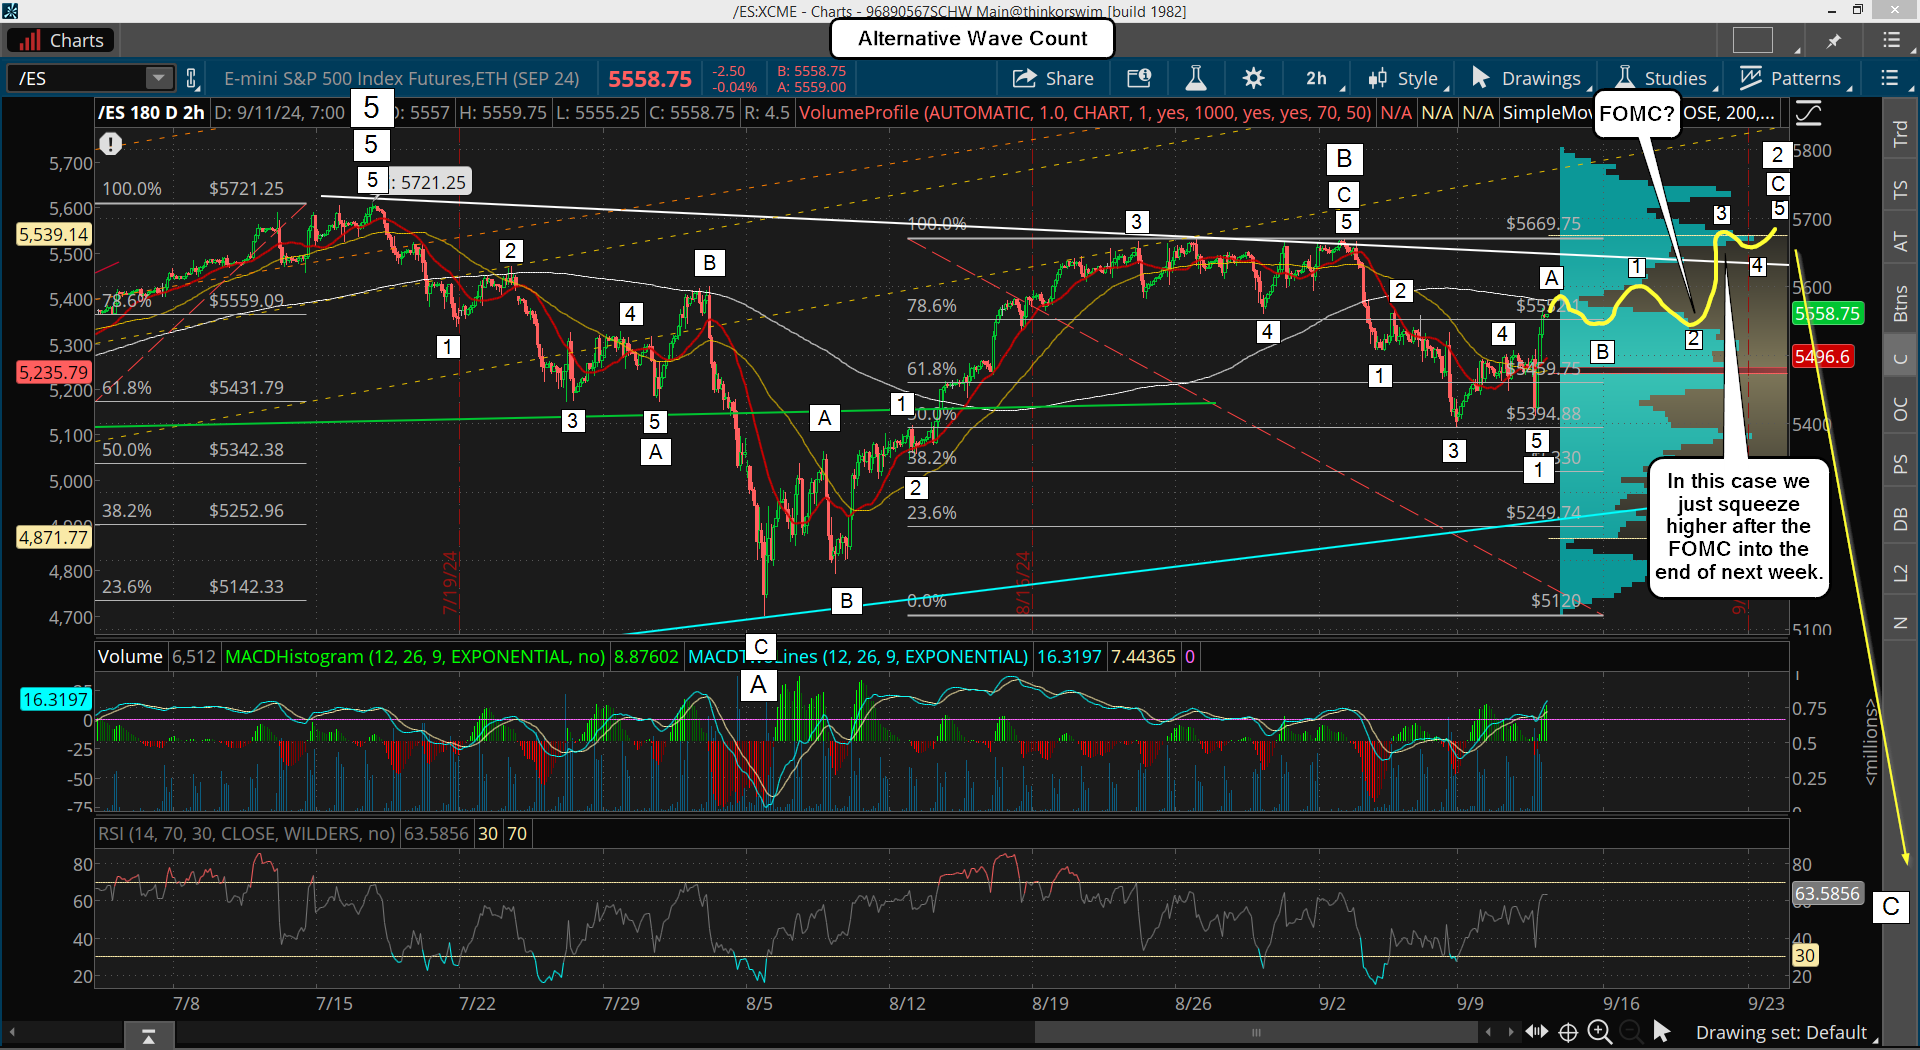
We got the pullback I was looking for yesterday, which turned out to be a higher low, which is fine for a truncated 5th wave down inside wave 1 down, inside wave C down. While the squeeze up afterwards looks and feels like a wave 3 or C (and it could be?) I lean toward it just being wave A up inside 2 up of C down. Now... if this wave count is correct then this wave A up should have a B down at some point in the next few days. Or it goes sideways for a day or two, which will also qualify as a B wave pullback. Then next week we get the C wave up inside wave 2 up of wave C down. Here's that wave count, which again is called my Alternative Wave Count.
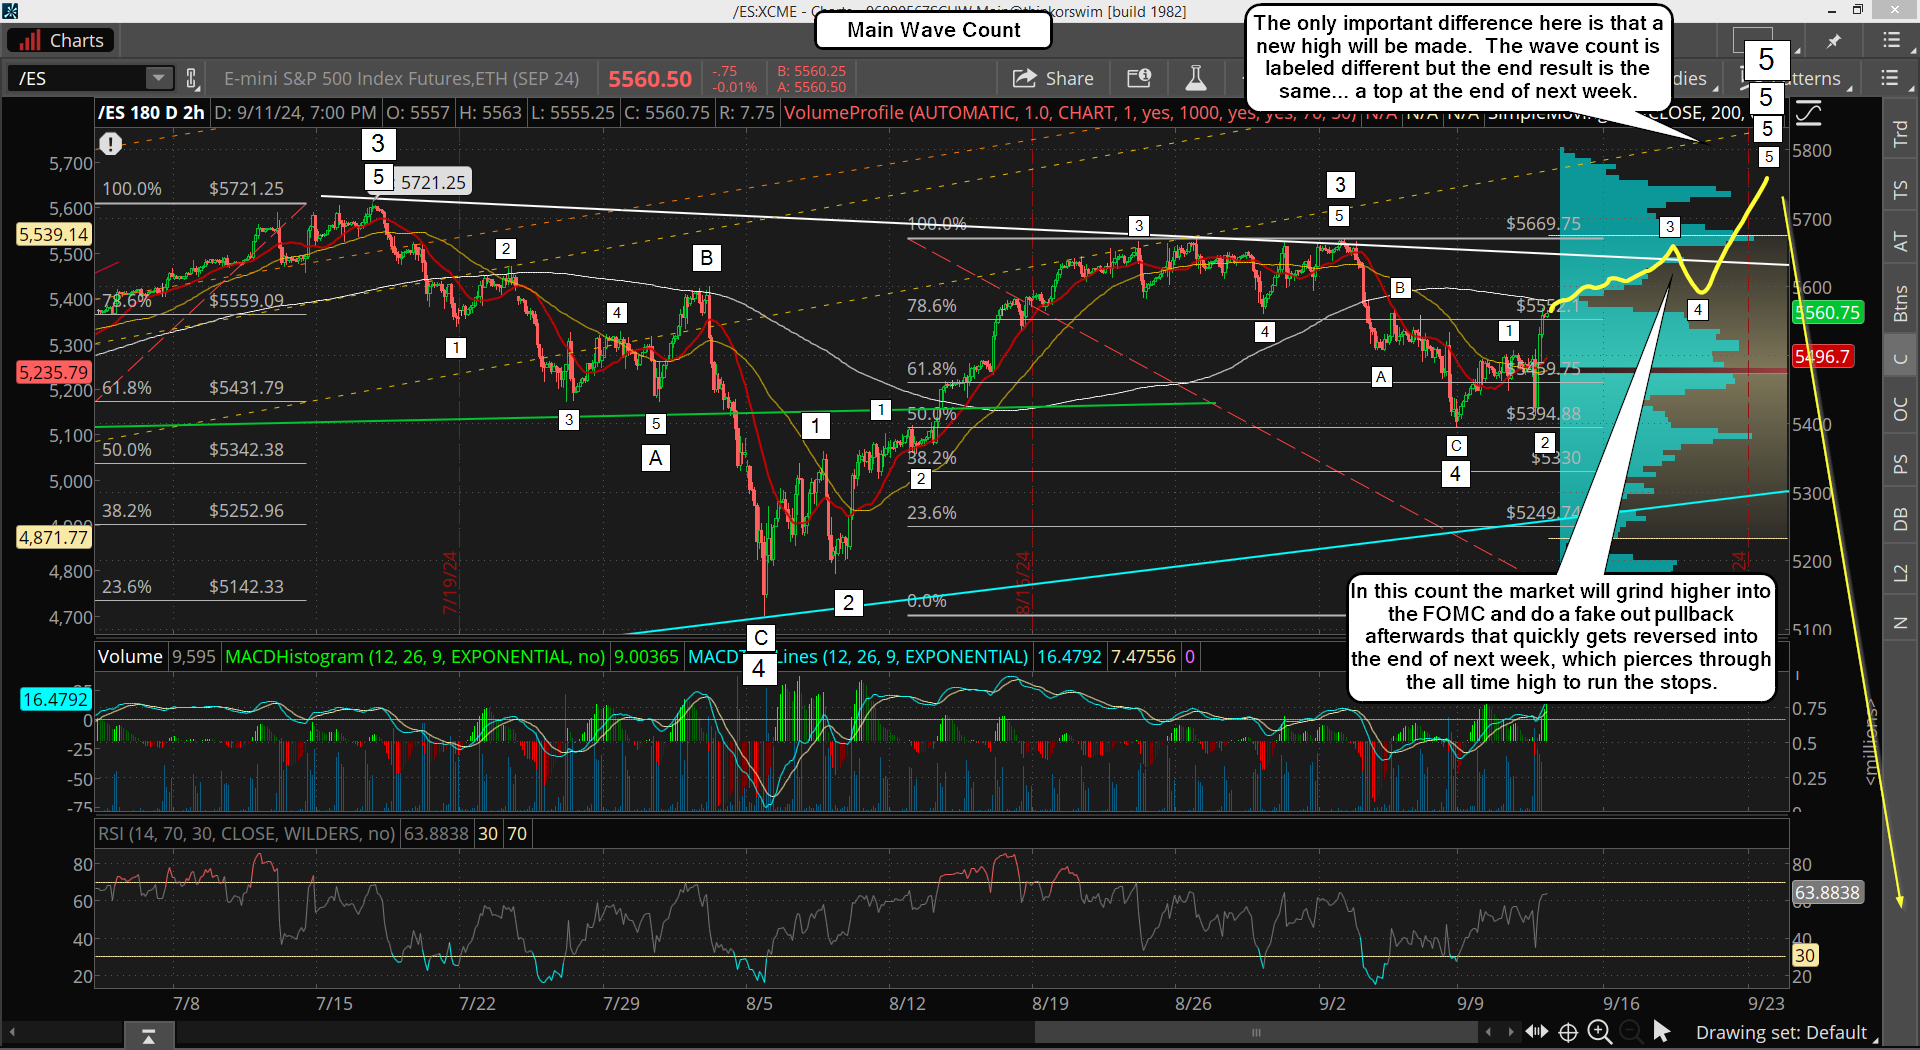
Now my Main Wave Count is pretty similar except that a new all time high would happen into the end of next week. The wave count would change a little but the end result would still be a large crash like drop would follow later this month. If a new high is made the C wave drop would just be delayed until October and the A wave would happen the week of the 23rd, which would likely bottom at the end of the month where we'd get a B wave up for several days around the first of October. It would then have the large crash like drop into the middle of the month or so. Here's that wave count.
While I'm still labeling the lower high scenario as the Alternative Wave Count, which means my lean is for a new all time high for the Main Wave Count, I can't overlook the 666 code that suggests the high is in now... at least for the SPX cash. Maybe the ES futures makes a slightly higher high but the cash doesn't? That's possible for sure. But either wave count points to a high at the end of next week.
Have a blessed day.


