

Moving up as expected, but we are getting close to major resistance again. We should NOT get through it on the first attempt, and we might not ever get through... who knows for sure? I move focused on "when" then "price", and I still think that we will have a last squeeze up after the FOMC next Wednesday. The price isn't something I can forecast.
Short term though the charts are getting extended on the upside, so while many Friday's have that bullish late day move it might get skipped today? Then next Monday and/or Tuesday is where I'd expect to see some kind of pullback in front of the FOMC. After the meeting though I think we get a squeeze that could pierce the current all time high, or fall shy a little and lure everyone into thinking the bottom is in.
But the technicals just don't support it from what I see. We could have some surprise event over the weekend of the 21st/22nd that would cause a "gap down and go" move... like a dollar revaluation possibly? I don't know what the event will be but something big is very likely to happen before the election, and I think it starts the week of the 23rd.
Have a great weekend.
P.S. A friend sent me this video this morning...
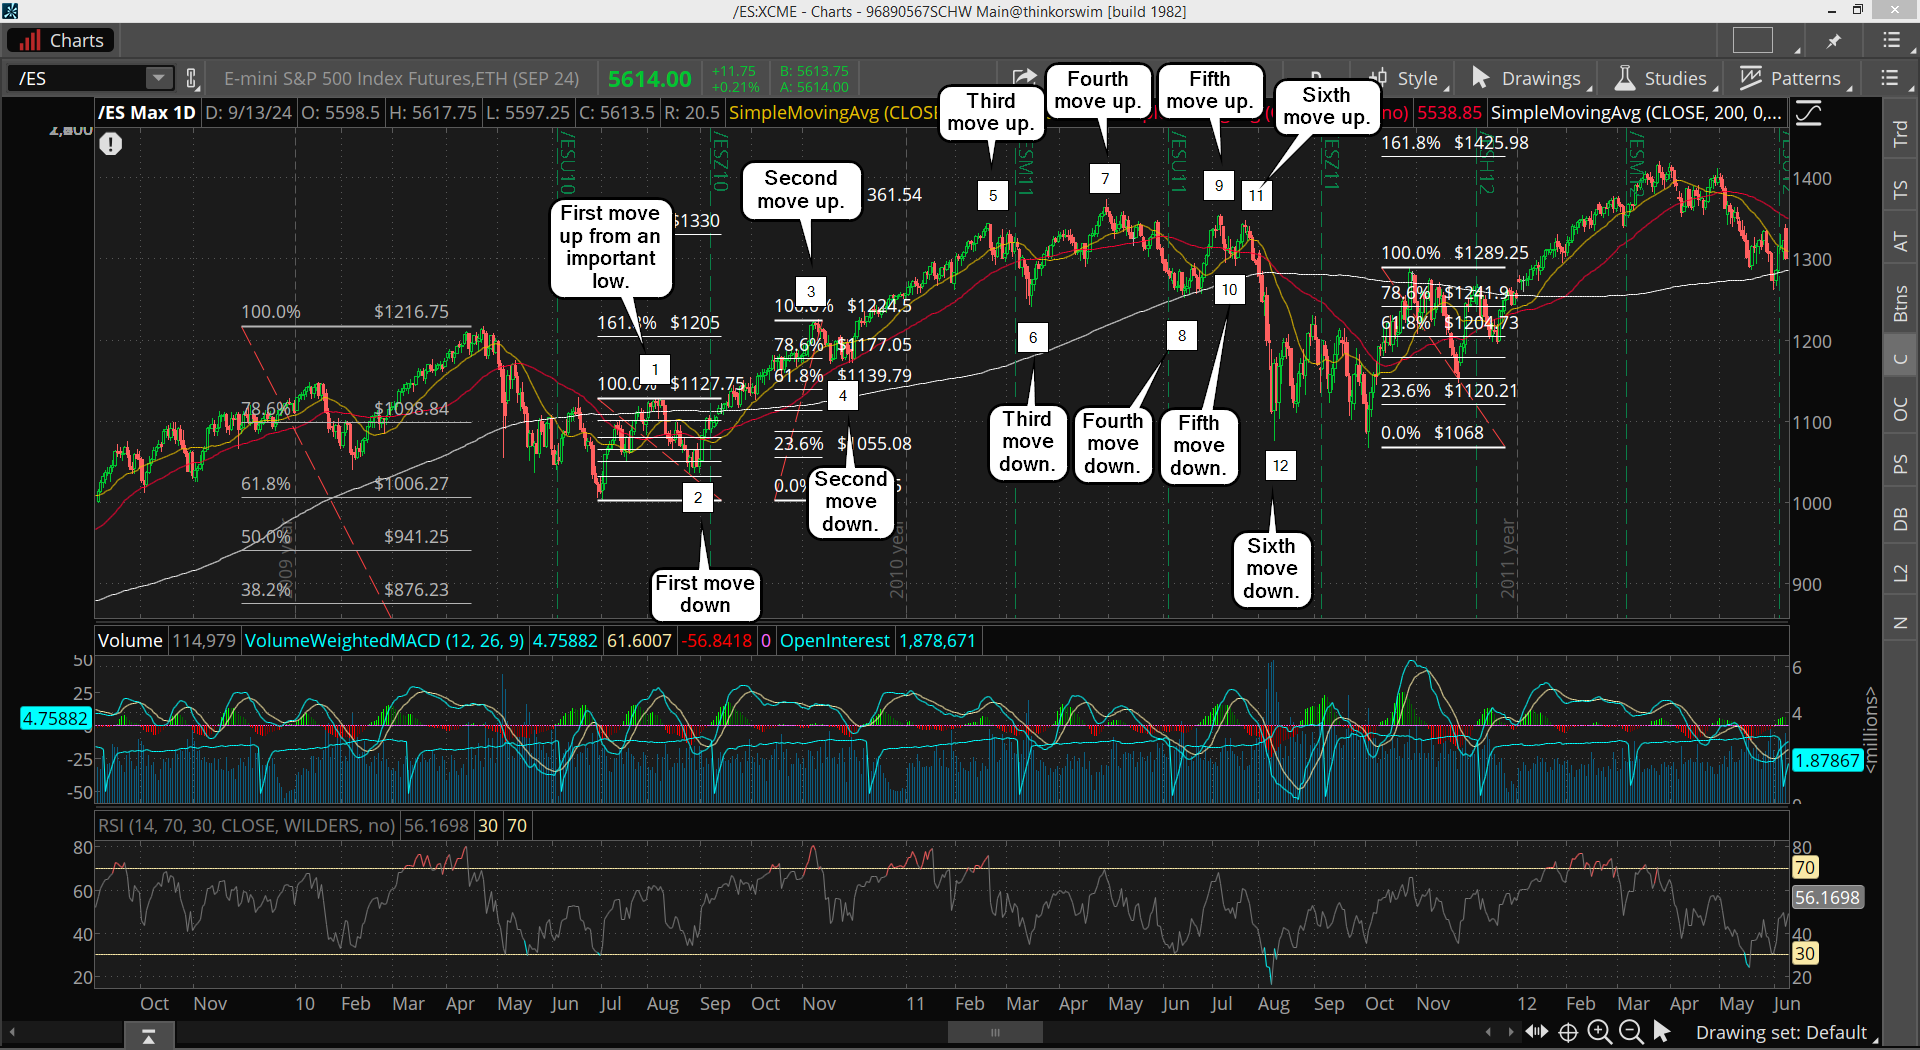
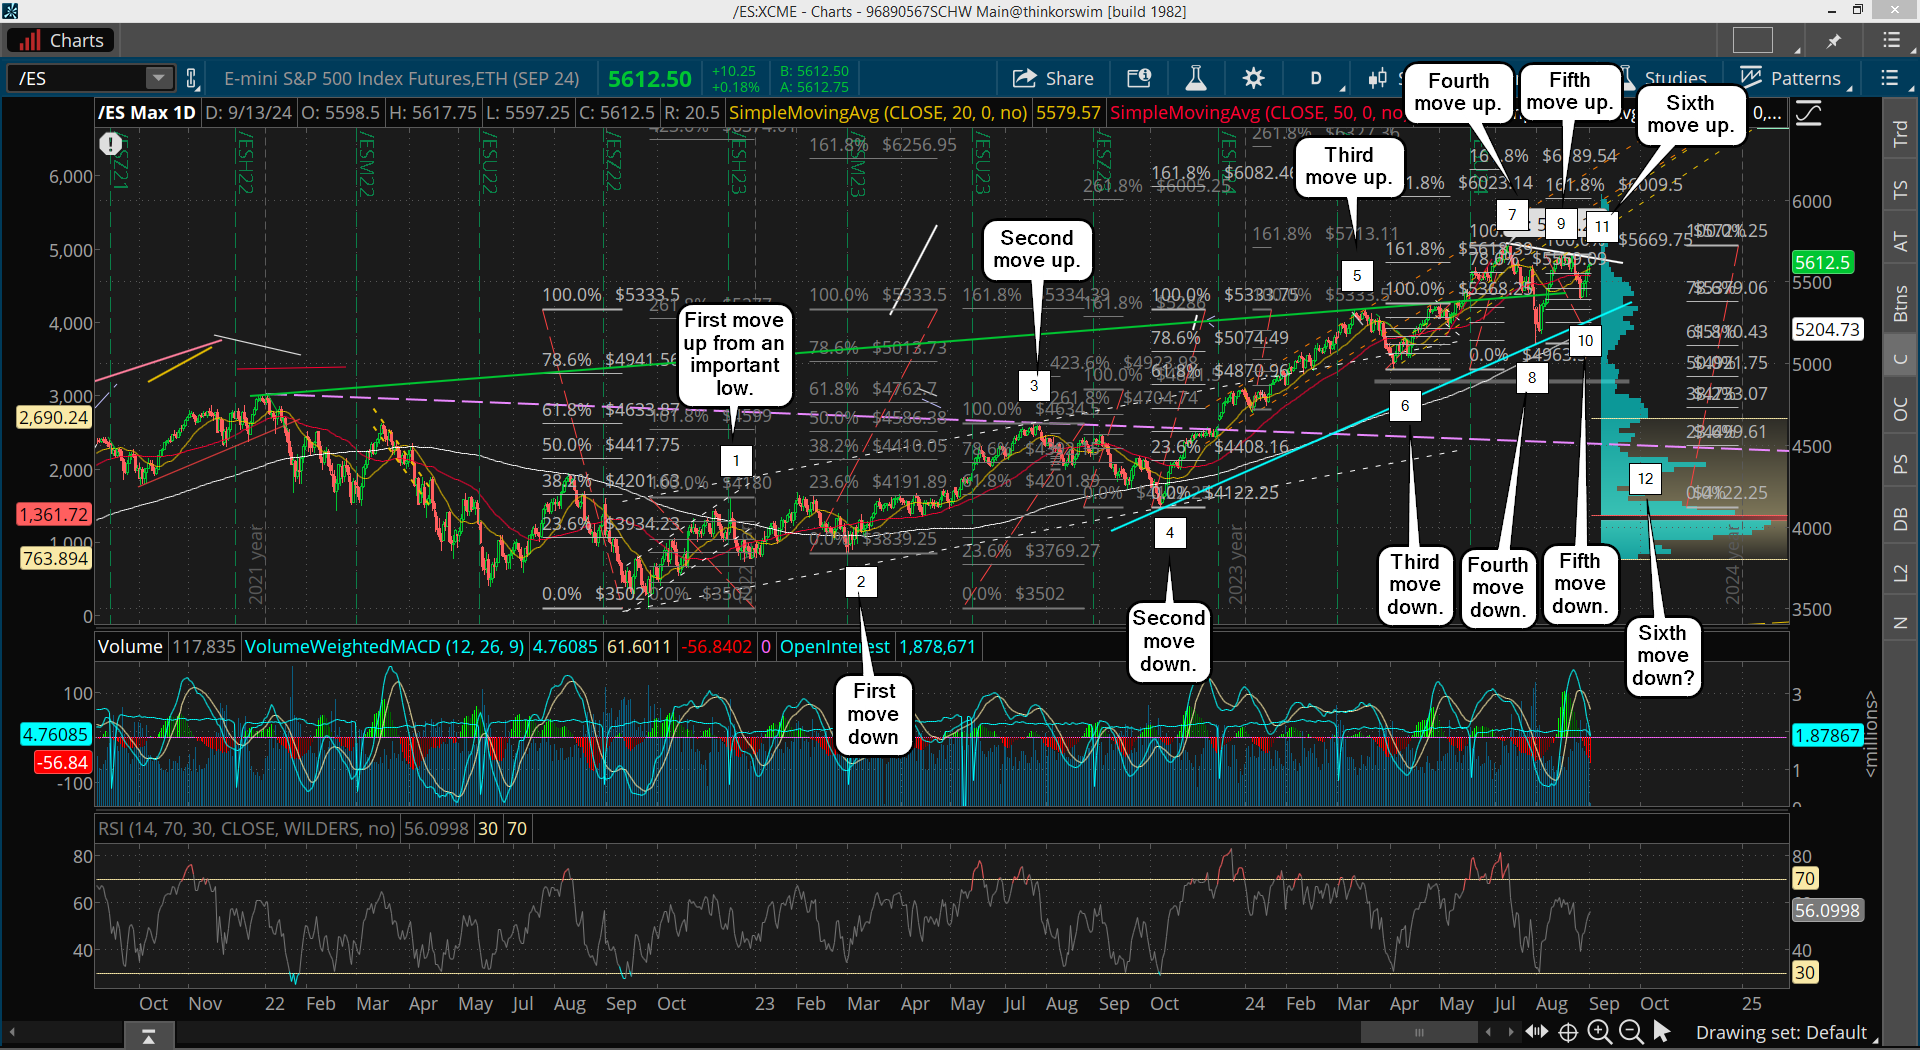
While I can't disagree I tend to think we look like 2011. Here's the charts...
The 2011 Chart...
The 2024 Chart...


We just had a mini rally into a 3rd lower high like at the end of May 2011. I have a few minor sell signals now but there is an interesting technical formation that could indicate we are still in a bear phase. The 30 day average of several prominent averages is above a certain technical indicator. In a bull run, it’s usually the other way around. I’m sure it was in that condition in late 2011 but I can’t check anymore because a certain chart website has become difficult. A continued rally would change that situation though.
But a continued rally would send another indicator to the moon to its highest levels in the past 3 years. That’s more analagous to a raging bull market. Is that likely? Especially with a killer cycle linked to the Covid crash of 2020 coming up?
Also crude oil is setting up a pattern similar to its July 1990 bottom. I think it needs to chop around in its new lower range for a little while more. Look for the 30 day average to get super extended from the 100 day average. As I remember, crude should tag its flat lower weekly Bollinger Band for the bottom.
If we rally into the FOMC this Wednesday I think it’s a short.