

We got the pullback I was looking for, and it filled the gap at the last minute as it went into the close on Wednesday. Sneaky move for sure as it stopped shy of it early in the day and acted like the bottom was in, which is around where I went long. No fear though as it's hard to catch the perfect entry long, or short. I fully expect a big rally to start now, which should last into the 15th-20th of this new month, with a target of 7200-7300.
It's hard to predict where it's going for sure, but the "time range" is the most important part, as that's where we should see another good pullback start from. It should last into mid-February, so it could be a nice one... which will be a wave 4 of some degree. Then a wave 5 up into April/May that will setup the market for a crash into the third quarter of the year with August/September being the important months to look out for. Now let's look at the possible wave count on the short term in the chart below...

If the count is correct the move down into Wednesday completed an ABC for a small wave 2 and we are about to start a small wave 3 up today, inside medium wave 5, inside large wave 5, inside extra large wave 3, that should last into mid-January. Now, the tricky part is "where does extra large wave 3 end?", as it could end in April/May instead of mid-January. Basically, we are in the final part of large wave 5, that is inside extra large wave 3 up. It could drag out into the April/May period, but fortunately the new Economist Cover for 2026 tells the big picture. Here's that cover...
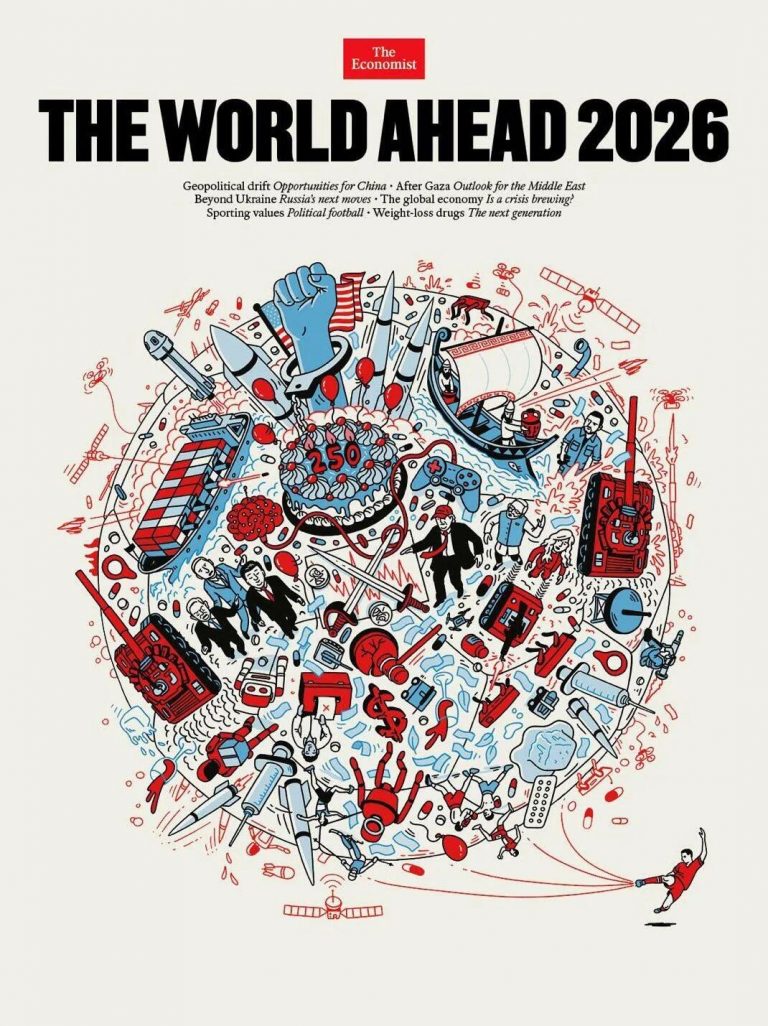
You can see on the chart in the picture, that is behind the two swords, there's a major high in January of 2026, and what looks to be April/May... which looks like a double top to me. I believe that we will see extra large wave 3 top this month and extra large wave 4 down unfolds in an ABC move that bottom in mid-February. After that it's a non-stop squeeze into April/May for a double top that completes extra large wave 5. Then the rest of the year we see a bear market to make an ABC down with the A wave looking like a crash. Below is the big picture wave count.

I have extra large wave 4 ending right around the 5339 ES gap that will get filled at some point. I do not know when though as possibly extra large wave 4 is more shallow and the ABC that happens in the second half of the year, after extra large wave 5 ends, will be the move that fills that gap? It doesn't suggest that is the plan on the chart in the Economist Cover as it clearly shows a lower low in the February period then the low from the first drop after the April/May high.
The end of the year low (the C wave) could reach it I guess as it's close to the February low on the chart.. but I really don't have any track record of the accuracy of the Economist Covers going back many years to gauge from. I've known about the chart for a decade or more, but I never paid much attention to it.

I know that last years chart was quite accurate as it shows an early low, a strong rally and a late in the year low (that was a higher low), and that was accurate too. My point is that I cannot confirm whether or not the "higher lows' or "lower lows" have be accurate in the past many years of the covers being put out.
However, I suspect they will be as a surprise large drop into February would catch a ton of traders by surprise and when the squeeze back up into a double top followed into April/May not many would catch it. They will short it the entire way up, and after it takes them out of course is when it will top and really crash for the A wave into a June-August low. It looks very tricky on that chart from the Economist Cover, and if it plays out most traders will miss it entirely.
Have a great weekend.

