So far this move down looks too me like we put in an important top and change in trend. Now I'm not saying it's the final high before a crash as we still have the end of the month Santa rally that "could" take us to new high again. But odds tell me we do have a short term top. I have several reasons to think that, and one of them is the technical picture. Another is the passport code (explained on my "codes" page of my blog) as the market hit the high on December 4th where I have a passport from the movie "The Equalizer". Another clue is how close the top on the SPX Index was to the ritual number 666 (we hit 2665.19) as the bottom code for the March 2009 crash low was also a 666 (666.79 to be exact).
So, when I add up all the clues I have enough evidence to suggest at minimum we have a short term top and at maximum we have the final top before crash. One more example of the "eleven" code (666 is of course the mark of the beast in the Bible but it's also a multiple of the number "11", like 22, 33, 44, 555, 777, etc...) being used to mark the final high for the year before a crash was on August 25th 1987 when the SPX printed an intraday low of 333.33, with the high of 337.88 and close of 336.77... plus, just to make sure you didn't miss the coded message, they opened with 333.33 and closed with 333.33 the day before. Clearly that was a coded "eleven" message to the insiders as the top was put in on the 25th of August and the market then continued down until it crashed later that year in October.
The question now is... "does the 2665.17 high signal a top"? Back in 1987 not many people knew of the elite and their rituals they do with numbers, but now with the internet exposing them a great number of people look for ritual numbers as clues. Therefore they might be inclined to be a little less obvious with there codes and just get within a point of some ritual number instead of an exact hit... like the March 6th, 2009 low. Plus there's also the fact that computers track every tick now so if SkyNet was unable to hit an exact number it's much harder to adjust it after the close like it would have been back in 1987 when people were still involved in trading and tallying up the final numbers. The bottom line is, there's a lot of reasons to believe we have put in an important top... and "maybe" the last top before a crash?
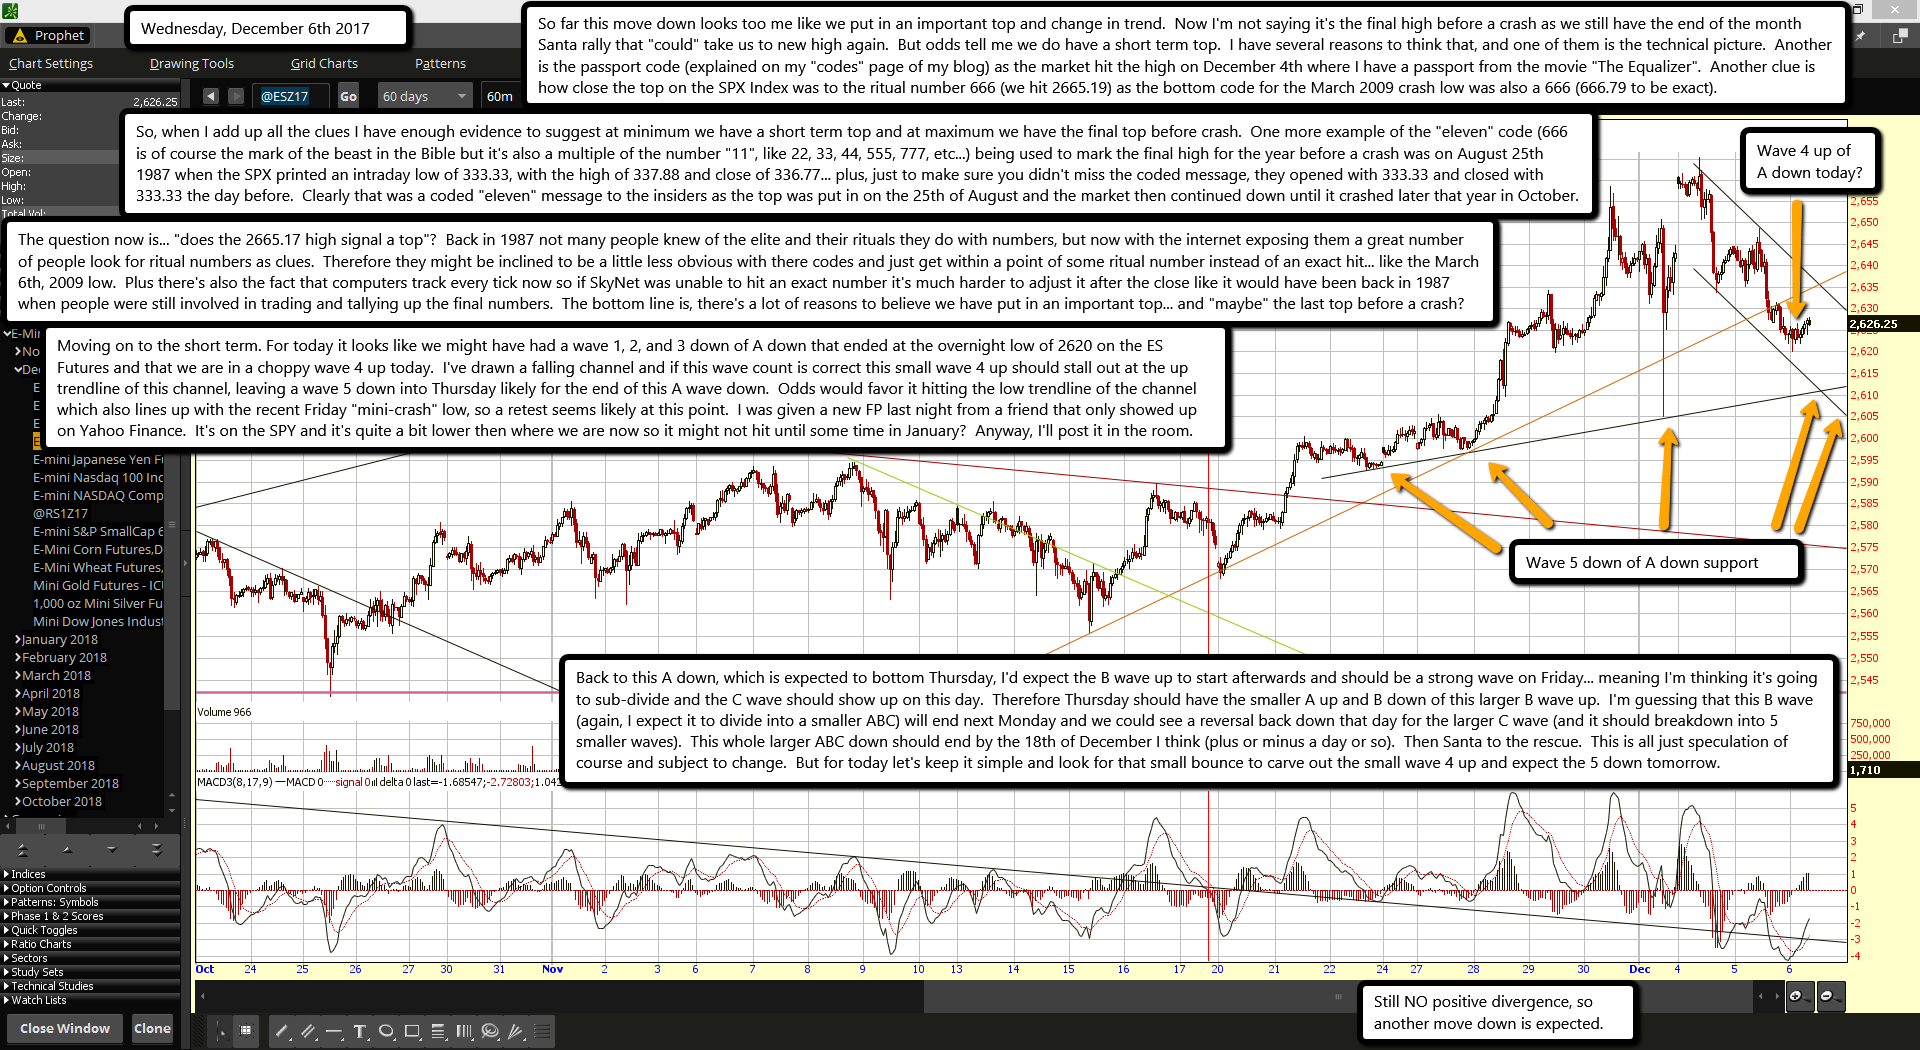
Moving on to the short term. For today it looks like we might have had a wave 1, 2, and 3 down of A down that ended at the overnight low of 2620 on the ES Futures and that we are in a choppy wave 4 up today. I've drawn a falling channel and if this wave count is correct this small wave 4 up should stall out at the up trendline of this channel, leaving a wave 5 down into Thursday likely for the end of this A wave down. Odds would favor it hitting the low trendline of the channel which also lines up with the recent Friday "mini-crash" low, so a retest seems likely at this point. I was given a new FP last night from a friend that only showed up on Yahoo Finance. It's on the SPY and it's quite a bit lower then where we are now so it might not hit until some time in January? Anyway, I'll post it in the room.
Back to this A down, which is expected to bottom Thursday, I'd expect the B wave up to start afterwards and should be a strong wave on Friday... meaning I'm thinking it's going to sub-divide and the C wave should show up on this day. Therefore Thursday should have the smaller A up and B down of this larger B wave up. I'm guessing that this B wave (again, I expect it to divide into a smaller ABC) will end next Monday and we could see a reversal back down that day for the larger C wave (and it should breakdown into 5 smaller waves). This whole larger ABC down should end by the 18th of December I think (plus or minus a day or so). Then Santa to the rescue. This is all just speculation of course and subject to change. But for today let's keep it simple and look for that small bounce to carve out the small wave 4 up and expect the 5 down tomorrow.


