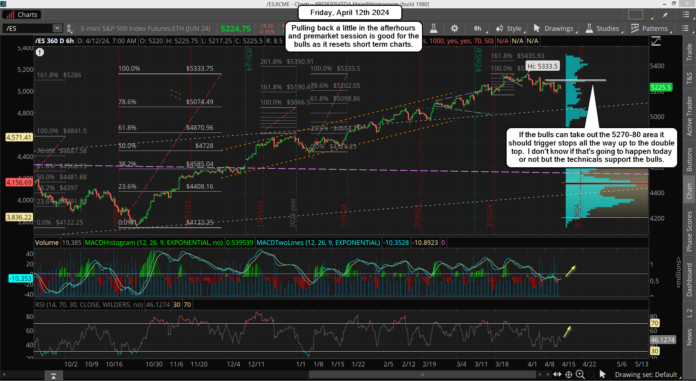
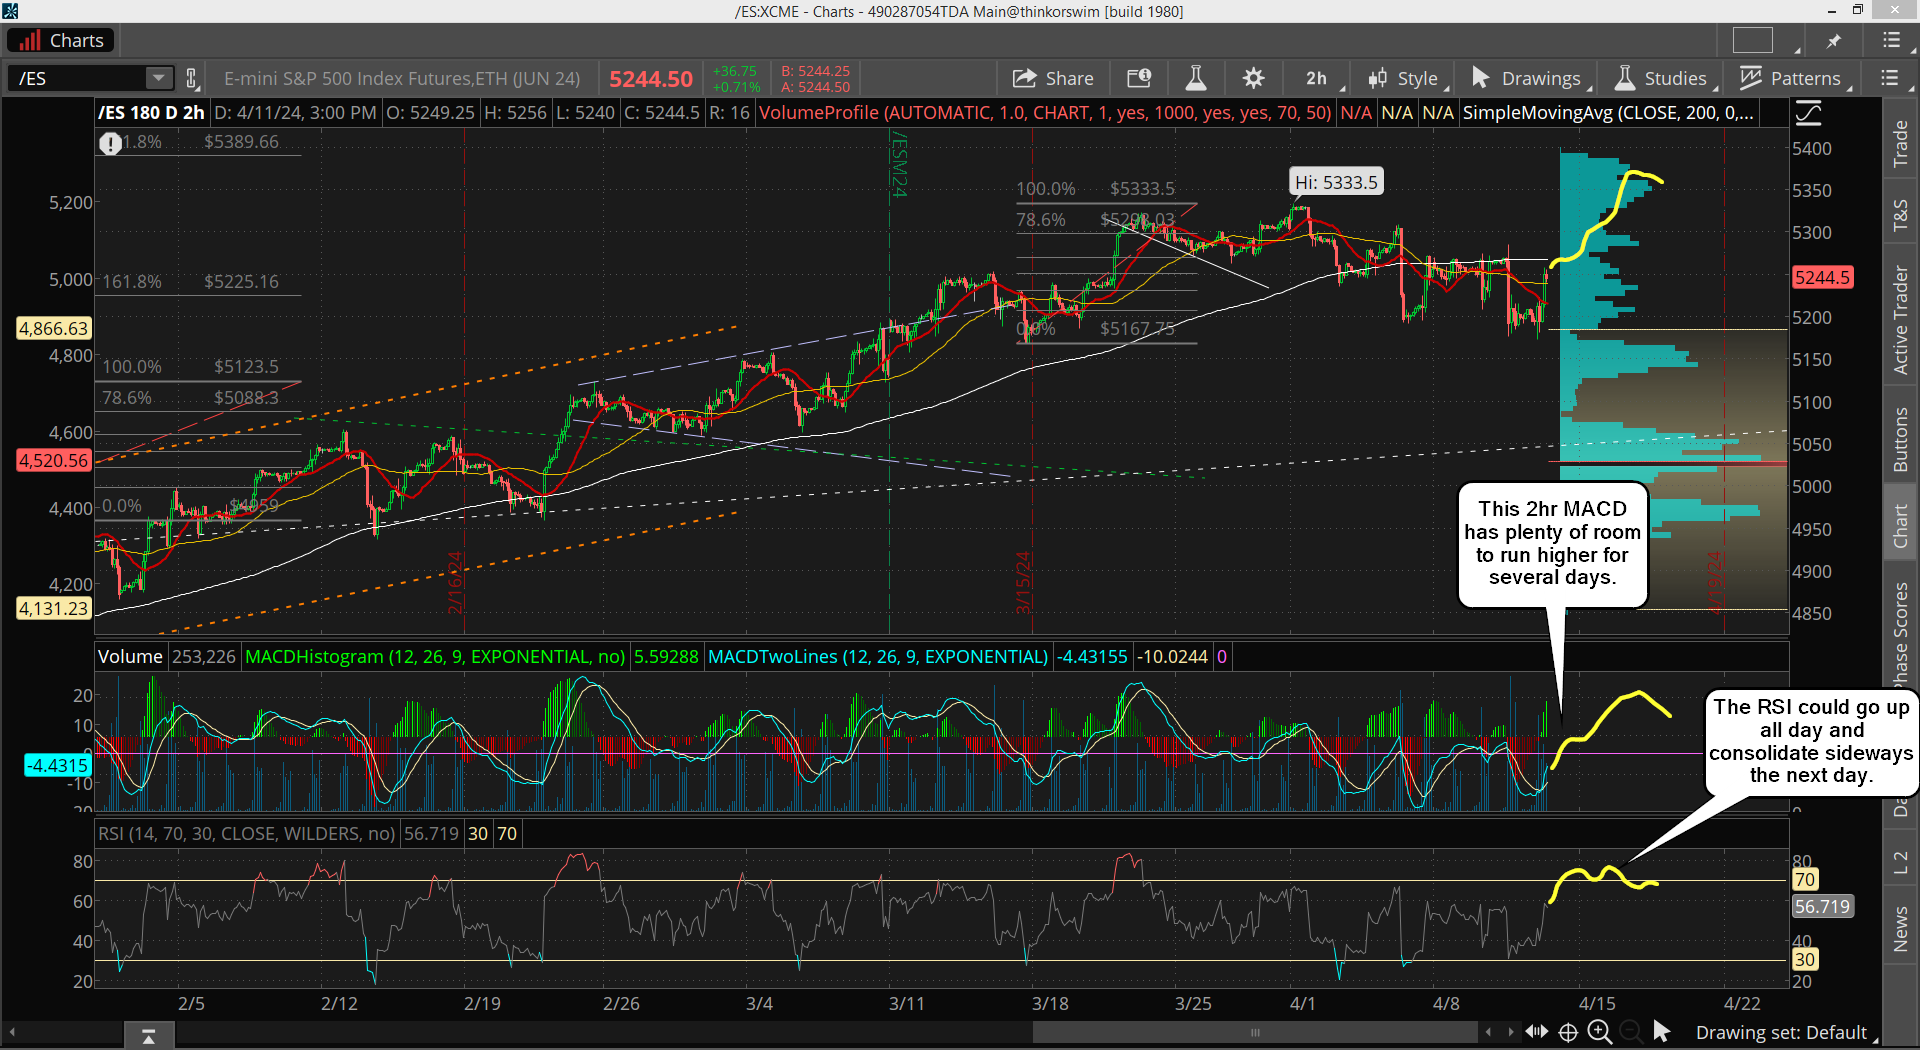
The market appears to have bottomed now as I was thinking it would. Looking at the 2hr, 6hr and daily chart the all support a lot more upside. While bears are likely shorting this bounce I don't see again big drop. The technicals look very bullish now The 2hr chart below looks bottomed to me.
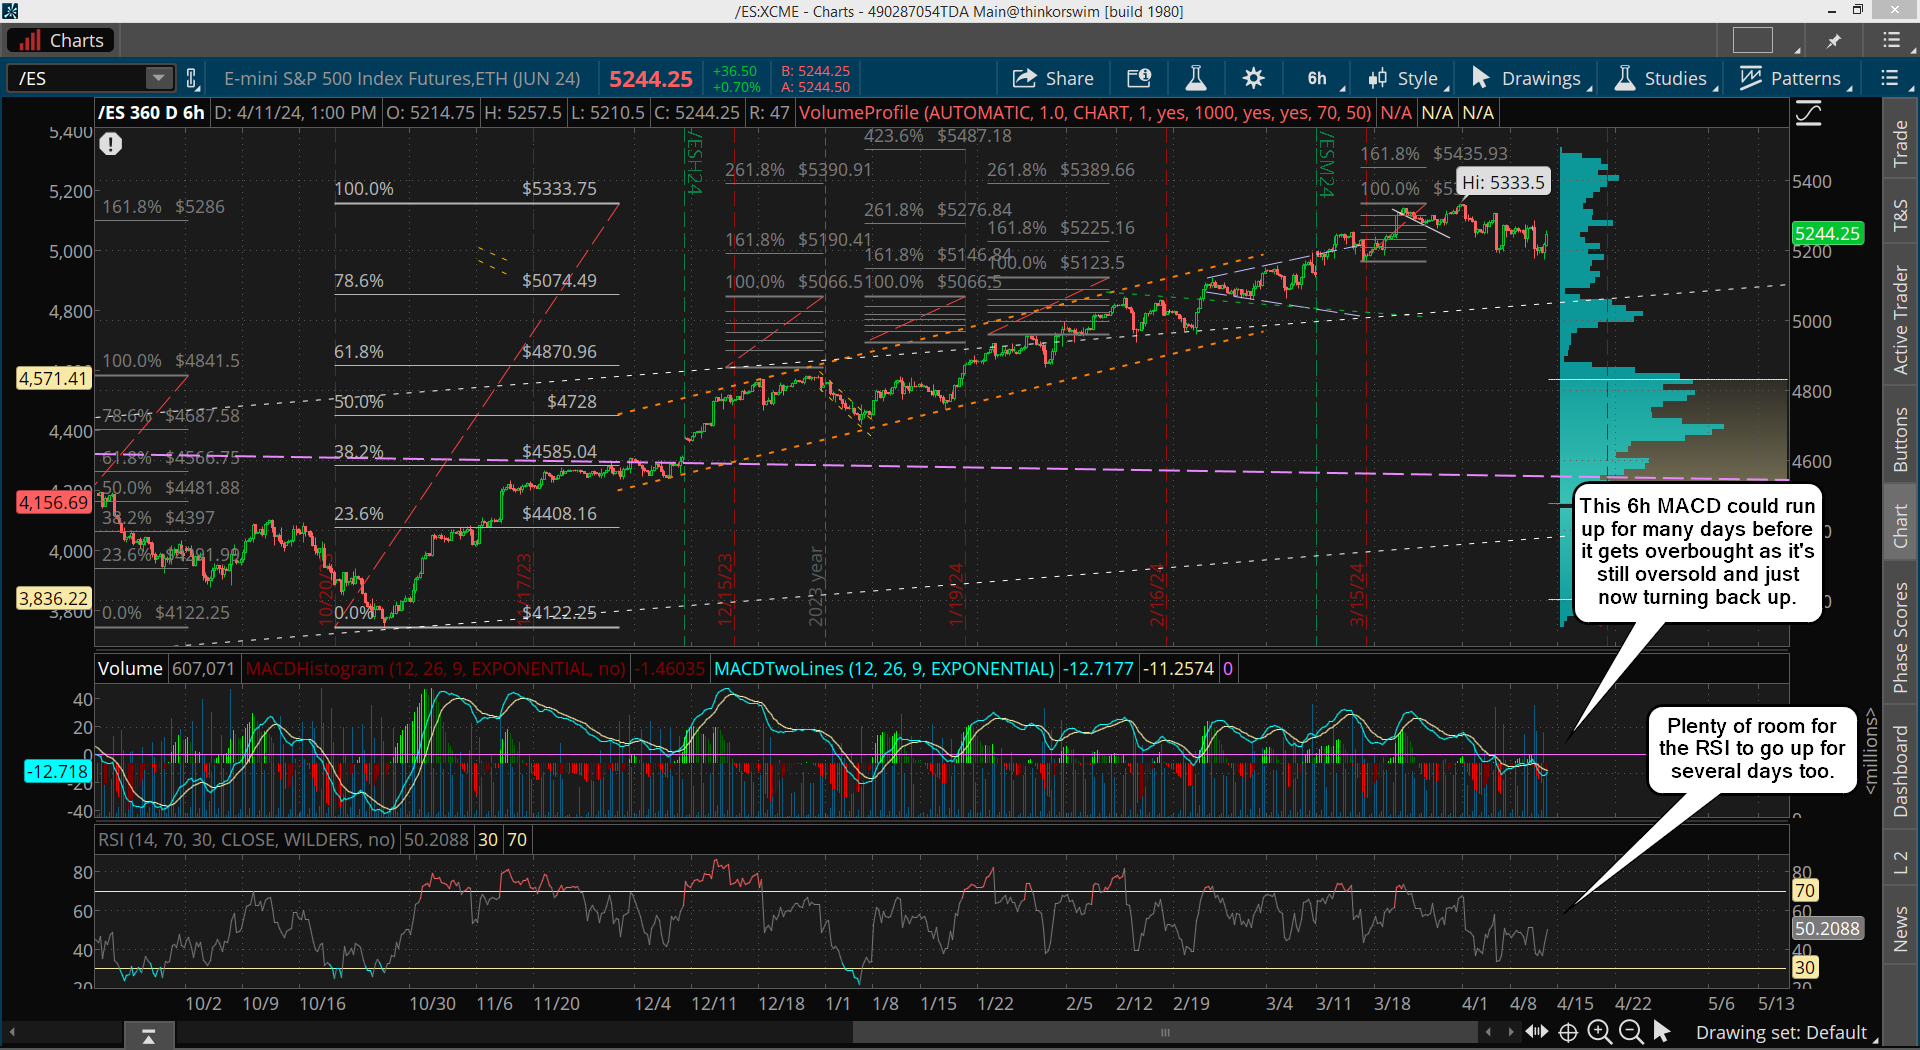
And here on the 6hr hour chart the MACD and RSI have plenty of room to run up higher today and early next week.
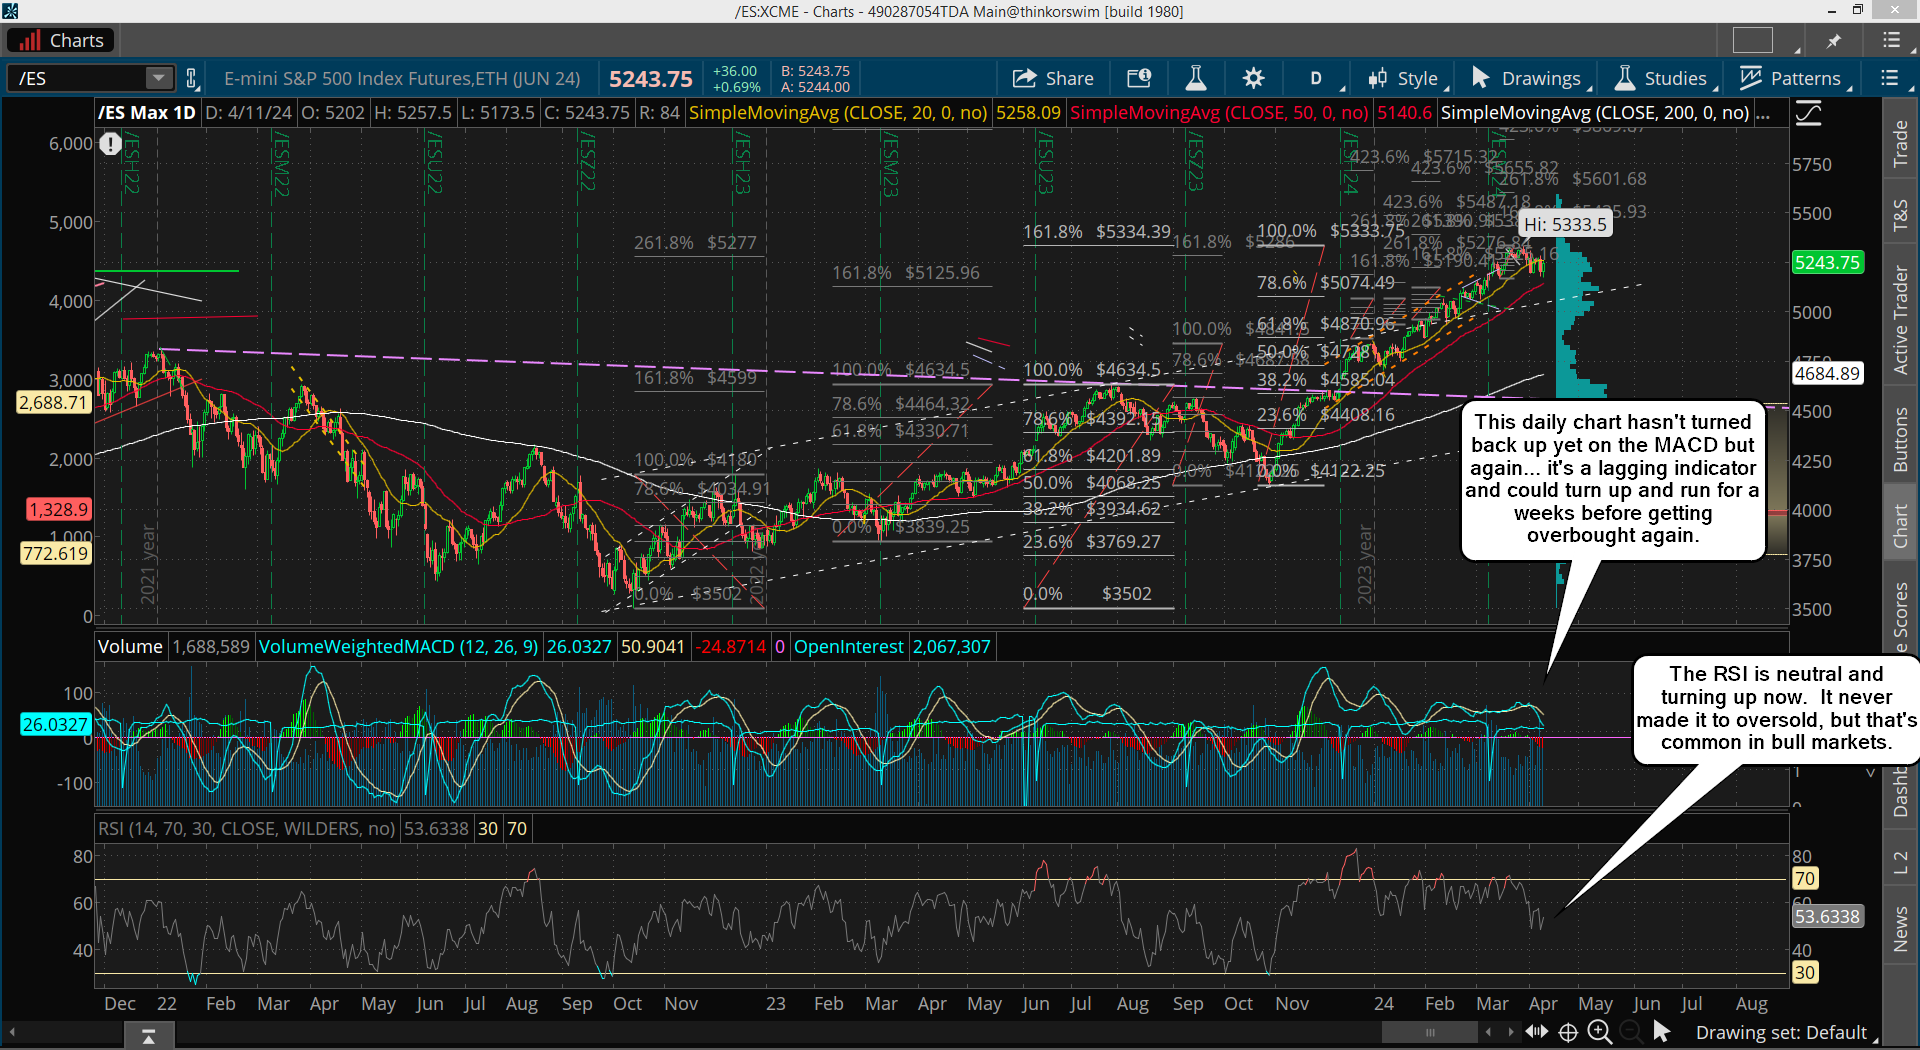
The daily chart never reached oversold, but that's normal in a strong bull market, which we are still in I think. The RSI reached the 50% mark and turned back up yesterday, but the MACD's haven't yet made that turn. That doesn't mean it won't, and it is a lagging indicator, so another 1-2 days of upside should hook it back up.
The entire week plus correction is a bull flag as well, so unless some other big negative news comes out I see no reason to expect any more downside. I went in to detail yesterday on "why" this pullback does have any of the patterns that real corrections have. Everything says it's just a pullback and not some 5-10% correction.
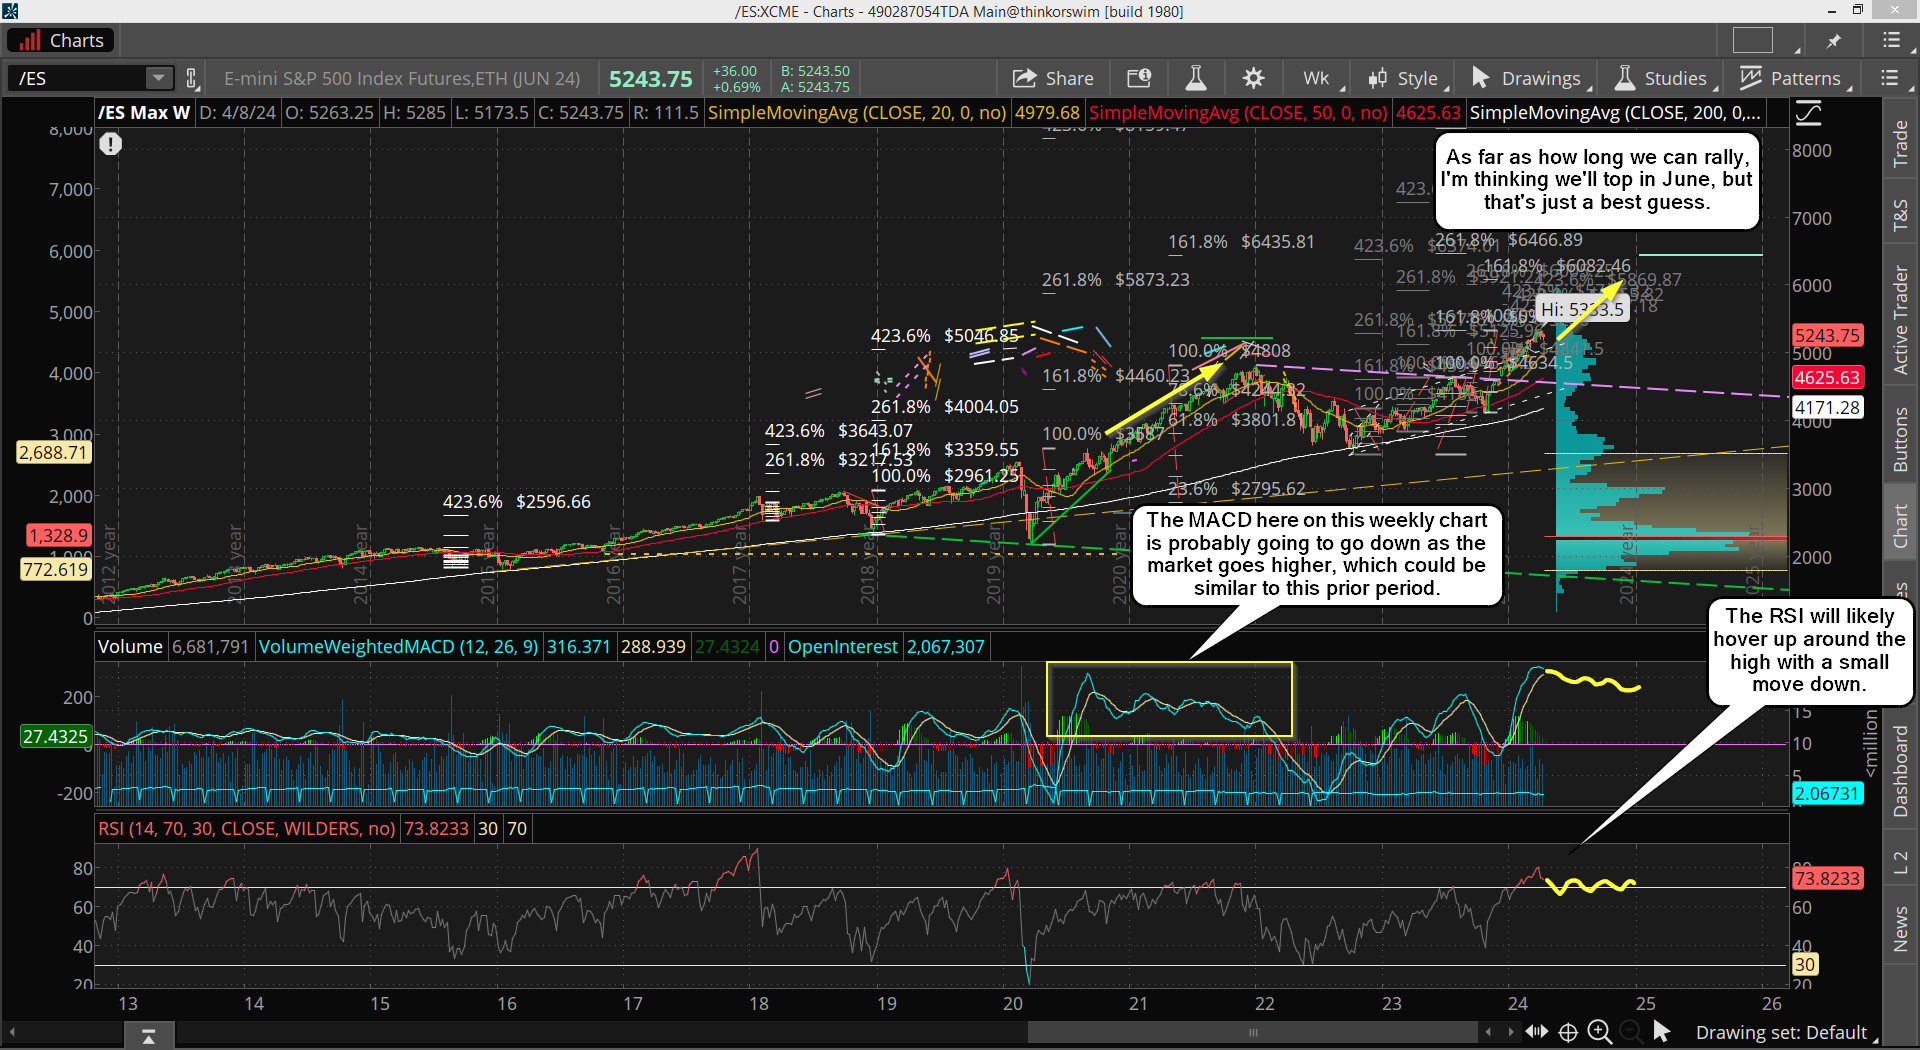
As for the weekly chart, it's still very overbought, but there's NO negative divergence on it, so I suspect we are going up into June or so "in price" and down on the MACD "in volume weight". The RSI will likely go down too as the market goes up.
Have a blessed day.

