I didn't write a post yesterday as there was nothing to add that wasn't covered on Mondays post. Same thing for this post as nothing is going on but sideways chop, which of course makes another bull flag. But, the "time" is running out for the bullish period as by the end of this week it will be over with from a cycle point of view and then the market will enter a bearish period.
So it doesn't really matter to me if the bulls breakout again from this bull flag and run a little higher as their time is coming to an end soon. Maybe we get that last squeeze higher tomorrow after the Jobs numbers and/or GDP, and then Powell speaks at 9:20 am too, so he might try to lift the market higher? It's a bull flag building so all it really needs is a spark to get it to pop but I don't think it will last past the end of this week, and if it happens it will just be another "better entry" spot to get more shorts.
This market is likely going to hold up into the end of this month and grind higher. I thought we might have topped last week but there's still too much "time" left before the bullish period turns to a bearish period. It could drag out into early October a little too, but that's about when the bullish time period (cycle) ends and the bearish coming in play. Any early pullback this week will likely be reversed as the bulls are still in control for another week and early next week. They never make this easy (shocker... LOL), but I still think we will get a nasty drop before the election. It might not even start though until the second half of October. But weakness will start to come into the market by mid-month. Let's zoom out and look at the big picture...
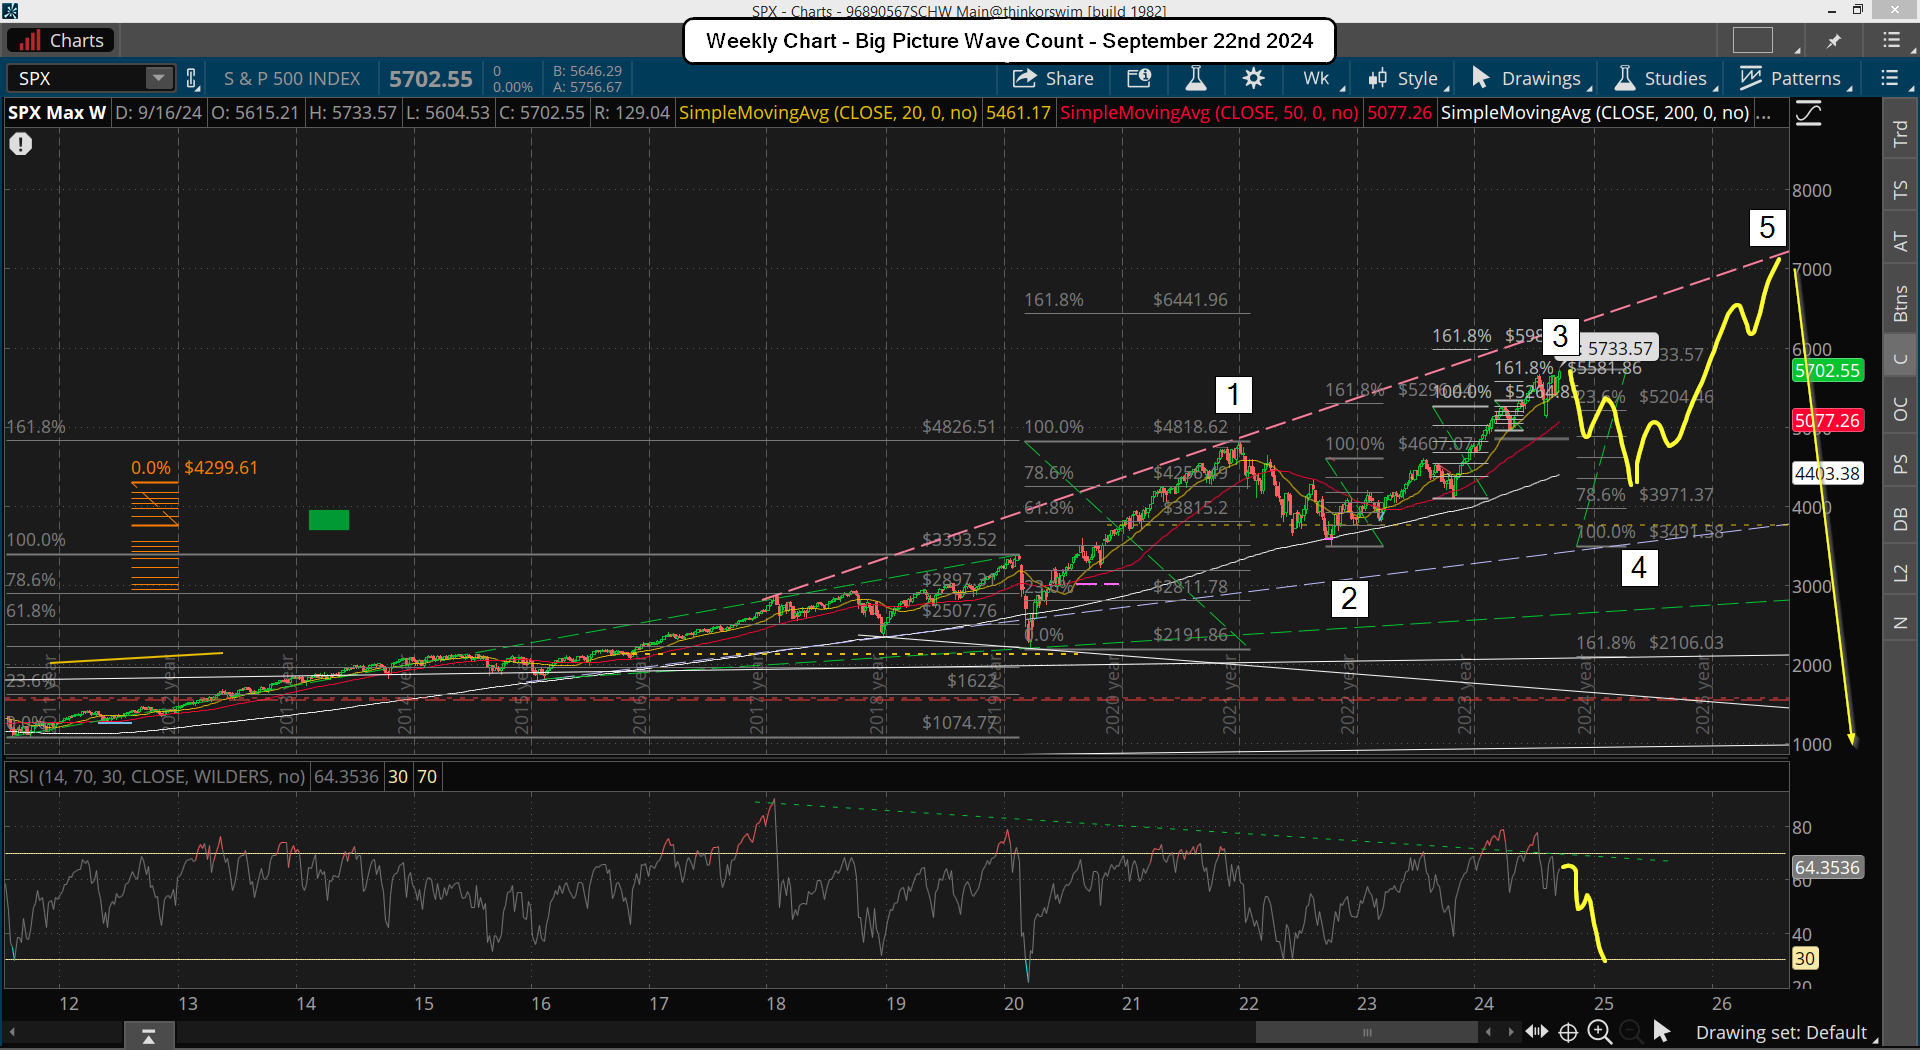
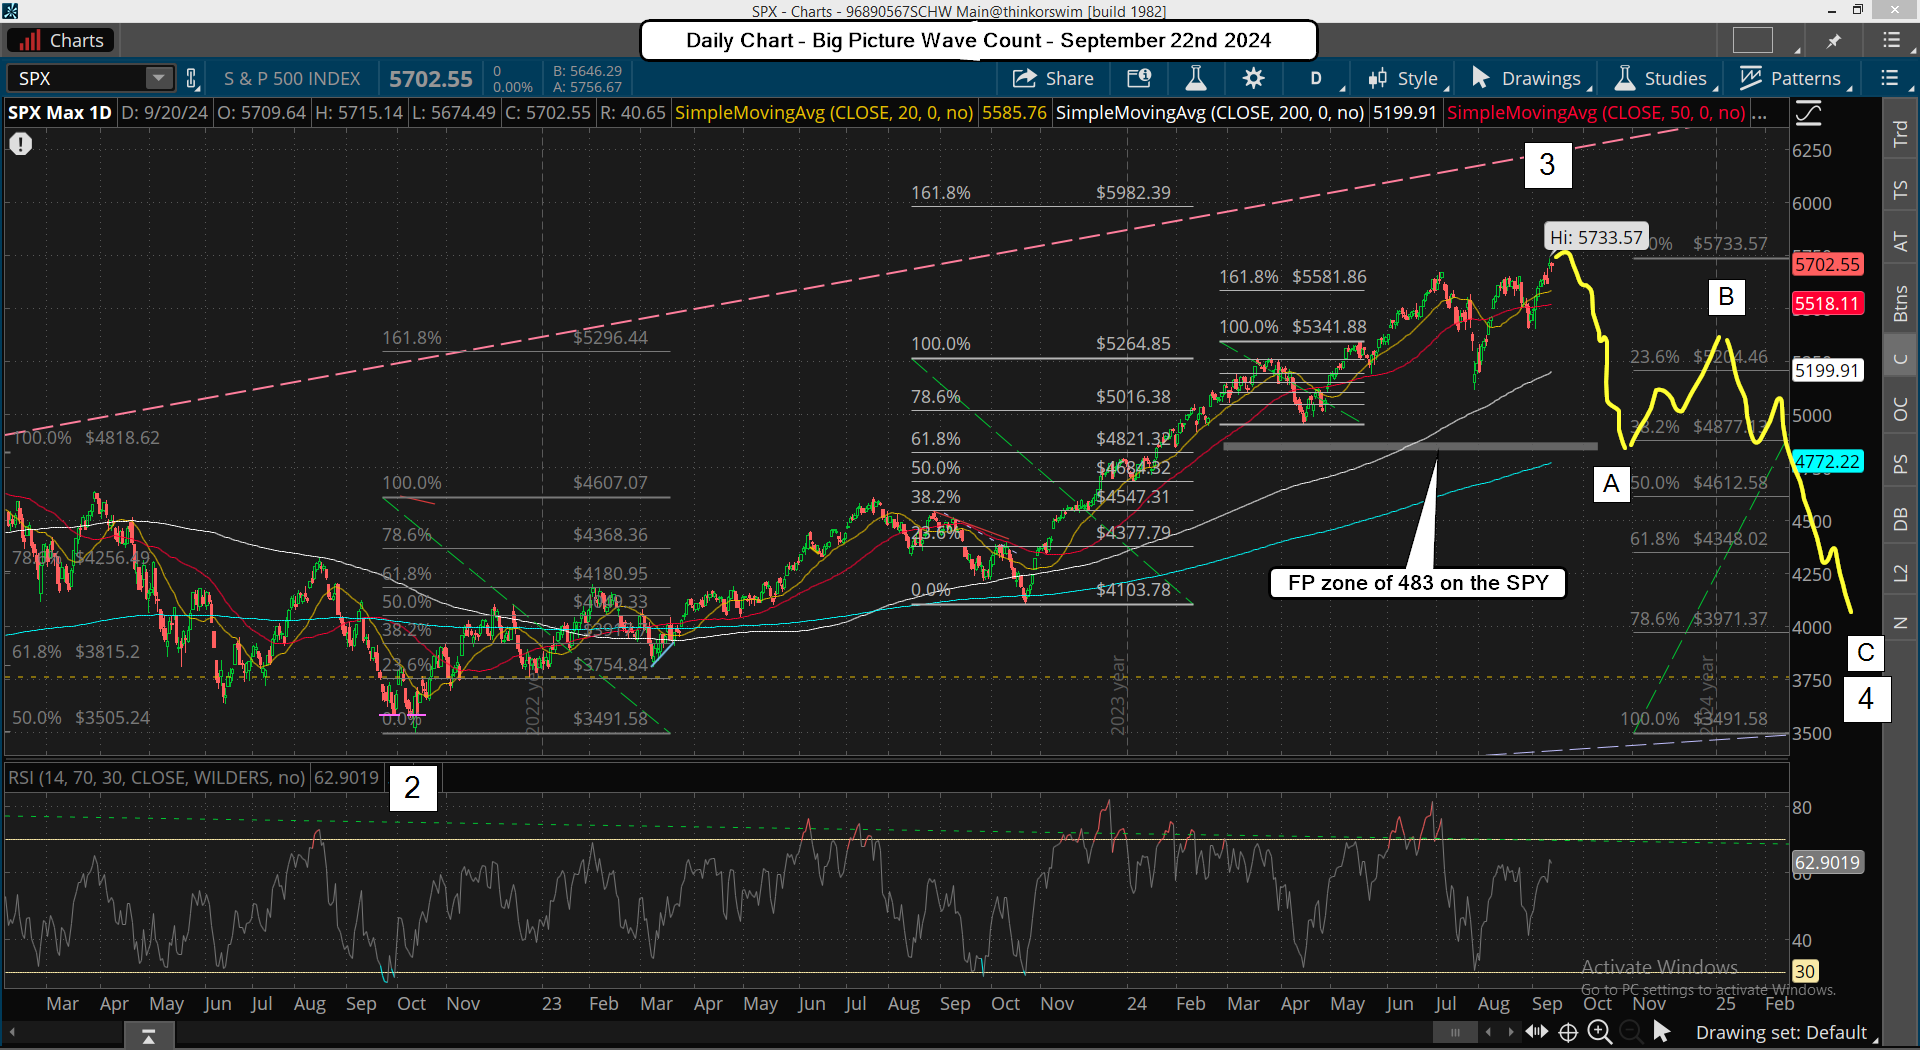
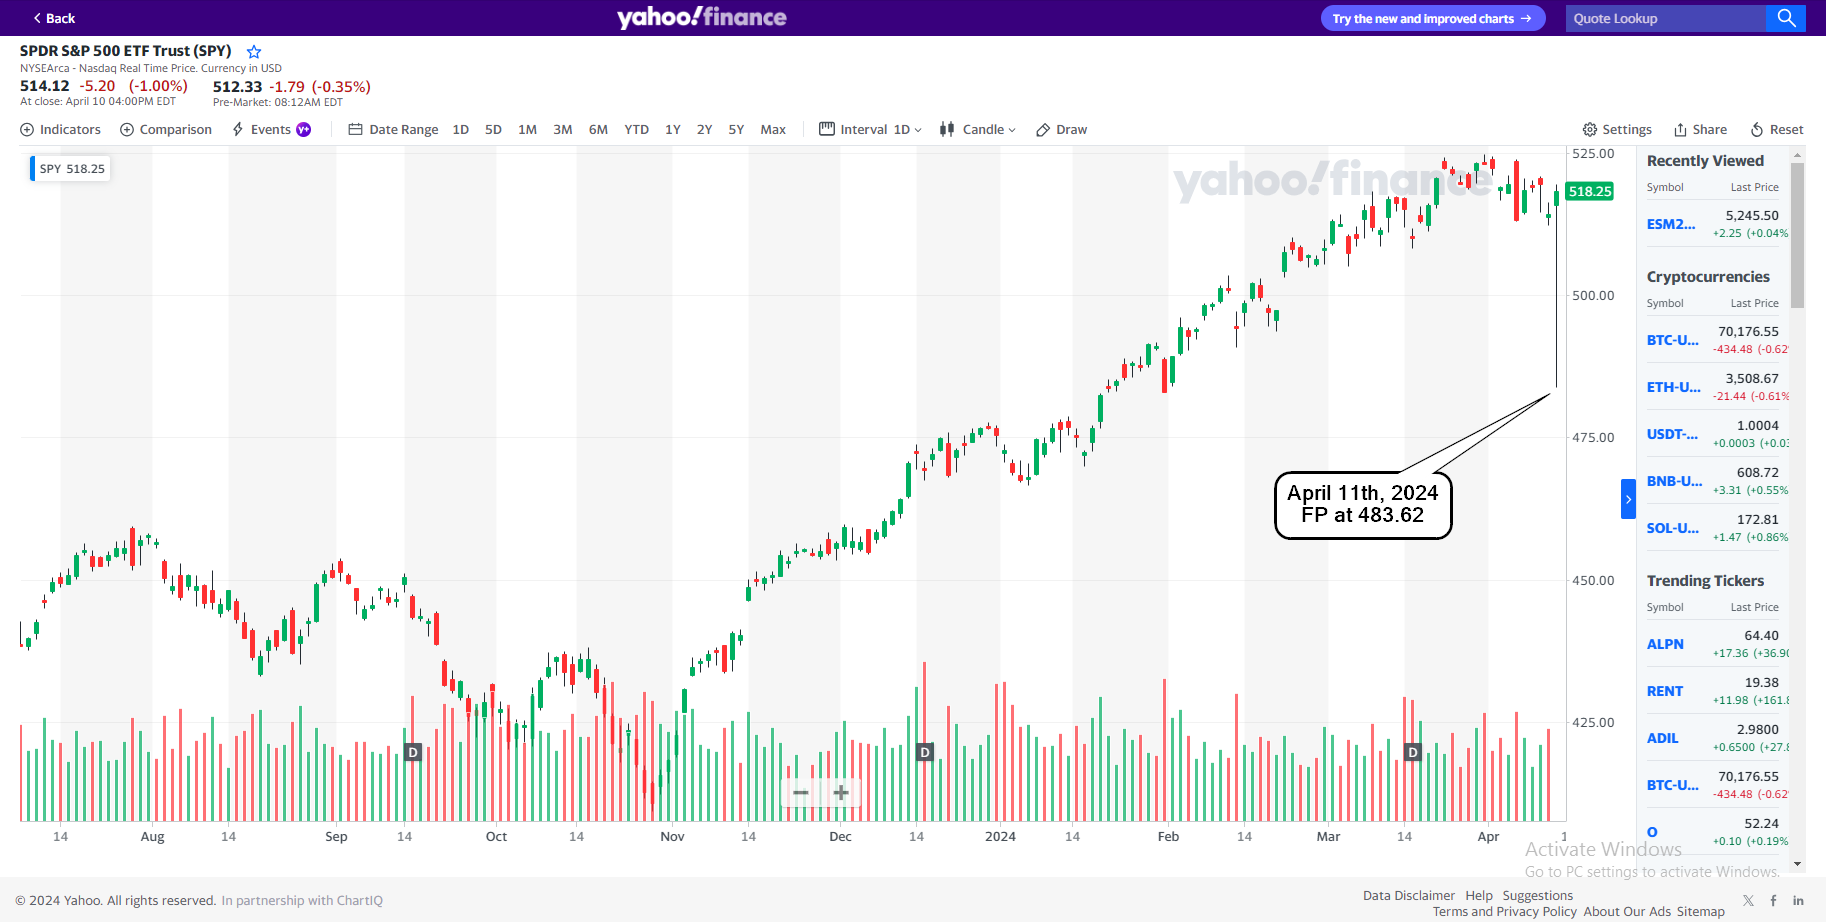
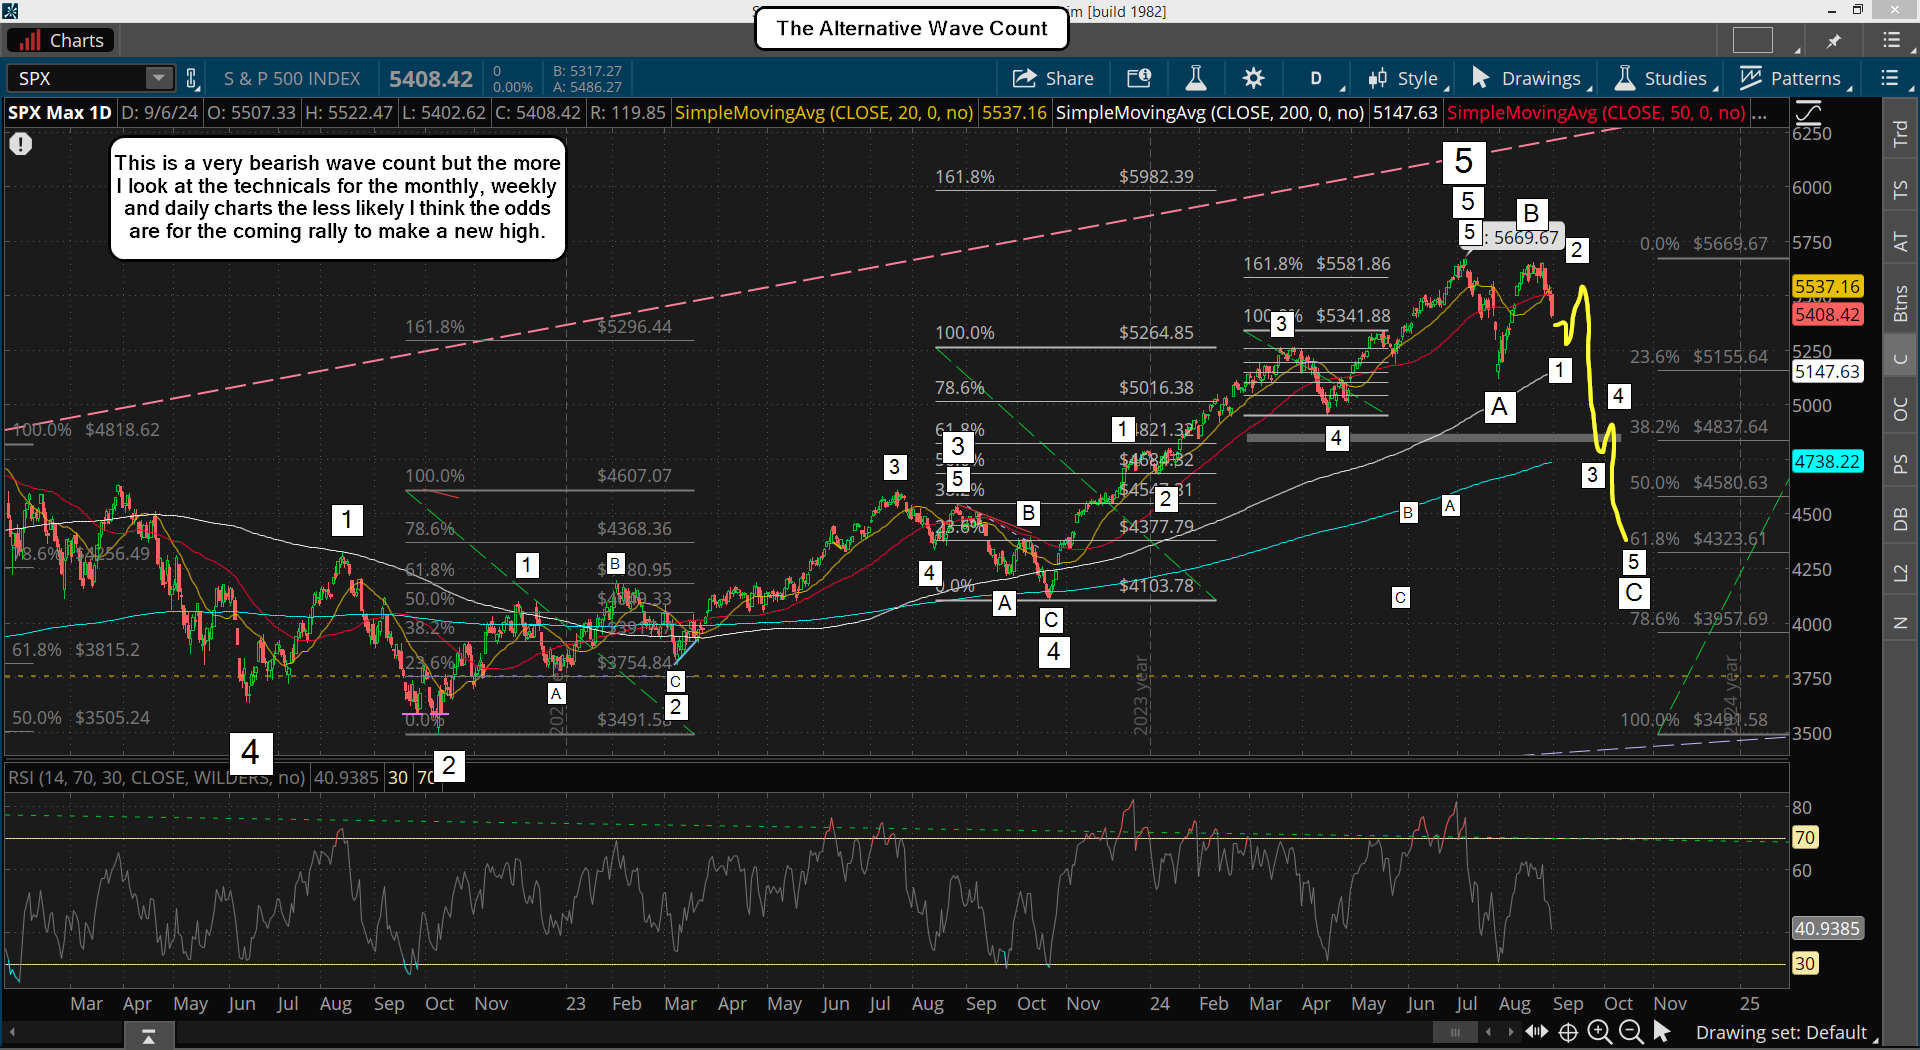
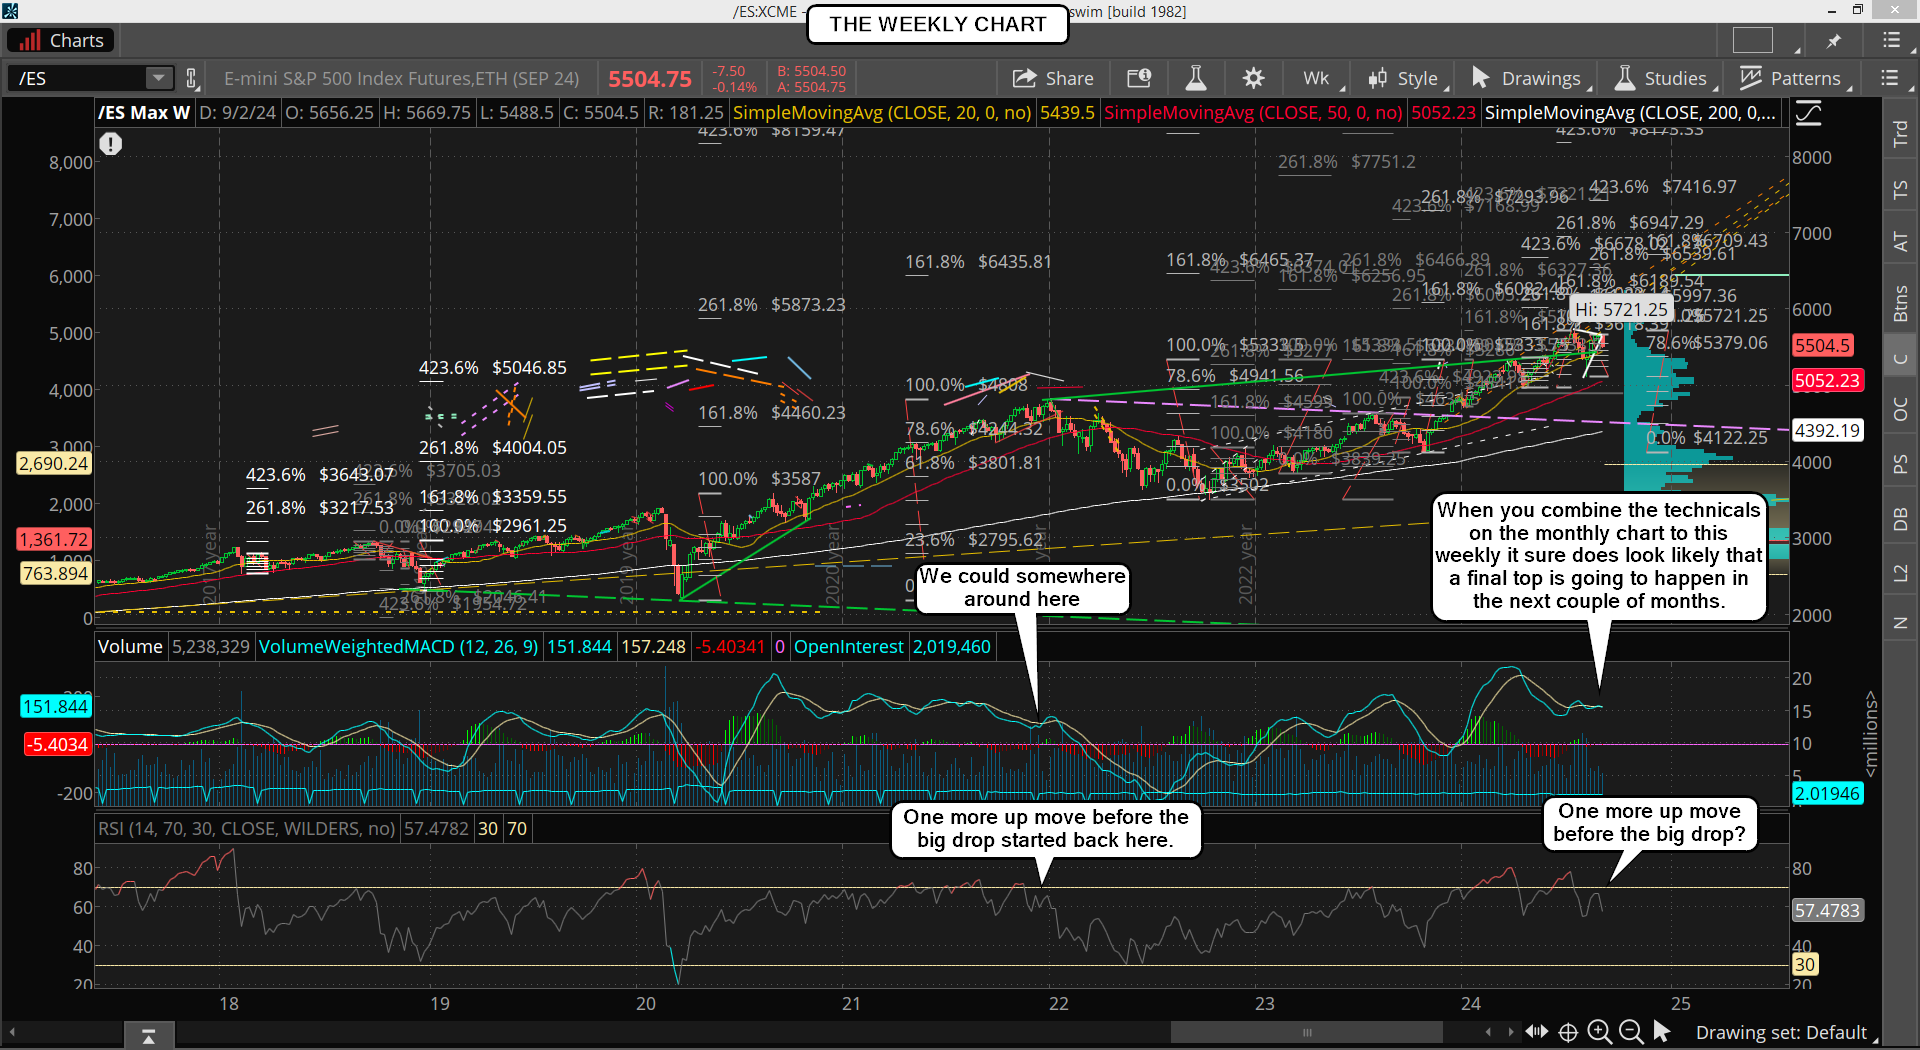
On the SPX weekly chart are my long term thought. I believe we are going to have an ABC correction into 2025 which is a wave 4 of a much larger degree with the wave 3 up starting at the 2022 low. The final high for the wave 5 should be in late 2026 or early 2027. At that point we will see another 1929 style crash. For the now though the first A wave down of the wave 4 should hit my FP from the Yahoo site back in March of this year. It's 483 on the SPY, which of course should be pierced and then I think the A wave is done. From there I think we rally up 50%+ for the B wave into the end of the year, and that will be followed by the C wave down in the first quarter of 2025. I'd look for the 200 week simple moving average to be hit and pierced but the 2022 low should NOT be taken out. My guess is at least 61.8% up to 78.6% will be the retrace low from 2022 low up to the current all time high. Now let's look at the daily chart below...
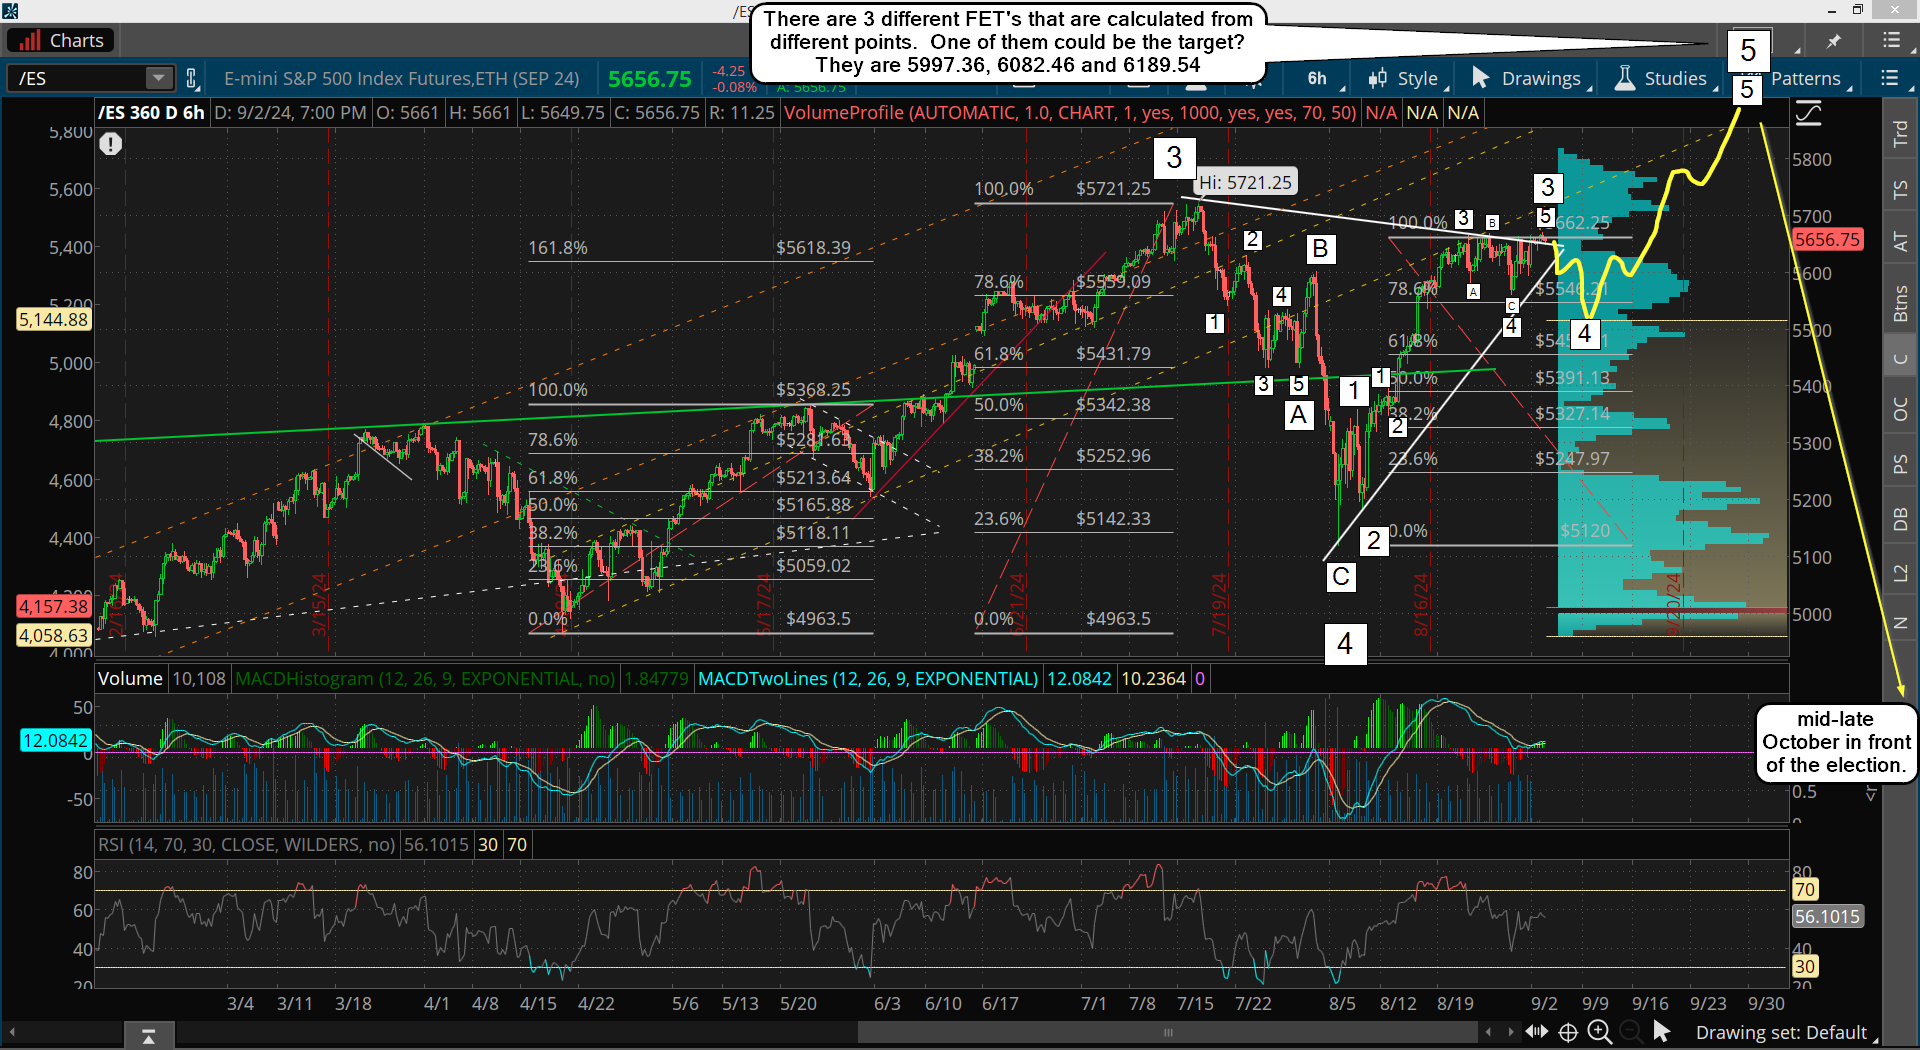
The daily chart above shows you my thoughts going into the end of this year and early 2025. For the short term this week still has a bullish bias to it, so I don't expect to see much happen but chop. We could pullback any day this week for a brief shakeout but afterwards it should go back up again. The 5800 level (and a pierce through it) on the ES is like a magnet for the bulls. We could see 5820-40 hit in a blow off move into this Friday or next Monday as the month closes out. After that we should start to see the early parts of the expected correction for the A wave start. It would be the wave 1's and 2's of course and might be tricky that first week of October. Then mid-late month is when I'd expect to see the wave 3, 4 and 5 of the A wave down take us to the 483 SPY FP.
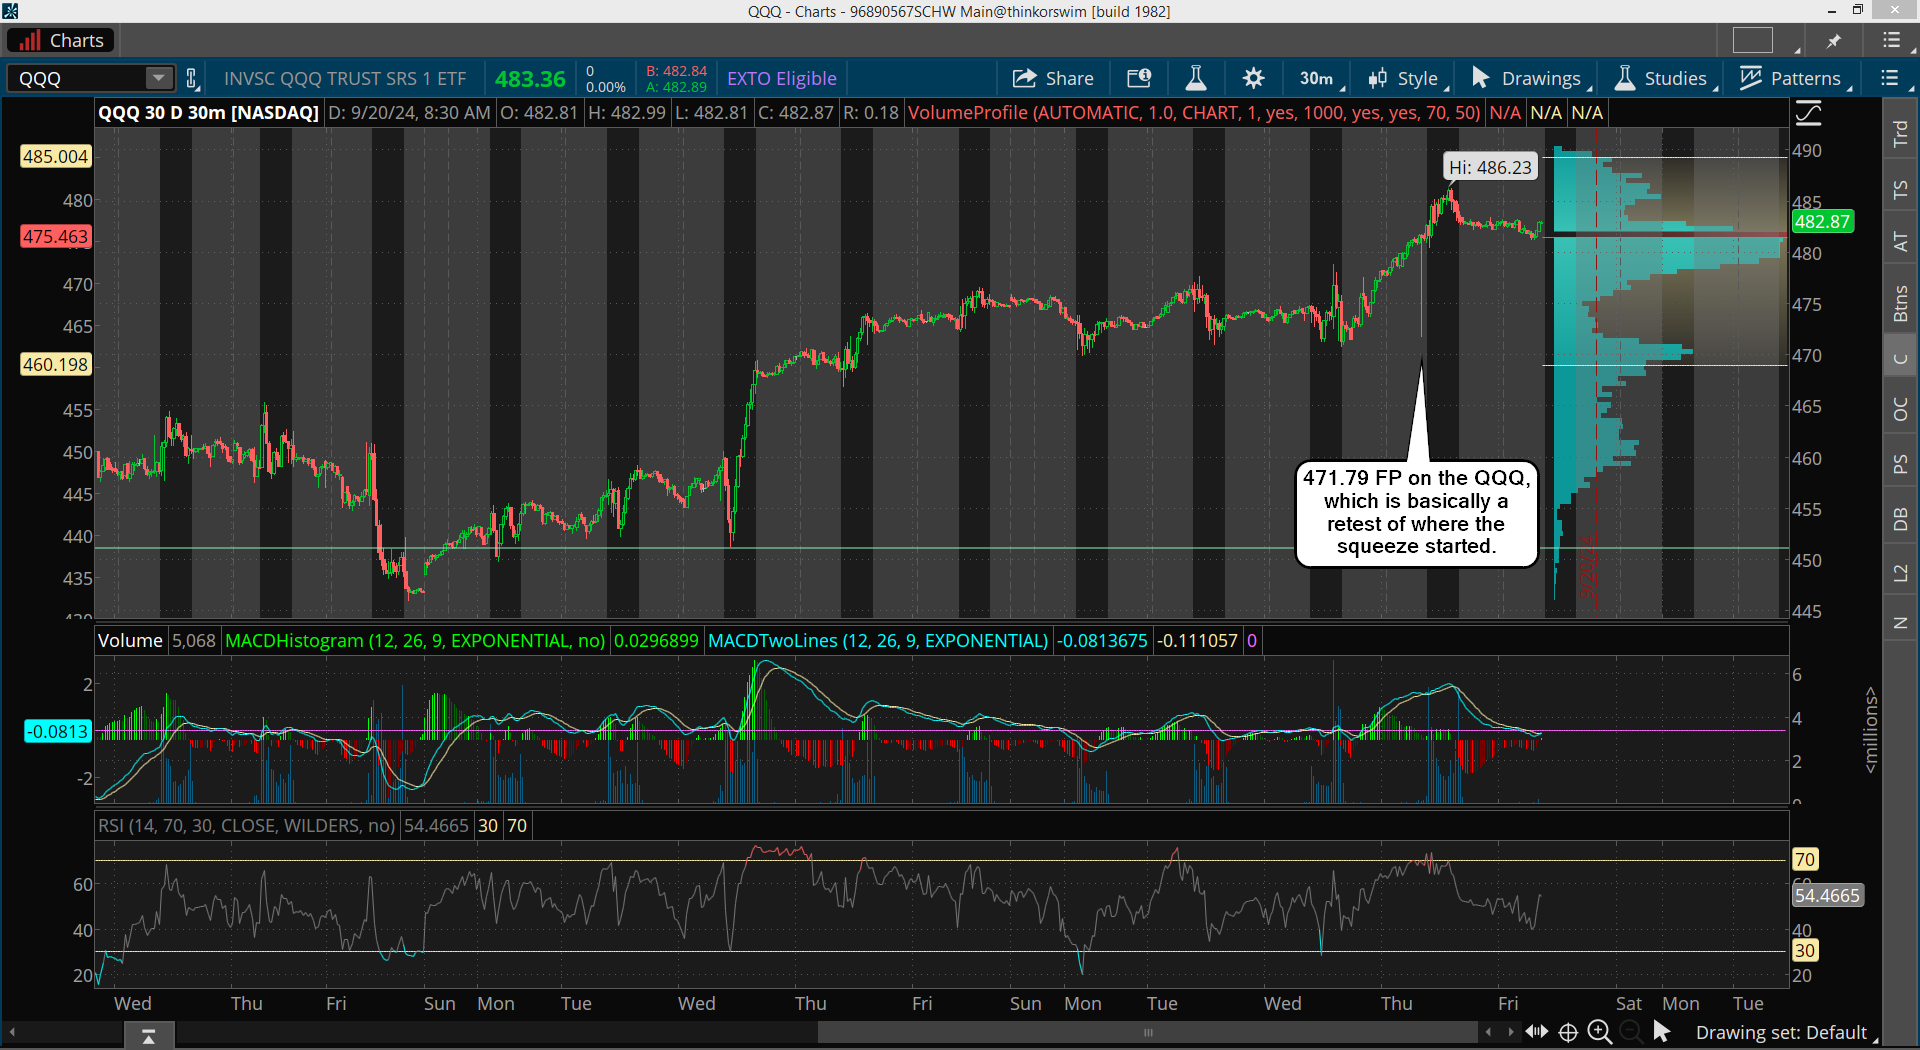
Lastly, on the very short term, there was an intraday FP on the QQQ that should be the target low for any pullback this week. That's an exit for trapped shorts I think, and I'd wait for the last squeeze to 5800+ into the end of this month before attempting to short again. Here is that FP, which is basically targeting the closing area last Wednesday.
We hit my zone of 5775-5800 on the ES, so we could have topped? If we go any higher it shouldn't be very much, like a 10-20 points... "Maybe". Most likely though we pullback some, and while it might be choppy at first I expect the August 5th low to be tested (probably taken out) by the end of October.
The beginning will be full of drops and squeezes for the wave 1's and 2's (or A's and B's) as it sets up the C down later next month. Meaning next week might start the pullback but it could reverse back up again late in the week to setup early October as the best time for a big drop. As for today, I don't have much opinion as it's OPEX and could go dp anything.
We got really close yesterday to the 5775-5800 zone that I was looking for on the ES, but it miss by a little. Now this morning we've hit the zone, so this should be it for the rally I think. My thoughts are that we'll hold up in this range until the end of the week. Remember that most OPEX weeks are choppy or bullish as they need to make all the puts expire worthless they tend to hold the market up until that happens.
Tops are a process and take their time to complete and then out of nowhere a nasty drop happens. I think it starts next week for the first leg in it, which could end by the end of this month where "turns" commonly happen at. Then a bounce the first week of October and mid-late October is where the really nasty drop happens.
Well, today is the big day where most everyone is expecting the Fed to lower interest rates by at least 0.25%, possibly 0.50%. Will they do it or will they shock the market and do nothing... or worst, raise them! I don't know the answer of course but the market has made new highs on the ES and SPX and the DOW too.
But not on the Nasdaq futures or cash, nor the Russell. So there's divergences forming now between the indexes and I don't see them making a higher high anytime soon. As for what will the Fed do today... I don't know. But the rally up into the meeting scares me there's a ton of people looking for this rate cut and are expecting much higher prices afterwards. When the masses are all thinking the same thing I have to think it's not likely going to happen. Can we go higher afterwards? Sure but I don't see a run up to 6000+ like I previously thought was possible.
Maybe we get a squeeze to 5800 but then again... maybe they surprise everyone and the market tanks. Most of the time the Fed doesn't ever do anything to shake up the market, so if things go as "usual" then it will be a non-event and we'll continue to grind higher until the daily chart gets too overbought. Right now it's not and can push higher, but the weekly chart is still bearish, so any move up from here will be similar to paddling upstream in a canoe... meaning it's not going to see big 200-300 points moves in a few days, but it can go up a little more.
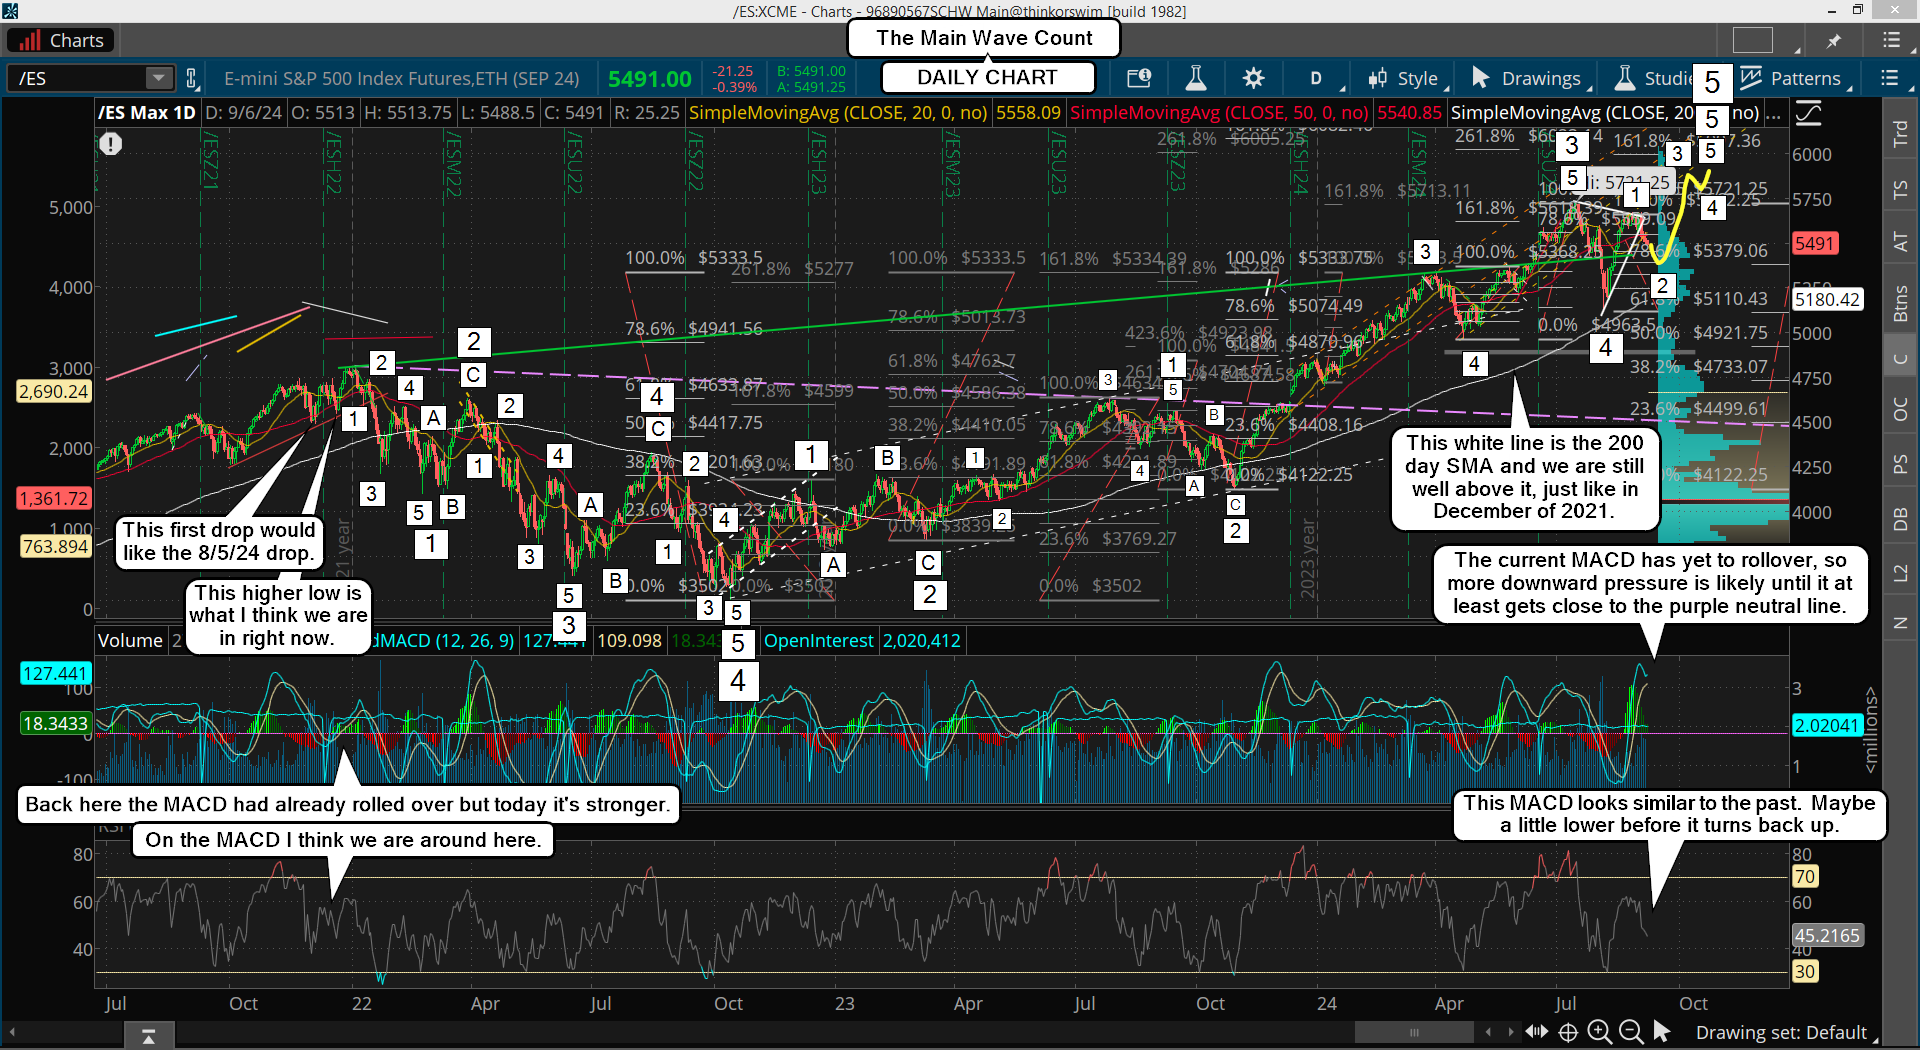
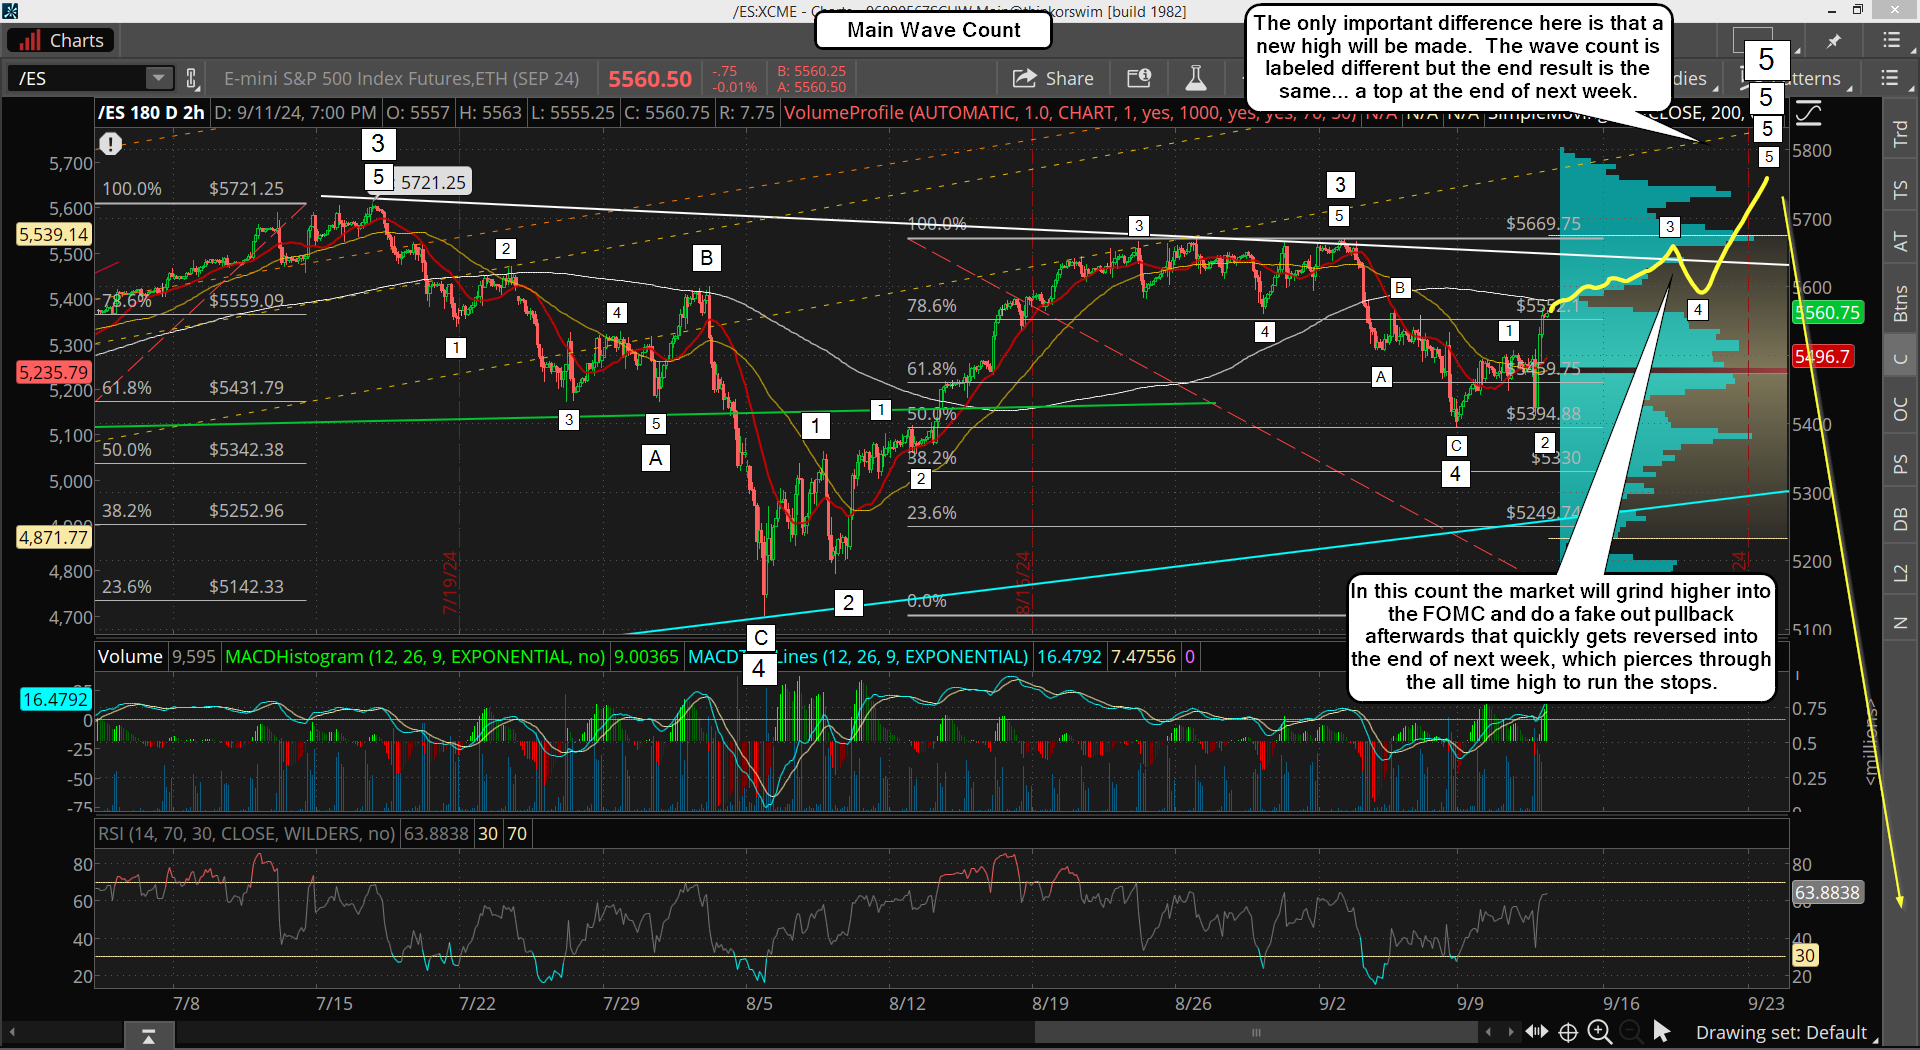
Here's my main wave count from 9/6 and it could still play out... but I don't see 6000 as that's too high and too predictable.
So, assuming there's no surprise by the Fed, I think we are going to need more time before this market rolls over. This looks like it could drag out into the end of the month. Possible we squeeze to around 5800 and then pullback a few hundred points into the end of the month. Then rally back up one more time for a lower high into early October, which would be a wave 2 with the first pullback a wave 1 down. Then we see a 10%+ drop later that month. That's my thought on it.
Just a hair until the July high now on the ES, so it looks likely that it will pierce through it to run some stops. But I must point out that the market is still waiting on the FOMC tomorrow so we should not get any big moves until then.
And speaking of the meeting, the herd is expecting a 0.25 rate cut with a possibility of it being 0.50, which is part of the run up into it as people front ran the rumor. It smells of a trap to me as if the masses all think the same thing what happens if they are wrong? I mean... what if they don't do any rate cut, or cut more then 0.50? I'm simply trying to take the other side of the herd and something is off here in my opinion.
Let's not forget the short term technicals that are now overbought with the weekly chart bearishly aligned and pointing down. The daily is mixed so it's not giving any clues, which means it's just the short term right now and the weekly chart that is in focus.
Nothing really to do right now as we wait on the Fed tomorrow. It's very possible that it will be a "sell the news" event.
We are up against resistance from the falling white trendline and the horizontal prior highs around 5660-5670, so there's not much to do right now but wait until the FOMC this Wednesday and see where we are at. Too me, if we are still up in this range, meaning we don't pullback much, I have to think it's a sell the news event. If we pullback in front of it, to say 5550 or lower, then I'd look for some last rally into this Friday to attempt to make a new high again... but I really don't think we will get through it.
I feel like this market is setting up for a surprise crash like drop starting next week that no one will see coming. Others think we'll top out into mid-October but I just don't see it. I could be wrong but I think a big surprise is coming, and well before the November election. Not much more to add at this point as we wait on the FOMC.
Moving up as expected, but we are getting close to major resistance again. We should NOT get through it on the first attempt, and we might not ever get through... who knows for sure? I move focused on "when" then "price", and I still think that we will have a last squeeze up after the FOMC next Wednesday. The price isn't something I can forecast.
Short term though the charts are getting extended on the upside, so while many Friday's have that bullish late day move it might get skipped today? Then next Monday and/or Tuesday is where I'd expect to see some kind of pullback in front of the FOMC. After the meeting though I think we get a squeeze that could pierce the current all time high, or fall shy a little and lure everyone into thinking the bottom is in.
But the technicals just don't support it from what I see. We could have some surprise event over the weekend of the 21st/22nd that would cause a "gap down and go" move... like a dollar revaluation possibly? I don't know what the event will be but something big is very likely to happen before the election, and I think it starts the week of the 23rd.
Have a great weekend.
P.S. A friend sent me this video this morning...
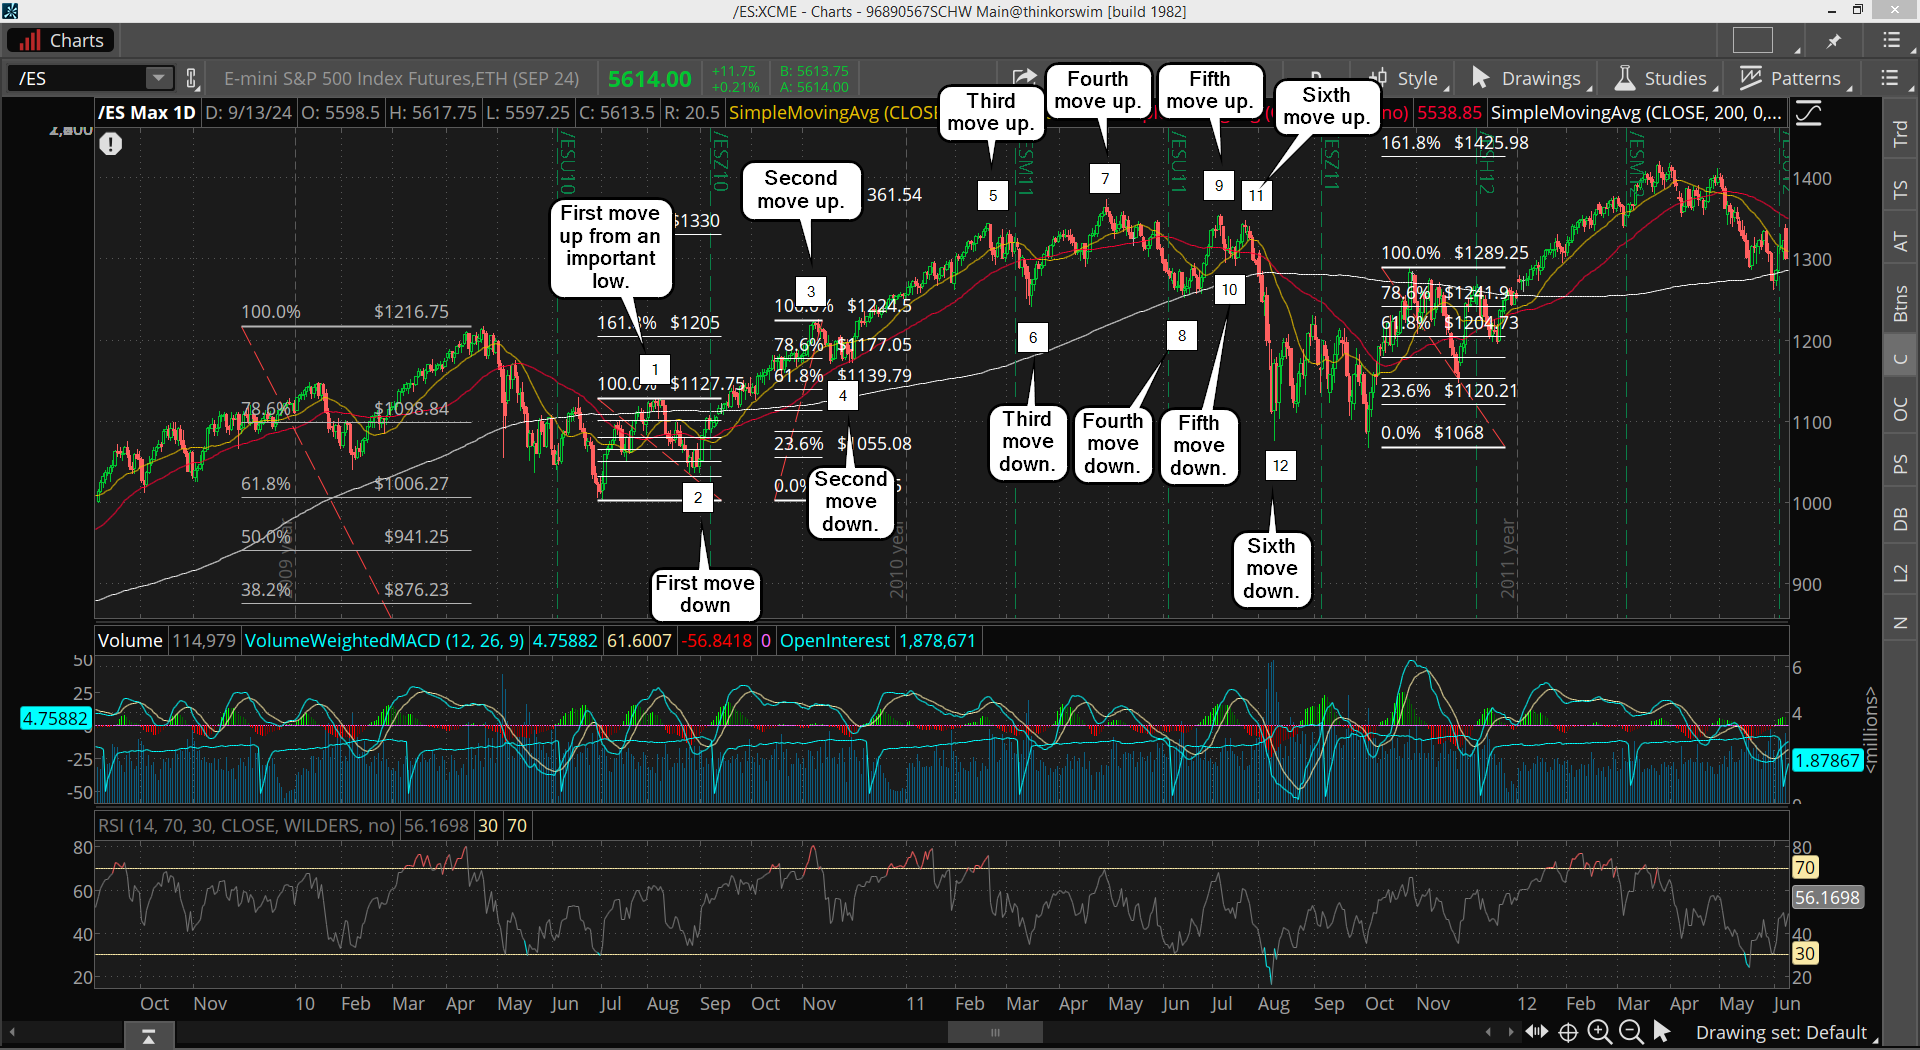
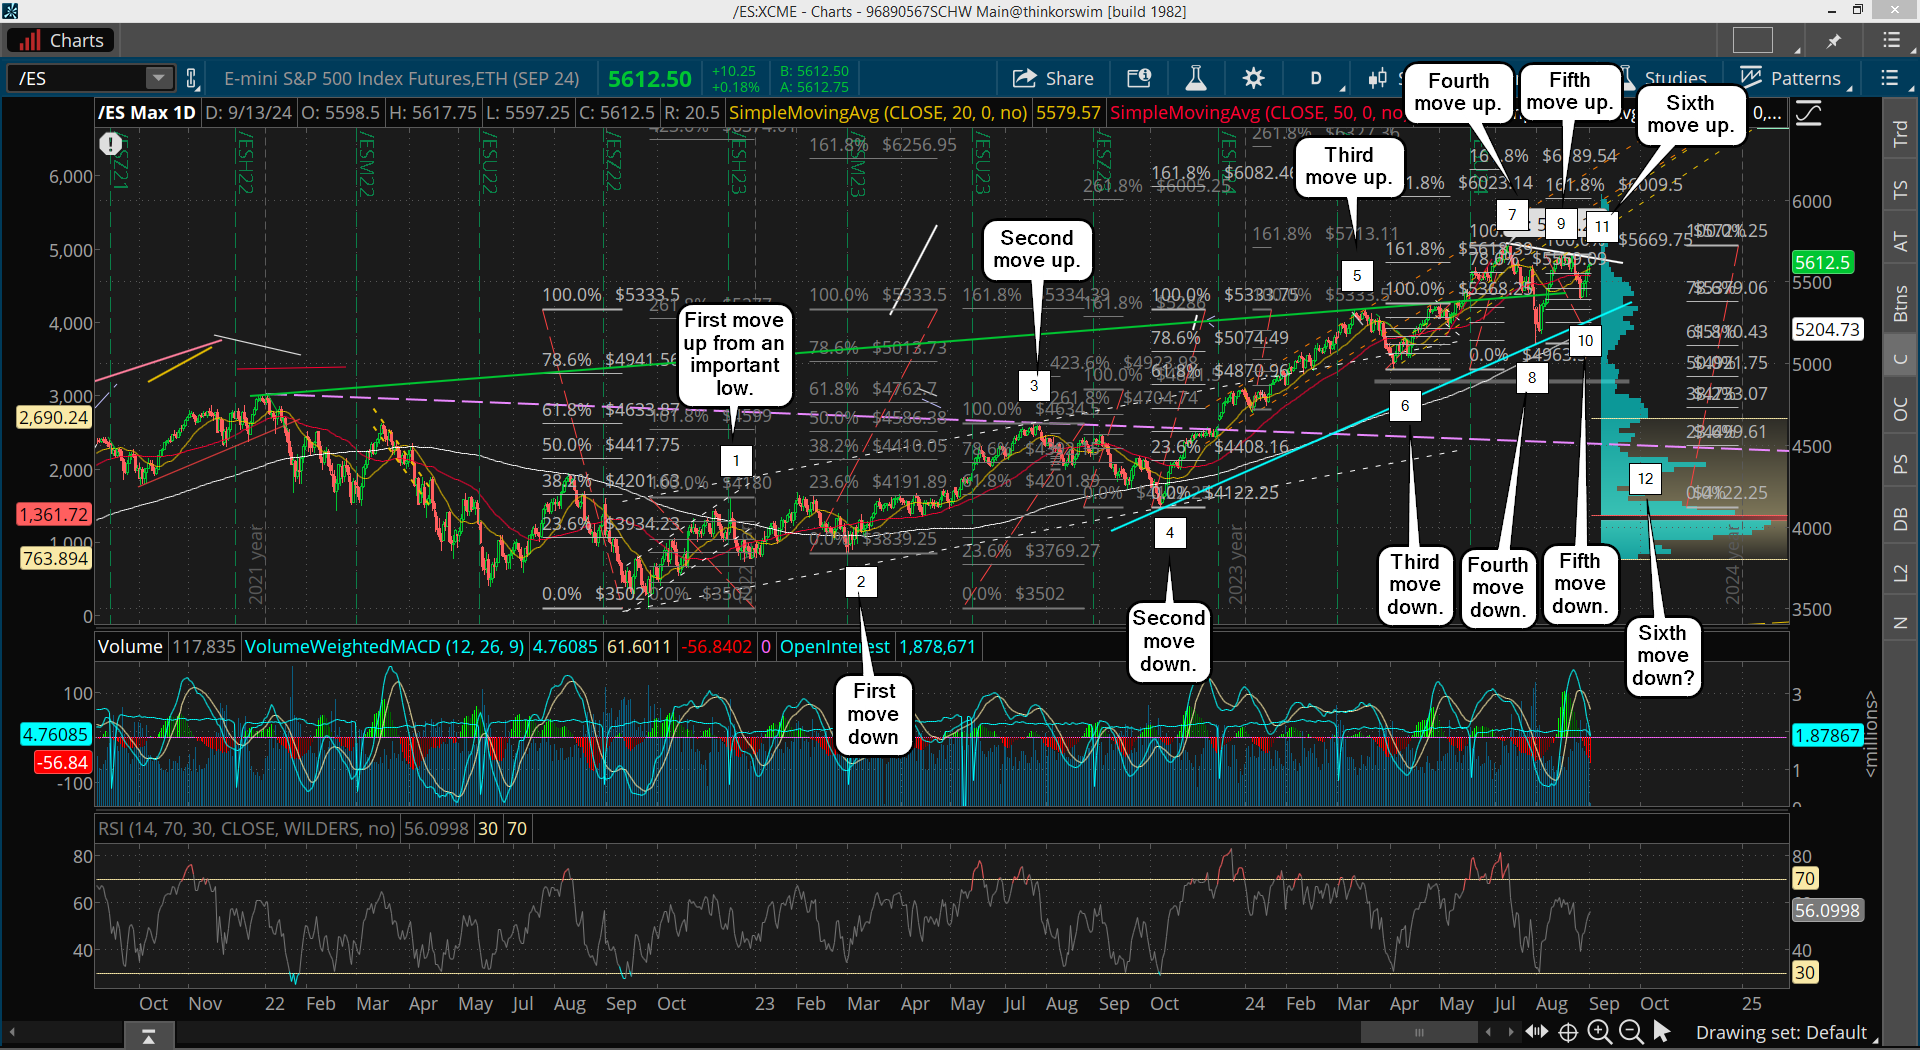
While I can't disagree I tend to think we look like 2011. Here's the charts...
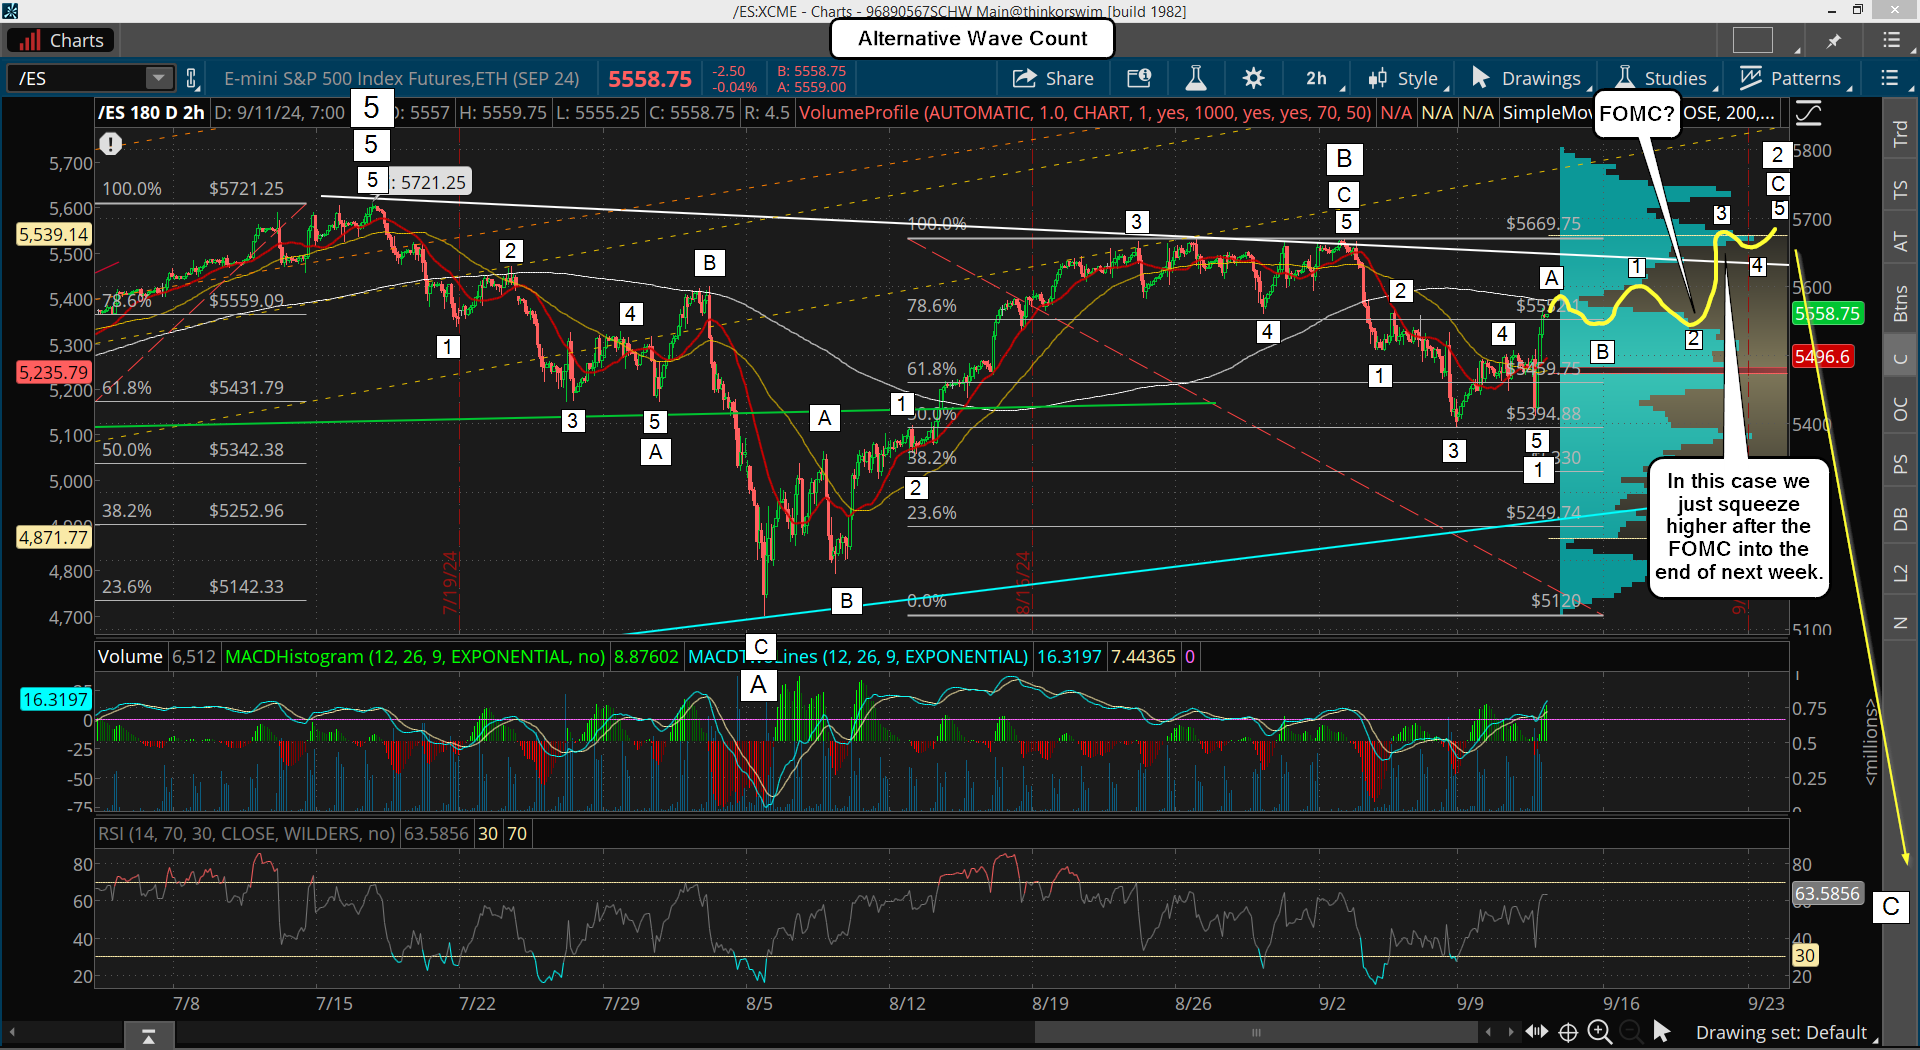
We got the pullback I was looking for yesterday, which turned out to be a higher low, which is fine for a truncated 5th wave down inside wave 1 down, inside wave C down. While the squeeze up afterwards looks and feels like a wave 3 or C (and it could be?) I lean toward it just being wave A up inside 2 up of C down. Now... if this wave count is correct then this wave A up should have a B down at some point in the next few days. Or it goes sideways for a day or two, which will also qualify as a B wave pullback. Then next week we get the C wave up inside wave 2 up of wave C down. Here's that wave count, which again is called my Alternative Wave Count.
Now my Main Wave Count is pretty similar except that a new all time high would happen into the end of next week. The wave count would change a little but the end result would still be a large crash like drop would follow later this month. If a new high is made the C wave drop would just be delayed until October and the A wave would happen the week of the 23rd, which would likely bottom at the end of the month where we'd get a B wave up for several days around the first of October. It would then have the large crash like drop into the middle of the month or so. Here's that wave count.
While I'm still labeling the lower high scenario as the Alternative Wave Count, which means my lean is for a new all time high for the Main Wave Count, I can't overlook the 666 code that suggests the high is in now... at least for the SPX cash. Maybe the ES futures makes a slightly higher high but the cash doesn't? That's possible for sure. But either wave count points to a high at the end of next week.
We could see some movement today as the CPI is out, so that could move it up or down. Then tomorrow we have the jobs number, which again could move the market. I don't have any foresight on which way it will go but I still think we'll have one more pullback before a rally into next Friday. My guess is that we are choppy until next Wednesday when the FOMC happens. So we might do some wave A up and B down in front of it and the C up happens afterwards, which would complete wave 2 up inside C down. That's all I see for now.
A lot of nothing yesterday, which is to be expected. There's not much to add here as we could retest the low again, meaning last Friday was some small degree of a wave 3 and yesterday was a wave 4 bounce. If that's correct then we could see another drop for a wave 5 to finish this leg down, and then we rally next week for that wave 2 up inside wave C down.
Do we have to have another move down first? No, it could have been finished last week but usually there's a retest of the low for at least a higher high but usually a slightly lower low. Either way there's nothing to do in my opinion until the end of next week where I think we'll see the best short of our lifetime.
If the market crashes the week of 9/23 into October no one will see it coming but the insiders. Whether or not we do a reset in the currency is unknown but there's a lot of technical reasons to suggest a nasty drop too. Below is another video from Bo Polny that again points to that week. I see in the technicals, so something is coming...
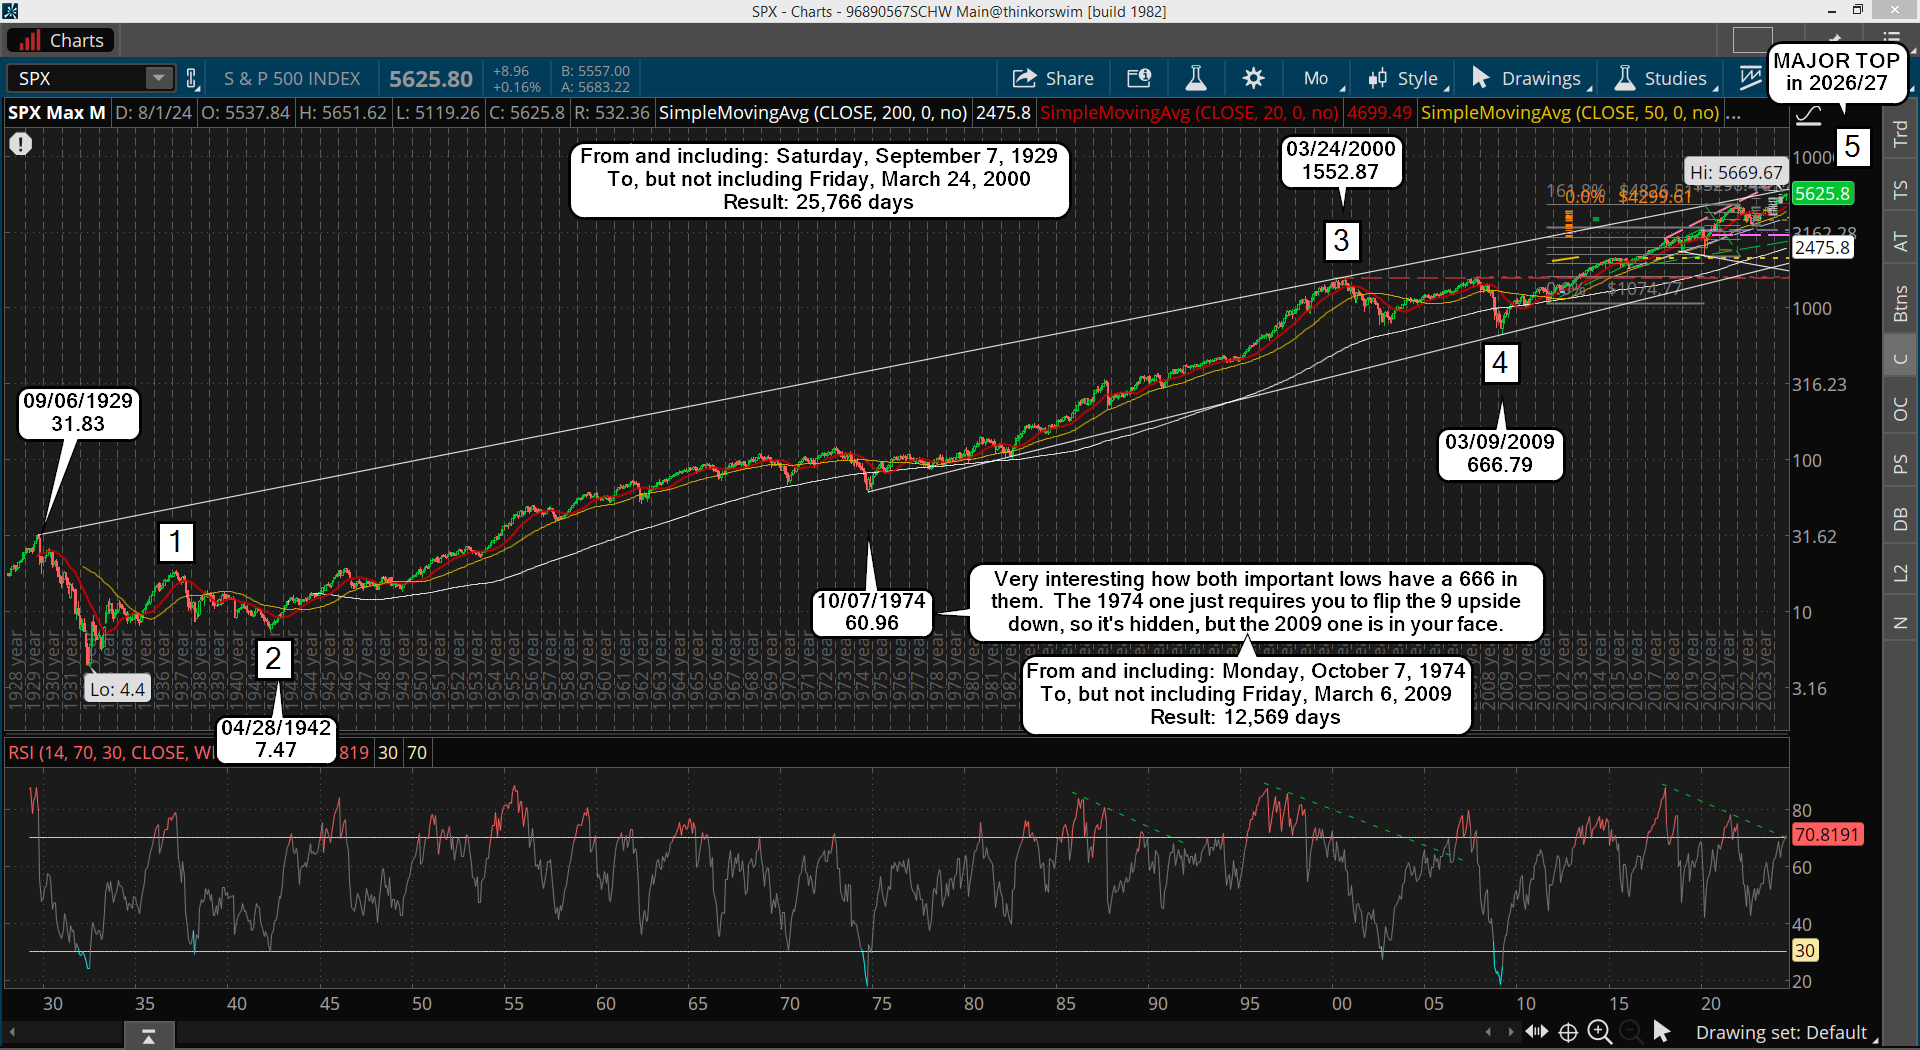
The SPX cash index hit a low of 666.79 on March 6th, 2009 and put in a recent high of 5669.67 on July 16th, 2024. Both have triple SIX's in them and both marked important turning points. When you add the bearish weekly chart (and monthly), plus the bearish period that is common in the fall months like September and October, you have some strong "clues" to suggest the top is "in" and that the rally coming soon will most likely fail to put in a higher high.
I think that rally will be next week into the end of the week as I suspect we'll get some kind of boost in the market after the Fed's cut the rates at the September 18th FOMC, so by Friday the 20th I think the rally will be over with. This week I expect more weakness as we go a little lower to finish this leg down, which might be finished by this Thursday. Then one last rally up into late next week for a lower high before the market falls off a cliff and possibly crashes into October.
We could see some kind of "event" on Sunday the 22nd, or early that week that will cause the crash and the internet to shutdown for awhile. Call it a False Flag event to delay the election I guess, but it's more likely to be a dollar collapse event that's finally taking hold after the BRIC's nation stopped using the dollar as the reserve currency, which was last year. But it didn't cause an immediate reaction on the day it occurs as the Fed just kept printing money, but I think it's coming to a head now and we are close to seeing a collapse in our system to where the value of the dollar could be cut by a third in some overnight instance.
This happened before when the government revalued the $20 gold piece overnight. It was Executive Order 6102 is an executive order signed on April 5, 1933, by US President Franklin D. Roosevelt "forbidding the hoarding of gold coin, gold bullion, and gold certificates within the continental United States." The executive order was made under the authority of the Trading with the Enemy Act of 1917, as amended by the Emergency Banking Act in March 1933. This could happen again and the time for it would be the week of September 23rd, 2024.
While I don't know if that's the "event" or not there are some others out there that seem to think it's coming and that our internet could be shutdown that week while this occurs. Maybe it does, maybe it doesn't, but techincals will be super bearish if we rally into Friday the 20th and put in a lower high. We could see a wave 3 of C down on a bigger scale that could easily turn into a crash like event. Let's look at a possible wave count on my Alternative Chart...
As you can see we could be in wave 1 of C down currently and wave 2 of C will happen into Friday the 20th, which sets up wave 3 of C down to start the week of September 23rd. If the drop really s gets going we could see 1000+ points is a short period of time. That's "if" it's a dollar event like I discussed, or some other unknown crisis. If no event happens then it might scary but nothing too crazy on the downside, like to 4800 or something. We've had a slow decline in 2022, so we are overdue for another fast one like January 2018 or even the 2020 crash. It will likely drag out into October regardless of how deep the first move is, and by the time we bottom it could be a lot lower then most will believe.
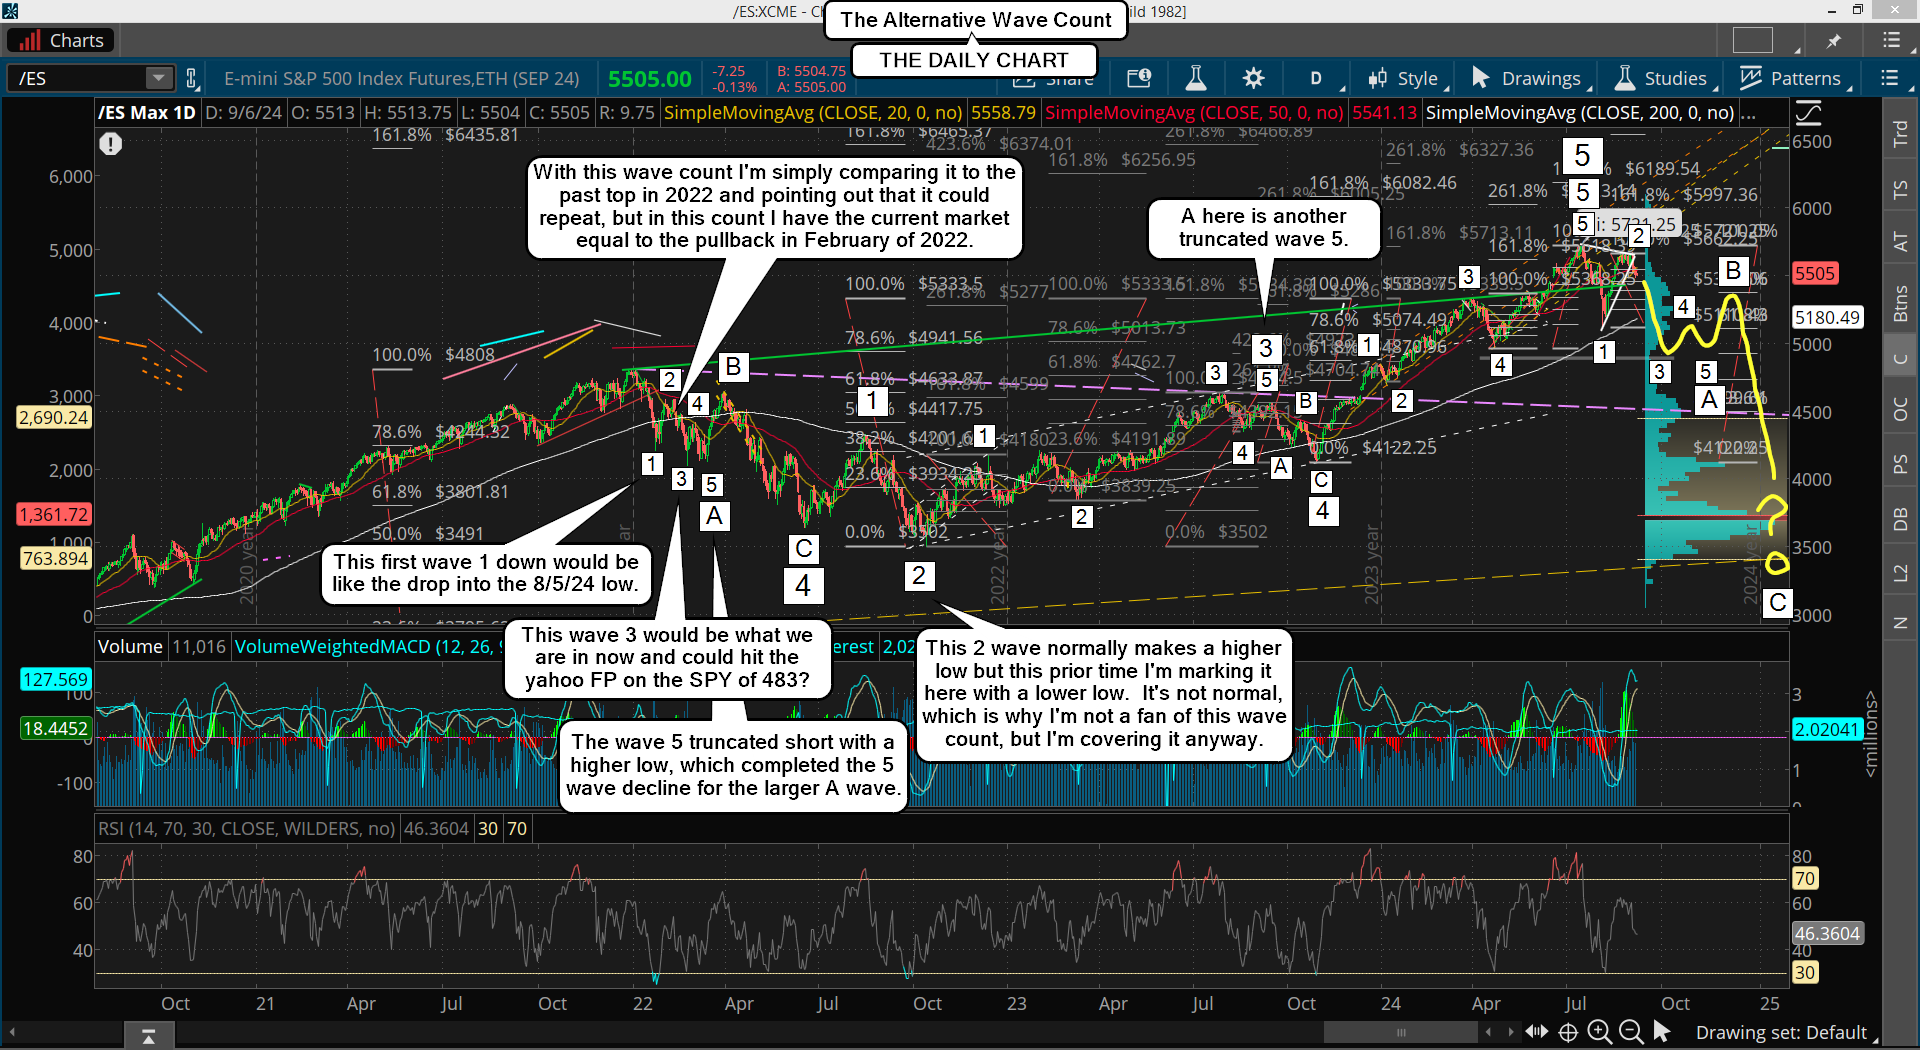
Today I'm going to go over the possibility that the market could have already topped. I do not lean this way though as the prior patterns and technicals really don't support it, but I'll cover it anyway. Let's look a the chart below...
Now while that chart does have a lot of things that seem to align up with the January 2022 high I want to go a little deeper and look at other things that point to another higher high coming after we get a lower low, double bottom, or higher low then the August 5th 2024 low... but the large "crash like" drop that could play out in October or November would be delayed until a new high happens first. Meaning we'd have another rally up to higher high again before we rollover for that "crash style" drop. Let's examine the chart below...
One of the biggest things that supports this is the fact that we are no where near the 200 day simple moving average currently, which back in February of 2022 that drop for the smaller wave 3 (and the smaller wave 1) was under the 200 SMA. When I study that weekly chart of the past we currently appear to be similar to the 12/15/21-12/20/21 pullback. While the market never repeats exacts the patterns do "rhyme" and I tend to think that's where we are right now. If so, then we have one more higher high coming before we drop like 2022 did.
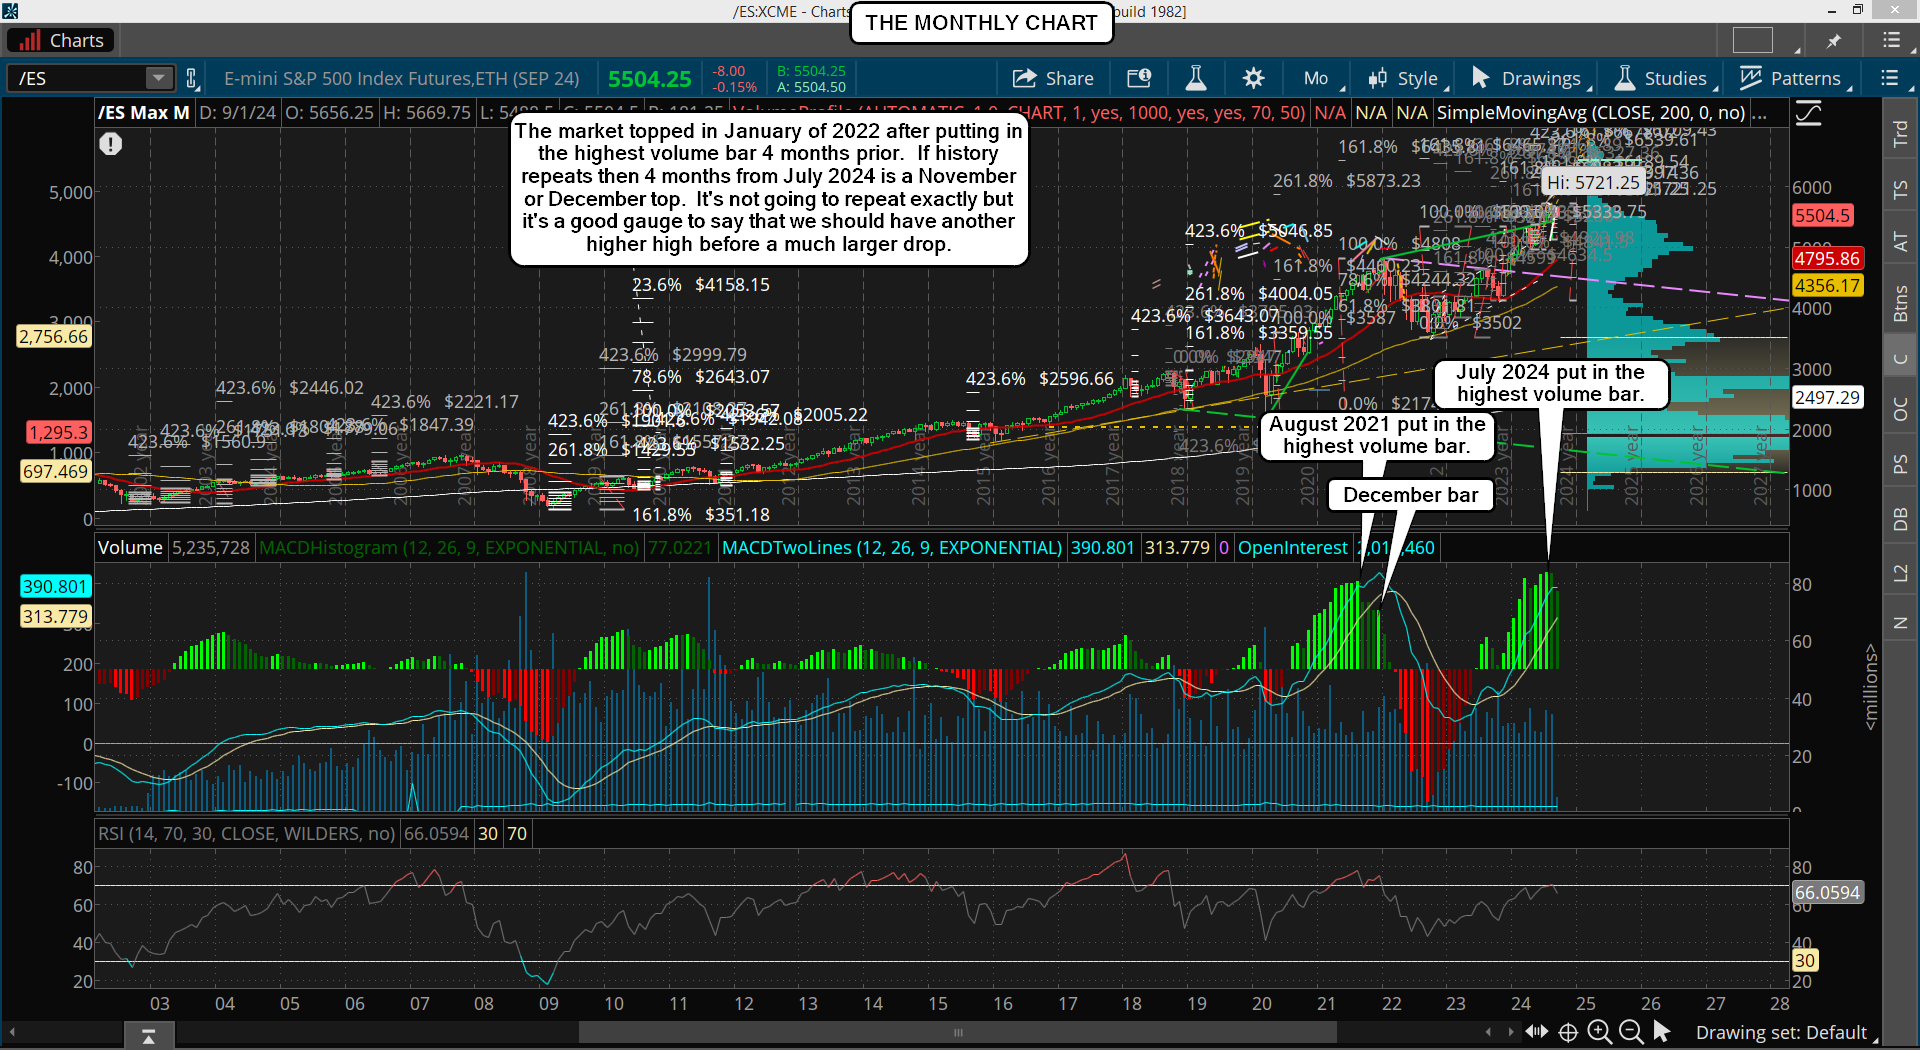
Now let's look at another interesting clue on the monthly chart below...
Again, while the market never repeats exactly the technicals still suggest to me that there's one more higher high coming before we start a much larger drop, which could be similar to 2022 or follow some other prior correction like 2020 or 2018 even. That's too hard to forecast, so let's just focus on the short term for now.
Lastly let's look at the weekly chart below...
When you examine the daily, weekly and monthly chart all the technicals point to another recession coming soon in the market, which should carry into early 2025 from everything I can see. Only another fast crash like 2020 prevent the first quarter of 2025 from being bearish as otherwise this market is going to need 4-6 months to cool down the very overbought conditions on the monthly and weekly charts.
We got pretty much what I expected yesterday... chop. I still don't see anything bullish on the short term as the weekly chart is certainly in favor of going lower, and the daily chart could go deeper too. But price really isn't something that is easy to forecast. The technicals just suggests that this market isn't oversold enough to start a strong rally up to new all time highs again.
It looks like it should drag out into next week from what I see, but that doesn't mean it's going to go a lot lower. It just means that the upside rallies should not break the prior lower highs in that 5650-5670 zone. So if we get a decent rally up this Friday I don't see that zone breaking as it's strong resistance right now.
And on the downside there shouldn't be much left for today because the short term charts are getting close to turning back up from being oversold. I think we get some more weakness today but by Friday we rally up higher to try and hit the 5650-5670 zone. It might drag into next Monday but if it happens I'd still be bearish and look for another move lower later into next week. Because the bearish period has so much "time" left I do think we'll get some kind of ABC down before we end my wave 4, which will setup OPEX week for the start of wave 5 up.
Boy, when the market decides it's ready for a pullback it really delivers. I was looking for yesterdays move to be drawn out over 3-5 days as that's the period of expected weakness, but yesterday was a nasty drop and has pretty much hit my target zone.
So, with more "time" left the market could go lower, but we are oversold on the short term. So I suspect there is little left on the downside before a bounce, but we might not see the low for this move until this Friday or early next week when this weakness people ends. If yesterday was an A wave then we should have a B up start soon, like possibly today. Many B waves are drawn out in time and full of traps for bulls and bears both, so it could last into this Friday?
If so then I'd look for the C down to happen into early next week to complete the wave 4, and it could drag out into next Thursday if it wants to fool the most. There's a lot of "time" left for this bearish window, and while it should be finished by next Monday or Tuesday I wouldn't be shocked to see it linger into Thursday. I don't have a target for the low but with so much time left I have to think we could reach 5400, which is roughly the 50% retrace level.
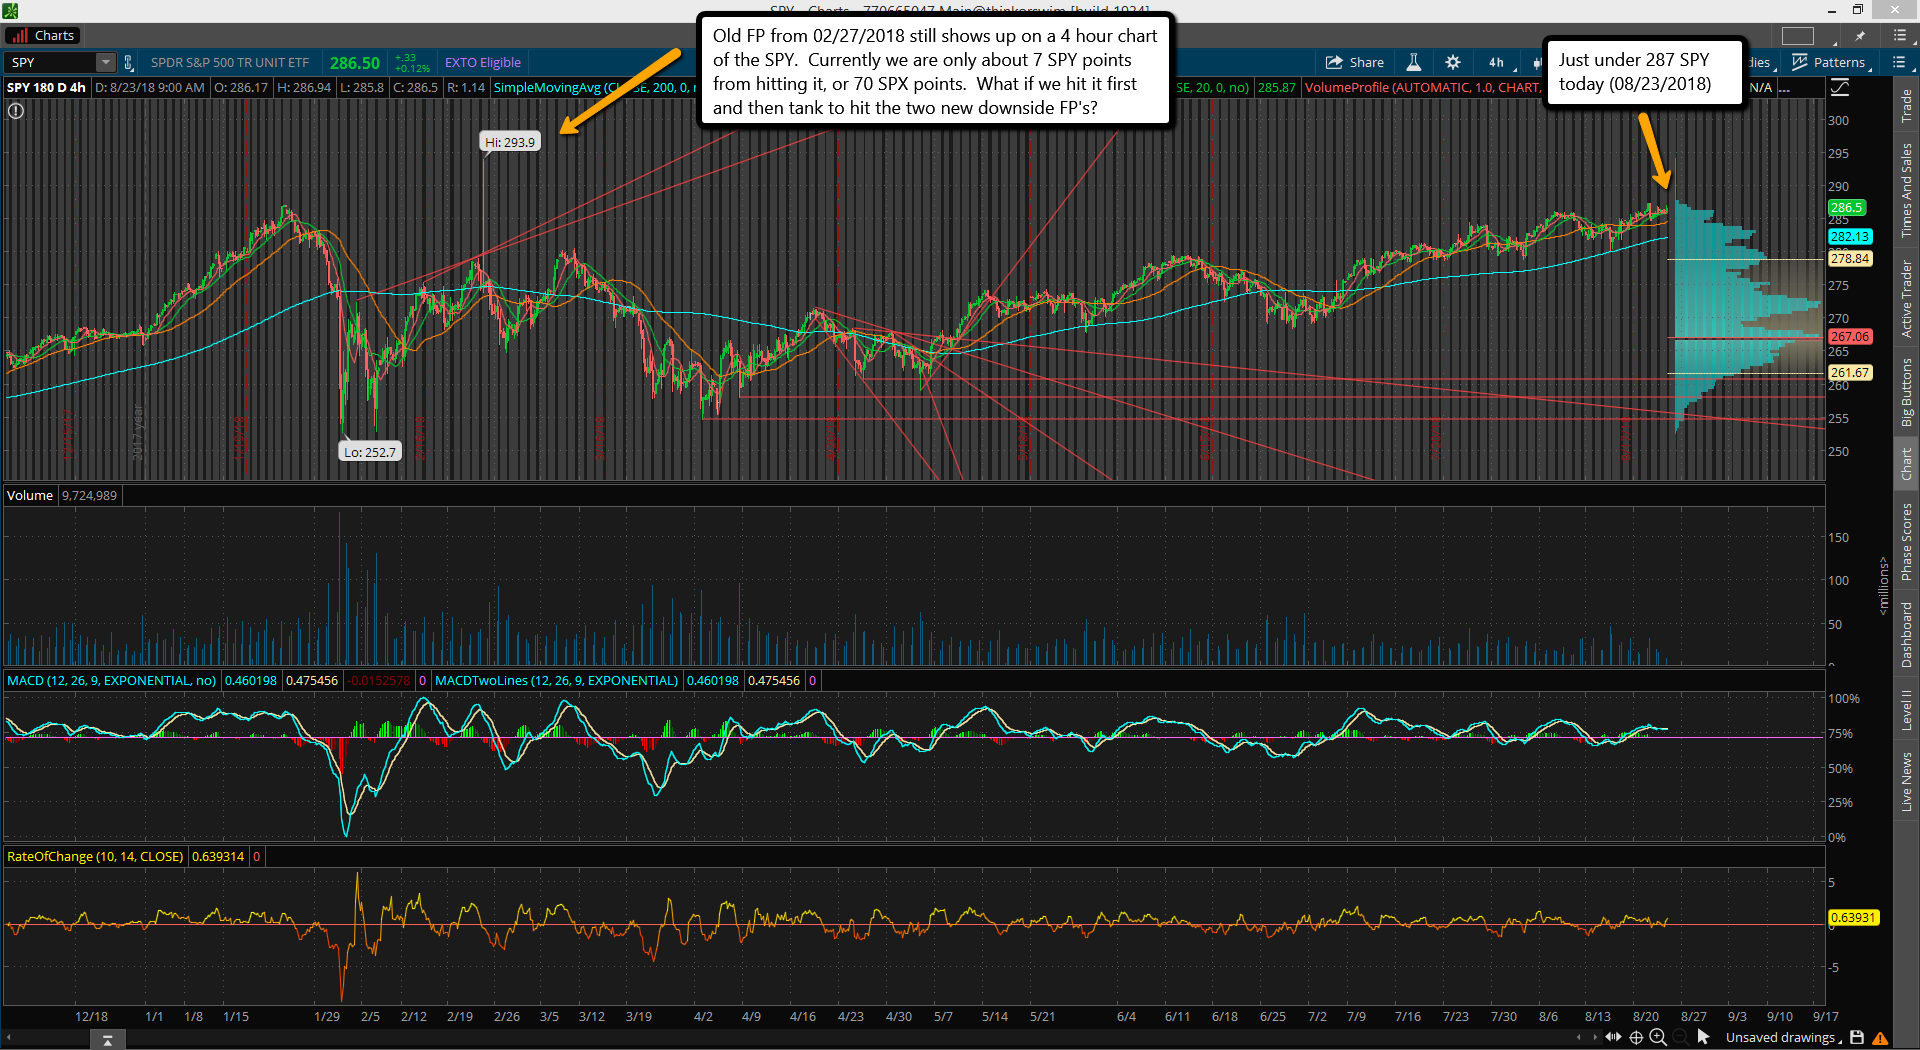
On another note, I want to put this out there as it just came to my mind yesterday. I was just thinking about those 2 Yahoo FP's from March and April this year, which were point to the 483 on the SPY. It reminded me of the 2018 FP that I found on February 27th, which was an upside fake print then. It took until September 20th of that year before it was hit, and it pierced by just 4 cents on the SPY.
Here's that old chart...
So what if that Yahoo downside FP takes about the same amount of time to get hit? It was roughly 7 months (205 days to be exact), so what is 205 days from the first FP on March 1st, 2024? It is September 22nd, 2024, which if I'm wrong on this pullback being just a small one before a larger rally (meaning we keep dropping), I'm going to be looking for that 483 FP to get hit around that date.
I don't expect this pattern to repeat though as I have NO prior history of such things happening. But the FP's "do" get hit at some point in time. So for now I'm just sticking with a small pullback and then another rally up into the end of this month or earlier October. Everything looks to me like we'll drop hard into the election, and if we get up to "just under 6000" prior to then, a drop to hit the FP on the SPY would be a very nice drop and totally possible. Just food for thought.
I hope everyone had a good holiday weekend... I know I did. I enjoyed just taking a nap on my swing on the porch was the hot weather has broke and it was pretty comfortable outside in the shade. Moving on... this week will be a short one since the market was closed yesterday.
We did not breakout and make a new all time high into the end of the month but we did close out near the higher range, and I've pointed out many time that the market will commonly produce "turns" around the end of any given month. Since we were up near a high it suggests we will turn down this week, but I still don't think we are ready for a big drop. Most likely we'll just see the right shoulder created that I've talked about many times last week as likely.
I still think a new all time high is coming before the bigger drop, so if we get a pullback this week it's likely just a buying opportunity before another rally into mid-late September. It's very possible that we reach my FET on SPX and/or ES before we finish this strong multi-month rally. In fact, it's looking like we could bottom for that bigger drop in late October right before the November election. Here's a chart...
Yesterday almost broke though the falling white trendline but it held again, so change in the forecast. However, I do want to point out that between now and Sunday (in the futures), if we make a higher high on the DOW and SPX (I don't think the NDX can do it), then we will likely have topped as this is a turn window. But it requires a new high to trigger.
I don't think it will but it certainly could happen, and if it does I'd look for a pullback next week for the first leg down and a rally back up into the 18th for a lower high (the B wave?), and then the nasty C wave down afterwards. If this happens I'll adjust but right now it's looking like we'll breakout early next week and skip the "end of the month" turn window. Not much else to say, so have a great 3 day holiday weekend.
No breakout from NVDA yesterday so it's looking like the market is going to put in a low into this coming 3 day holiday weekend. That's perfect for a medium wave 4, inside a large wave 5 up. Next week I'd expect to see medium wave 5 up start, inside large wave 5, and hopefully that takes us into mid-September where we put in some final top before we drop hard into the election. Nothing more to add as we close out this week. Everything points to a breakout next week. We shall see.
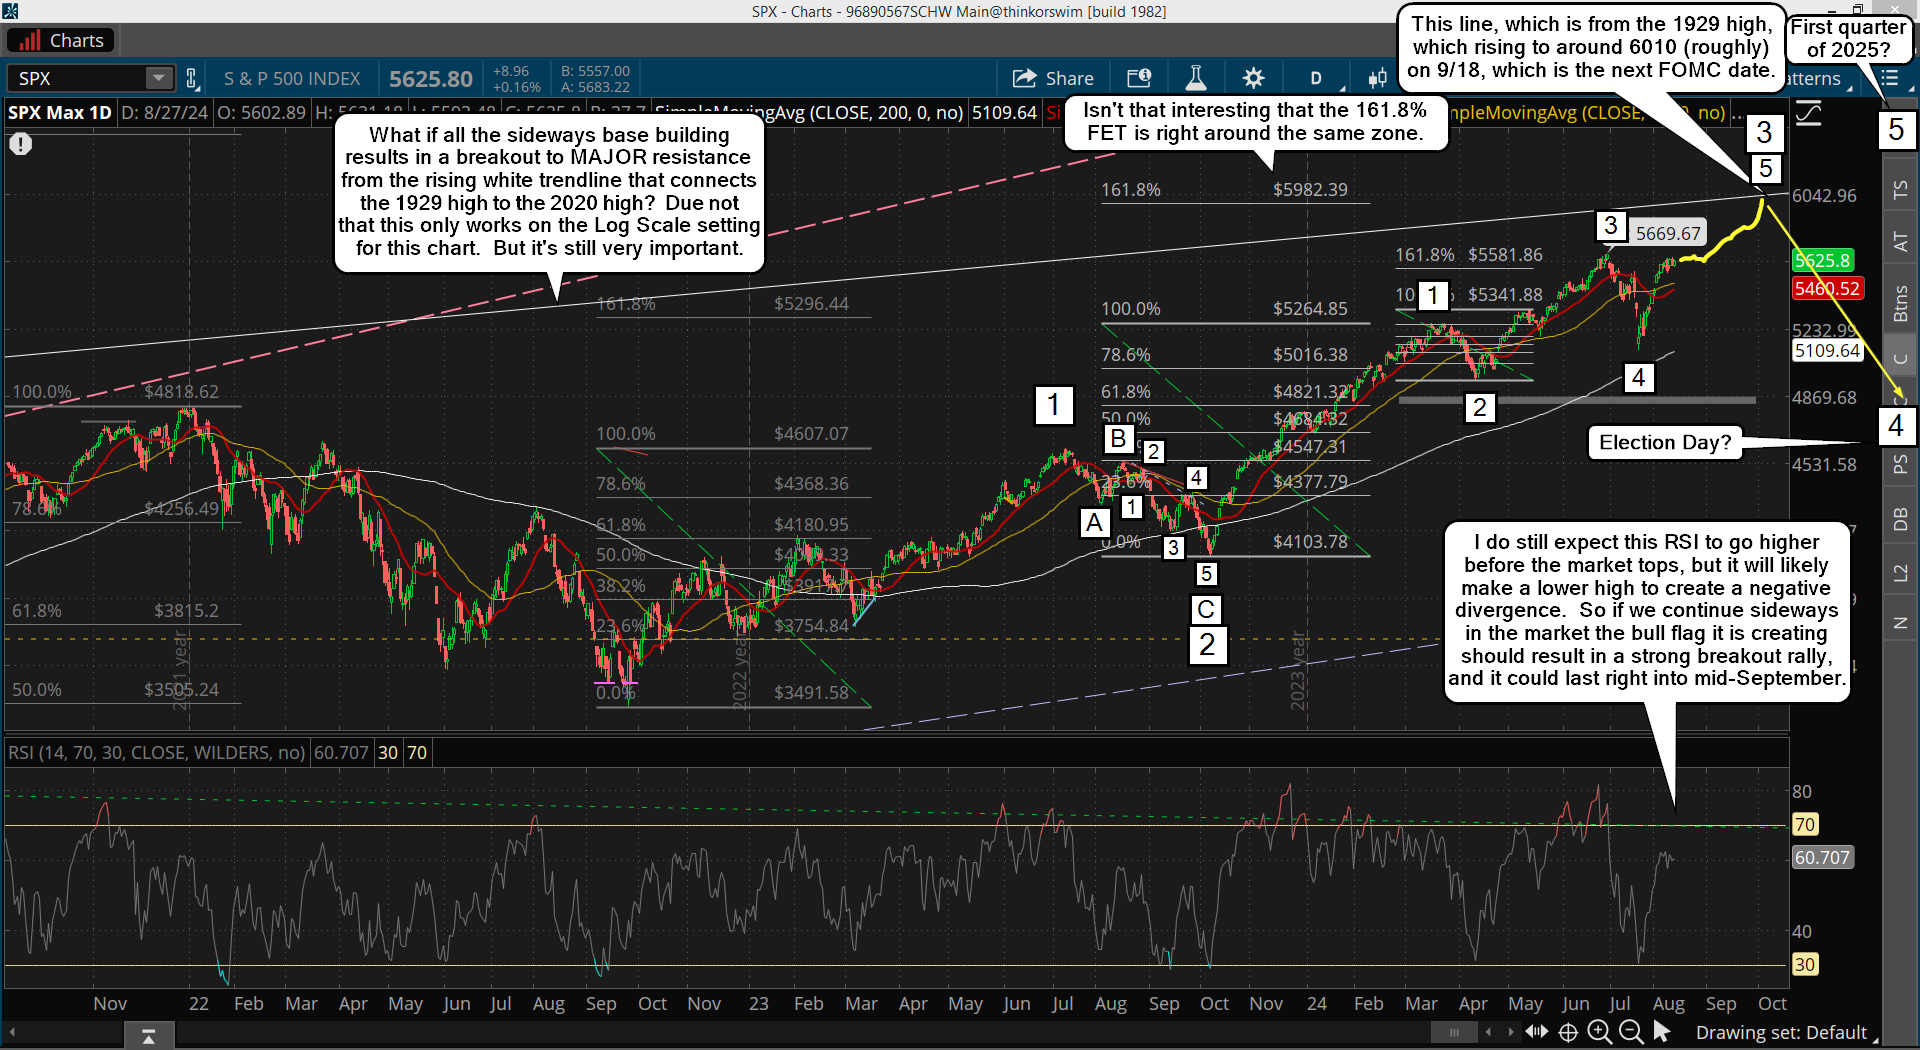
Since there's nothing going on but chop I want to cover something else this morning, that I just find interesting. It's on the SPX chart and it's a rising white trendline from the 1929 high to the 2000 high, which is shown below...
Notice how close we got to hitting it at the 2022 high, which fell shy by about 300 points but looks really close when you zoom out on the monthly chart. Now guess what? We are again around 300 points or so shy from hitting it, so it's possible that they will hit this this time around. The first half of September is very bullish, so if there's ever a time for them to juice the market it will be during this period.
The bullish pattern is there, and still forming as we go into the end of this month, so all the bulls have to do is to keep holding the support zone until they get the right spark to breakout. That could be any day now, but it certainly should do it next week after Labor Day. Below is a close up chart of that same rising white trendline...
Notice that my Fibonnaci Extension Target (FET) is at 5982.39, and the rising white trendline will be in that zone into mid-September. Maybe it's all too obvious but it sure looks like we are going to top out into the September 18th FOMC meeting.
Not much to add as the market continues to build a sideways base under the falling white trendline. It could breakout as it's technically forming a bull flag or even a "cup and handle" pattern. Both are bullish of course but I still lean toward a pullback, which is based a lot on the fact that early to mid-September is very bullish from the Seasonality Chart, so I think we rally nicely next week, which suggests this week should pullback... or go sideways more to further build that bull flag.
Either is fine I think as both pattern will allow one more move up into the FOMC in September. Again, shorting here is not wise as while we might pullback we could also go sideways. Better to wait for the last rally up to short or (if we get a decent pullback?) go long on a good move down.
P.S. NVIDIA earnings are out Wednesday so that should be a market mover. Will it be the pullback I'd like to see, or a breakout to new highs? We shall see.