Tuesday chopped around with a dip in the morning and rally into the close, but overall it really did what I thought could happen. Today we should see the market start to pullback small with the biggest move on Thursday and into early Friday probably. It could be either scenario, the Bullish one or the Bearish one, but it's looking more like the Bullish one will play out.
Remember that "time" is more important then price and the expected low is on the 13th/14th, and therefore whatever low we see will be it for the downside in my opinion. I would think we could fill the gap up on Sunday night at the 6765 ES high from last Friday. That would make the right shoulder for an inverted head and shoulders pattern.
It would be the wave 2 pullback as well with the rally up from that Friday low to the high from it being the wave 1... which sets up the wave 3 up into next week for OPEX. I have to think we'll see a new all time high easily if the pullback is only to fill that gap, so 7000 is very possible. The Bearish case would require some kind of new event to get such a large drop to happen in the next few days. I cannot predict that, so I won't even try. I'm just going to be focused on the date window of Thursday or Friday, and whatever low it is should be the best opportunity to get long for the wave 3 up.
Very nice squeeze yesterday as it even surprised me on how high it went. Nothing has changed though as there shouldn't be much left on the upside as we should start back down today or tomorrow with the biggest part of the decline expect on Thursday or Friday. I still do not know if it's going to be a C wave decline or wave 2 as discussed in yesterdays update.
We'll just have to let it get going first to see what happens, but the bearish period will expire by this Thursday or Friday and then the cycles will turn back up to bullish until the first week of December. The next 2 weeks are normally bullish anyway as it's the Thanksgiving Holiday period, so if we get a flush out, where the bull stops are taken out below the October 10th low, then the move up should be very strong as again, it will be powered by squeezing the bears and have very little bulls in it.
Beside the cycles pointing to a low this Thursday/Friday it's also a common pattern that used too happen a lot back in the past when there was only the monthly options. It was called "The PitBull Low" from Marty Schwartz as he first discovered it (as assume?) back many decades ago. It's where the market makers take the market down the week before the monthly OPEX to crush the longs and lure in the shorts. Then the week of OPEX (next week) they squeeze it hard after the retail longs got shook out. Maybe it happens again into this Thursday/Friday, who knows?
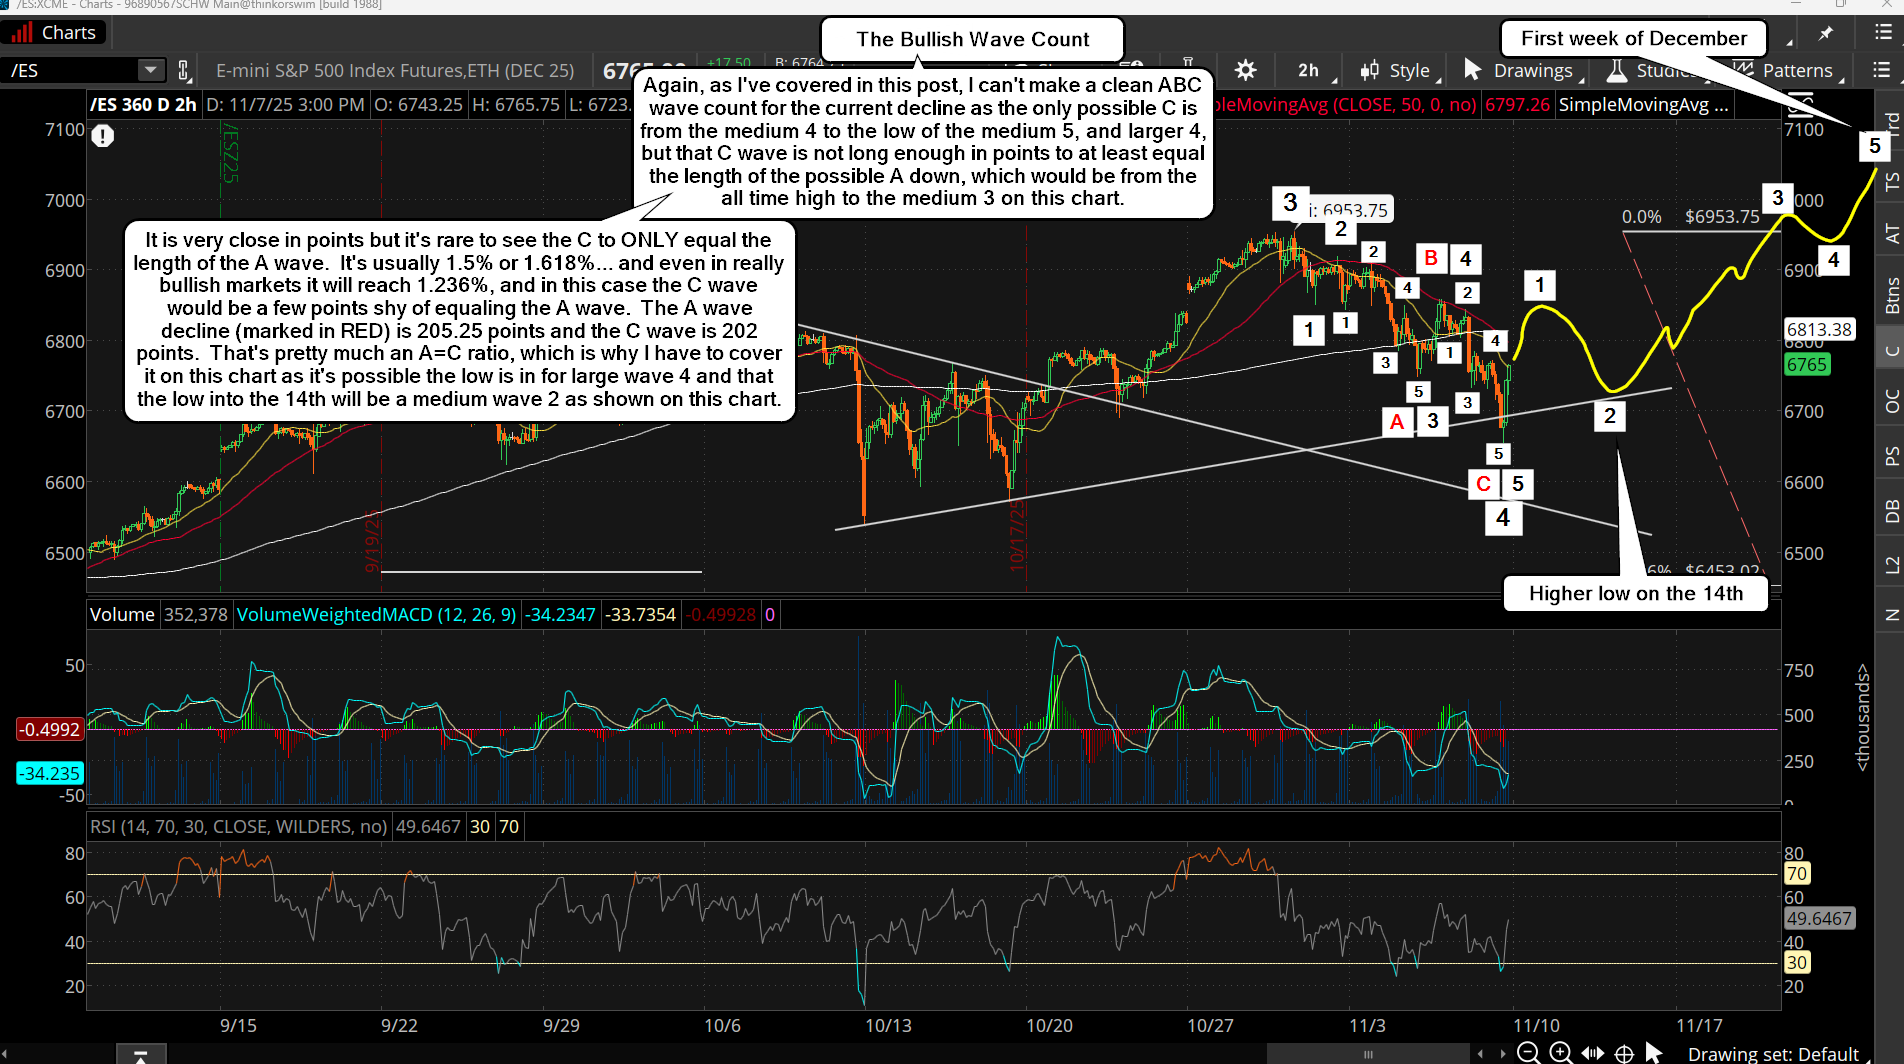
This week is an important one in my opinion as we should put in a low around the 14th, and then start a nice squeeze higher into the first week of December. The question is... will it be a higher low or a lower low? I can't answer that question unfortunately, so I'm just going to cover both wave counts and let whichever one play out that the market wants. I want to be ready for the rally after the low is put in as it should be a nice one. First, let's go over the bullish wave count below...
In this case we have already ended the wave 4 pullback and the move up from Fridays low into a likely high today is a wave 1, and the expected move down into the 14th would be a wave 2 for a higher low. The expected upside target today (possibly into Tuesday) is 6840-6870 on the ES, and that would end wave 1 up.
Then we'd see a choppy ABC down for wave 2 that bottoms around the 14th, which from that low we'd get a very strong rally up into the first week of December where we should reach 7000+ by then. The only issue I see with this wave count is that I cannot force an ABC down from the all time high into last Fridays low. It's a clean 5 wave decline and there's really no way to claim a valid ABC as what should be the C wave is too short.
Normally, there is either a one wave decline or three wave (ABC) for any wave 2 or wave 4, as they are corrective waves. For this reason I have to be open for that 5 wave decline NOT completing the wave 4 and that is is only the A wave inside a bigger ABC down for wave 4 that should make a lower low into the 14th with the C wave "at least" equaling the length of the A wave.
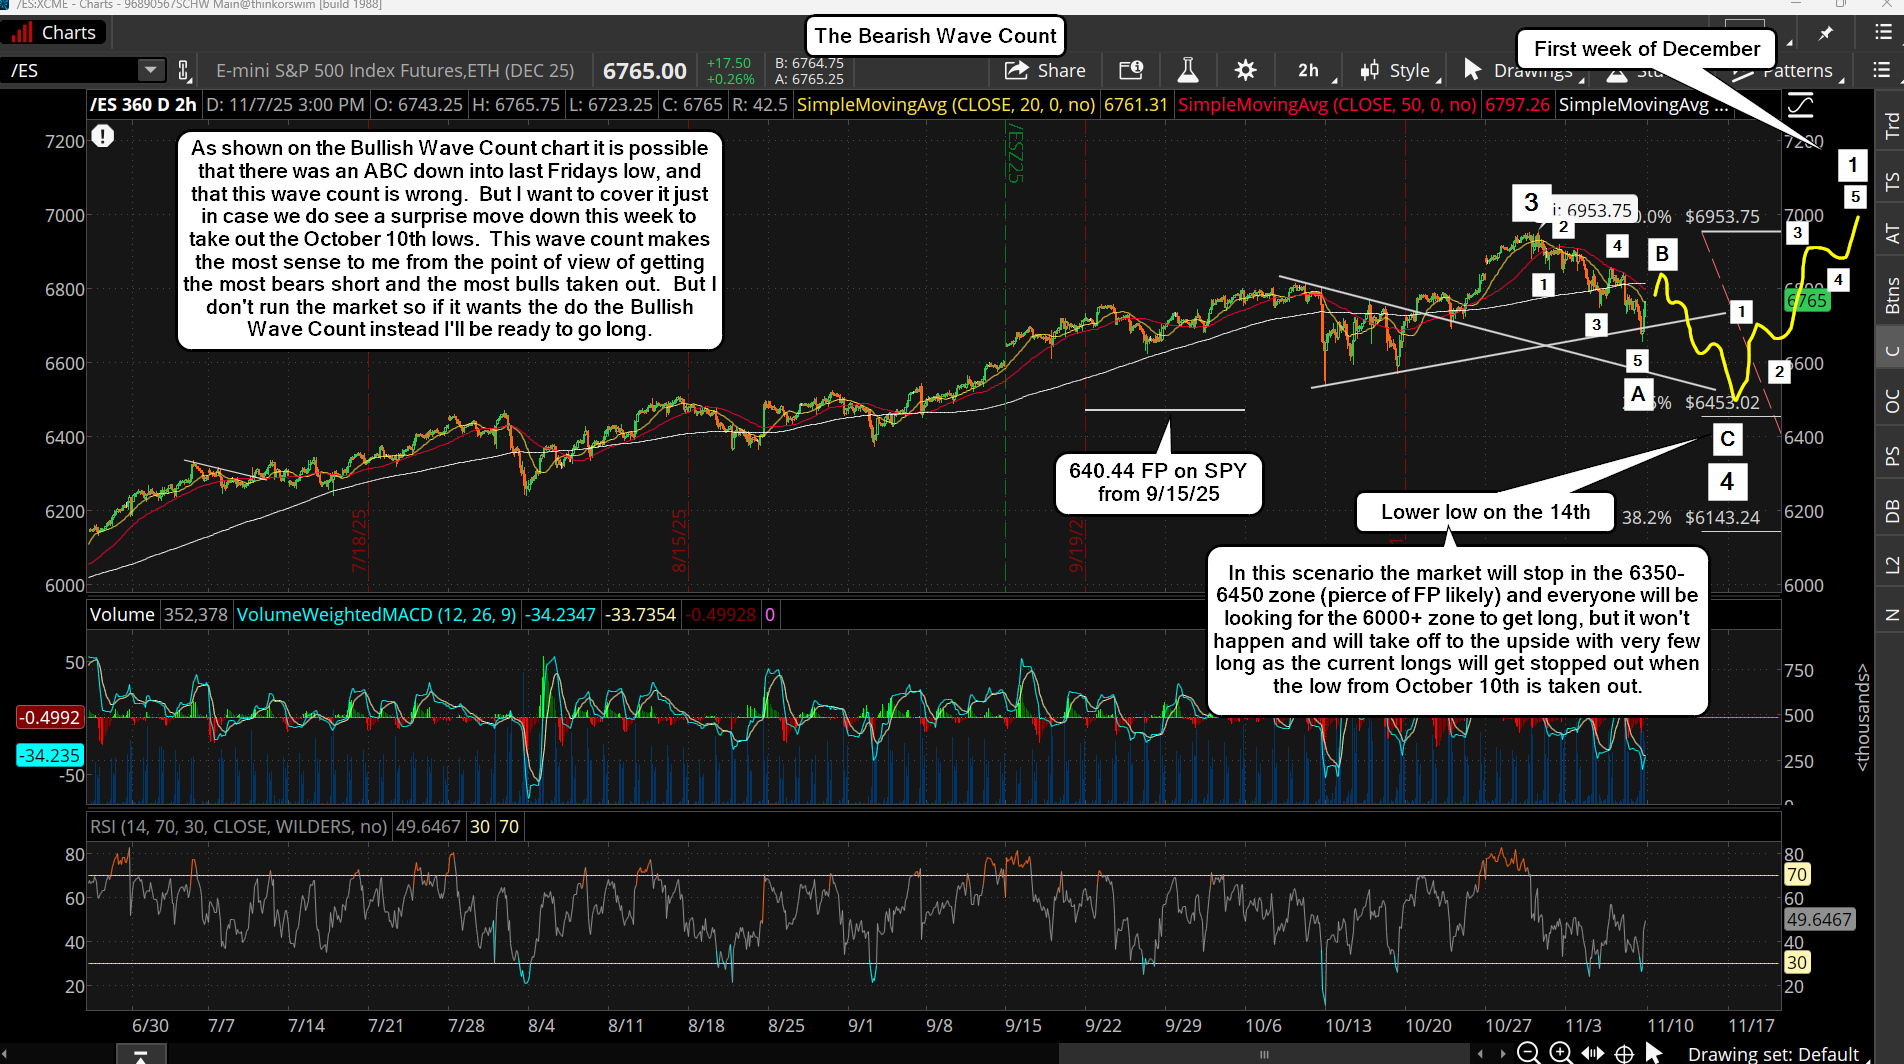
The all time high is 6953.75, and Fridays low was 6655.50, which is 298.25 points. So, if we bounce today up to 6850 (for example) then roughly a 300 point move down for the C wave would target around 6550... which is a perfect A=C ratio. However, it's more common for the C wave to extend to 1.5% or 1.618% of the A wave, and that would put the ES down in the 6350-6450 area, and that takes out the low of 6540.25 on October 10th... plus it would fail to reach the 6000-6100 area where so many traders are focused on.
If it did this it would turn back up strongly from that 6350-6450 zone and squeeze hard into early December with all the bulls chasing it up because it didn't go the the obvious 6000+ zone where everyone (bulls and bears) want to pile on long. The market doesn't want it to be easy, as it loves to inflict the most pain as possible. Taking out the October 10th lows to hit the stops on the bulls, but not reaching the 6000+ zone where the bears want to exit and become bulls, will trap those bears during the move back up and keep the bulls on the sidelines. To me, this looks like the perfect trap as it will trick the most traders. Will it happen? Only time will tell.
Yesterdays move down took out the low from the 4th and then bounced back up to around that zone again. I was thinking we stay above and break it next week, but in the end nothing has changed. We should still bounce up into Monday and decline again into Wednesday where yesterdays low should be tested again. All of this up and down, while it looks like a big move, is really just chop to burn some time so that the bigger time frame charts can work off some of the extremely overbought conditions and setup the market for the next big squeeze higher. In my opinion there's no good trade setup here, not short or long. But next week we should see a good long setup happen, which should take the market up into the first week of December where 7000+ should be hit.
Chop today is what I'm looking for as support held yesterday and the market bounced. It's not ready yet for another new all time but after one more pullback mid-late next week we should start another big rally up.
I spoke about massive QE on the sidelines several weeks ago and I thought it wouldn't be used until we got a correction to my target of 5339 on the ES to fill the gap. But I was wrong as the Fed injected it into the market last Friday as explained in the video on yesterdays post. This tells me they will not let that correction happen as they want the market to continue higher for some unknown period of time.
Maybe they keep it up all year, who knows for sure? But right now it's obvious that they won't allow any crash to happen, so I expect chop for about a week to work off some of the overbought conditions on higher time frames, and the only way to do that is to either chop to burn time or drop in price quickly to get it oversold. I'm thinking that we'll get down close to the 6700 zone on the ES at some point next week, and from that zone we'll start the next nice rally up into the first week of December where we should hit resistance and exhaust that 2 week rally.
Today is the 5th of November and nothing has been blown up, so it's a non-event for this year. Therefore it's back to the technicals and they are getting short term oversold and suggesting a bounce is coming, but not a new high. The bounce could last into next Monday and will probably be a B wave of some degree and the current pullback would be the A wave.
Then a C down into next Wednesday or Thursday should finish the correction, which will probably hit the rising white trendline on my chart that is in the mid-6600's now. No crash basically. It's been avoided at this point and after the coming ABC finishes next week it's off to the races on the upside again. On a side note I found this interesting video yesterday about liquidity in the market and how they injected a massive amount of QE into the market last Friday, which explains how they are currently holding it up and preventing the crash now. That video is below.
Today is the last for the market to stay directionless as tomorrow is the 5th of November and "if" anything is going to happen that's the day it must start. If nothing happens bad, like in the movie (talked about in last Fridays post) then the market should go down small into the 12th or so. If the events in the movie happen we should crash instead, and bottom into the 21st or so with the gap at 5539 on the ES being the target. I don't know what's going to play out but it should all start by tomorrow.
The market didn't give me the last rally up on Friday that I was hoping for, so I didn't take any short position. If it would have at least made a slightly lower high fake out squeeze up I would have shorted but it stayed in the nice and clean downtrend triangle pattern, holding the horizontal support and NOT breaking out through the falling trendline that makes the triangle.
I would love to see a move to 7000+ with a high or close at some ritual combination of "7's" get hit on the ES or SPX. In my opinion Tuesday is the last day for this to happen as "if" (and that's a BIG "if" as no one but insiders really knows) the events talked about on Fridays post is going to happen the high must be put in by the close tomorrow as Wednesday is the 5th and when it's all supposed too go down.
I'm still leery of this happening as it will shock the world... plus I'm not seeing any large "put buying" in the market yet, and usually there will be some insiders that know ahead of time about what's coming and they position for it. Maybe this time it's kept more of a secret and/or I just can't see all the "puts" bought due to them happening afterhours or something? Anyway, I'm patiently waiting to see if we get that last squeeze up or not.
I've said a week long that going into November 6th is a very important period. I'm sure you have all be wondering why that week and date? The follow video (not mine) explains it quite well.
As you all know I've posted in the recent past about how our government has setting on the sidelines a massive amount of money ready to inject into the market at some future point. It's still there I'm sure as this market has being going higher on extremely fewer and fewer stocks. It's being pushed up by the MAG7 stocks basically, as it's not QE from the government or else we'd be at 8000 by now. That's a big clue that what is spoke of in the video is going to happen and crash the market.
Then there's the "100% chance of a nuke going off" statement by Martin Armstrong in a recent video. That's because Europe needs a war to get them out of a depression. So when could that happen? I'd say on November 6th as foretold by the old Simpson episode when a nuke goes off and a clock lands in Homers backyard pointing to 11/6 or 6/11
11/6 = 911
That's something not covered in the video, but super important to note and remember. It could happen any year in the future but with the odds of a nuke going off now at a 100% from Armstrong's computer model I can't ignore it happening this year on 11/6, and not some future year on 6/11 or 11/6.
Let's not forget how close the ES/SPX is to 7000, and what Christine Lagarde said many years ago about the importance of the number "7" in numerology. Could we hit some kind of 7 combination of numbers on the ES or SPX by the end of this week, or next Monday?
The Number 7
What if we hit 7077 or something else with a combination of the number 7 in it? Maybe it's 707.70 on the SPY? And for you old time readers of my blog there was also a movie about a runaway train that was number 777, which was called "Unstoppable". So many clues, so many years in advance.
Unstoppable
When will be the best time to take a short you wonder? I don't know but before the 4th of next week I'm thinking. I think it's all been planned for a long, long time to take down the deep state and all these clues were told to warn us what was coming.
Now I don't know for certain about the SPX or ES reaching some combination of 7's or not, and maybe that is not a price level but a date? Or an amount of points? Maybe it's something else that I'm not aware of? My point is that I'm not counting on, or waiting on, the magically 7000+ level to get hit as maybe it's just too obvious and won't be hit this time around.
It feels like we've already top and we are just waiting for next week for some big event to happen to start the crash. I'll likely short today and not wait, and if it goes up more I'll ride it out. As for all the events talked about in the first video in this post, I have no idea if any or all of them happen. My thoughts are that a nuke will be set off by someone on the 6th, but I don't know who. The rest of the stuff could happen too, or parts of it, who knows for sure.
Yesterday we saw a pullback (finally), which is could be small wave 4 or medium wave 4... I don't know which? Regardless of which one it is I just don't see anymore then one more push up, and I think we are going to hit 7000+ going into the close Friday. Next week might start of slow but some HUGE events are coming on the 5th, 6th and beyond.
We could top on Friday, Monday or Tuesday, I'm not sure which? But once we see 7000+ I think the upside is either finished or 99% finished. Tomorrows post is SUPER important as I cover all my reasons for thinking we are going to crash in the month of November. We should fill the gap on the ES at 5339 and we'll probably bottom into the week of Thanksgiving, maybe as as early as the 21st as that's OPEX and they might want to reserve the last week of the month for the bullish reversal back up so the monthly chart puts in a long bottoming tail candle.
As for today, I don't have much to add. I just expect to see more grinding higher until 7000+ is reached. The goal this week should be to get the bears to capitulate and get the bulls fully long. How high will that be? I don't know? But 7000+ looks like a magnet the market wants to hit.
Nothing has changed since yesterday. We may or may not have completed small wave 3 up... hard to say for sure? Today is FOMC day, so we might see some wild swings up and down, and if we do I'd have to think the down move would be the small wave 4 and the move up the small wave 5, which would then complete medium wave 3 up. Then we could (should) see an ABC pullback the next few days to complete medium wave 4 down. Lately would be a final rip higher (7000+ possible?) to complete medium wave 5 inside large wave 5. If we get that into the 6th of November I fear a large drop will follow. Again, I'll post my reason for that date "if" we rally hard up into it next week.
Still no pullback, so we are probably in Small Wave 3 up, inside Medium Wave 3, inside Large Wave 5 up... and I'm not sure where it's going to stop. But once it does there should be a brief pullback for Small Wave 4, then up again for Small Wave 5, which could happen right into the FOMC this Wednesday. If so then we could see a choppy ABC pullback for Medium Wave 4 into the end of the month, and then the last rally up for Medium Wave 5, inside Large Wave 5, into November 6th, my target date.
Last Friday I posted an Alternate Wave count that has us in the Larger wave 5 up now... meaning the Large Wave 4 down was a one wave drop, not an ABC, and it ended on October 10th. That's still the likely wave count, as while I also drew a rising trendline where a Medium Wave 4 pullback could go to there's also a small chance that the October low is taken out in a Medium C Wave down from the other wave count where the October 10th low was just a Medium A Wave low.
And with the gap in the futures Sunday night I'd say there nearly a zero percent chance of that wave count playing out now, and instead we must be in Large Wave 5 up. Inside that wave there will be 5 Medium Waves, and inside those waves there should be Small Waves too... like 5 for the wave 1, 3, and 5.
Looking at the futures now we are likely in a Small Wave 3 up, inside Medium Wave 3, inside Large Wave 5. That's why we are getting these gap ups now as it's a powerful combination of waves. If we would have subdivided Large Wave 4 down into an ABC, instead of a one wave (one day) move, this market could have extending in early 2026 I think, but now I think it's going to end in November, maybe December, as it's moving too fast.
I was thinking it would last into January or February of 2026, but it's going nuts on the upside now, so I can't see it lasting that long. This looks and feels like a run away train now that's going to crash sooner then expected.
A key date to note is November 6th, which I will cover "why" if we continue this squeeze into next week and we make it up to around that magic 7000 level that is acting like a magnet for the market now. For now there's nothing to do as I can't chase it up and shorting is a fools game right now as you just get crushed every time you do it. I should know it very well as I've been dipping my toes into shorts every now and then and they just don't work out for me. I have to exit at a loss on them and just go back on the sidelines.
That's what I'm doing now... just sitting on the sidelines and will let the waves unfold into the 5th-6th to see if we get them completed or not. I'd like to see the "Fear and Greed" index go to extreme greed too, which may or may not happen in the next two weeks. Who's knows for sure.
From what I can tell yesterdays rally was a tiny C wave up inside a small wave 2, further inside a medium wave C down, inside a large wave 4 down. That's a mouth full of course, but if I'm right we'll see the start of a nasty drop today, which will be a small 3 down inside a medium C, inside large wave 4 down. It should complete by early-mid next week with a slightly lower low (50-100 points) then the October 10th low. Nothing more to add so I'll end it here.
The market rolled over yesterday and did not put in a higher high, so it looks to me like the wave B up from the low on October 10th is finished. We should be in the wave C down now, and we most likely completed the first wave 1 inside it at the low Wednesday, with the start of the wave 2 up afterwards.
Once the wave 2 finishes we should see the wave 3 of C down... then 4 and 5 should complete that C by early next week I believe. It's continuing to unfold nicely with wave patterns. Today could start the wave 3 down of C, or the wave 2 up takes more time to complete. Possibly it subdivides into a small abc pattern and tops into Friday?
Hard too say but after that wave 2 bounce is done the wave 3 of C should produce a nasty drop. Naturally that wave 3 could subdivide into 5 smaller wave too, but there's no point at trying to figure that out now. Let's just see if it happens or not.
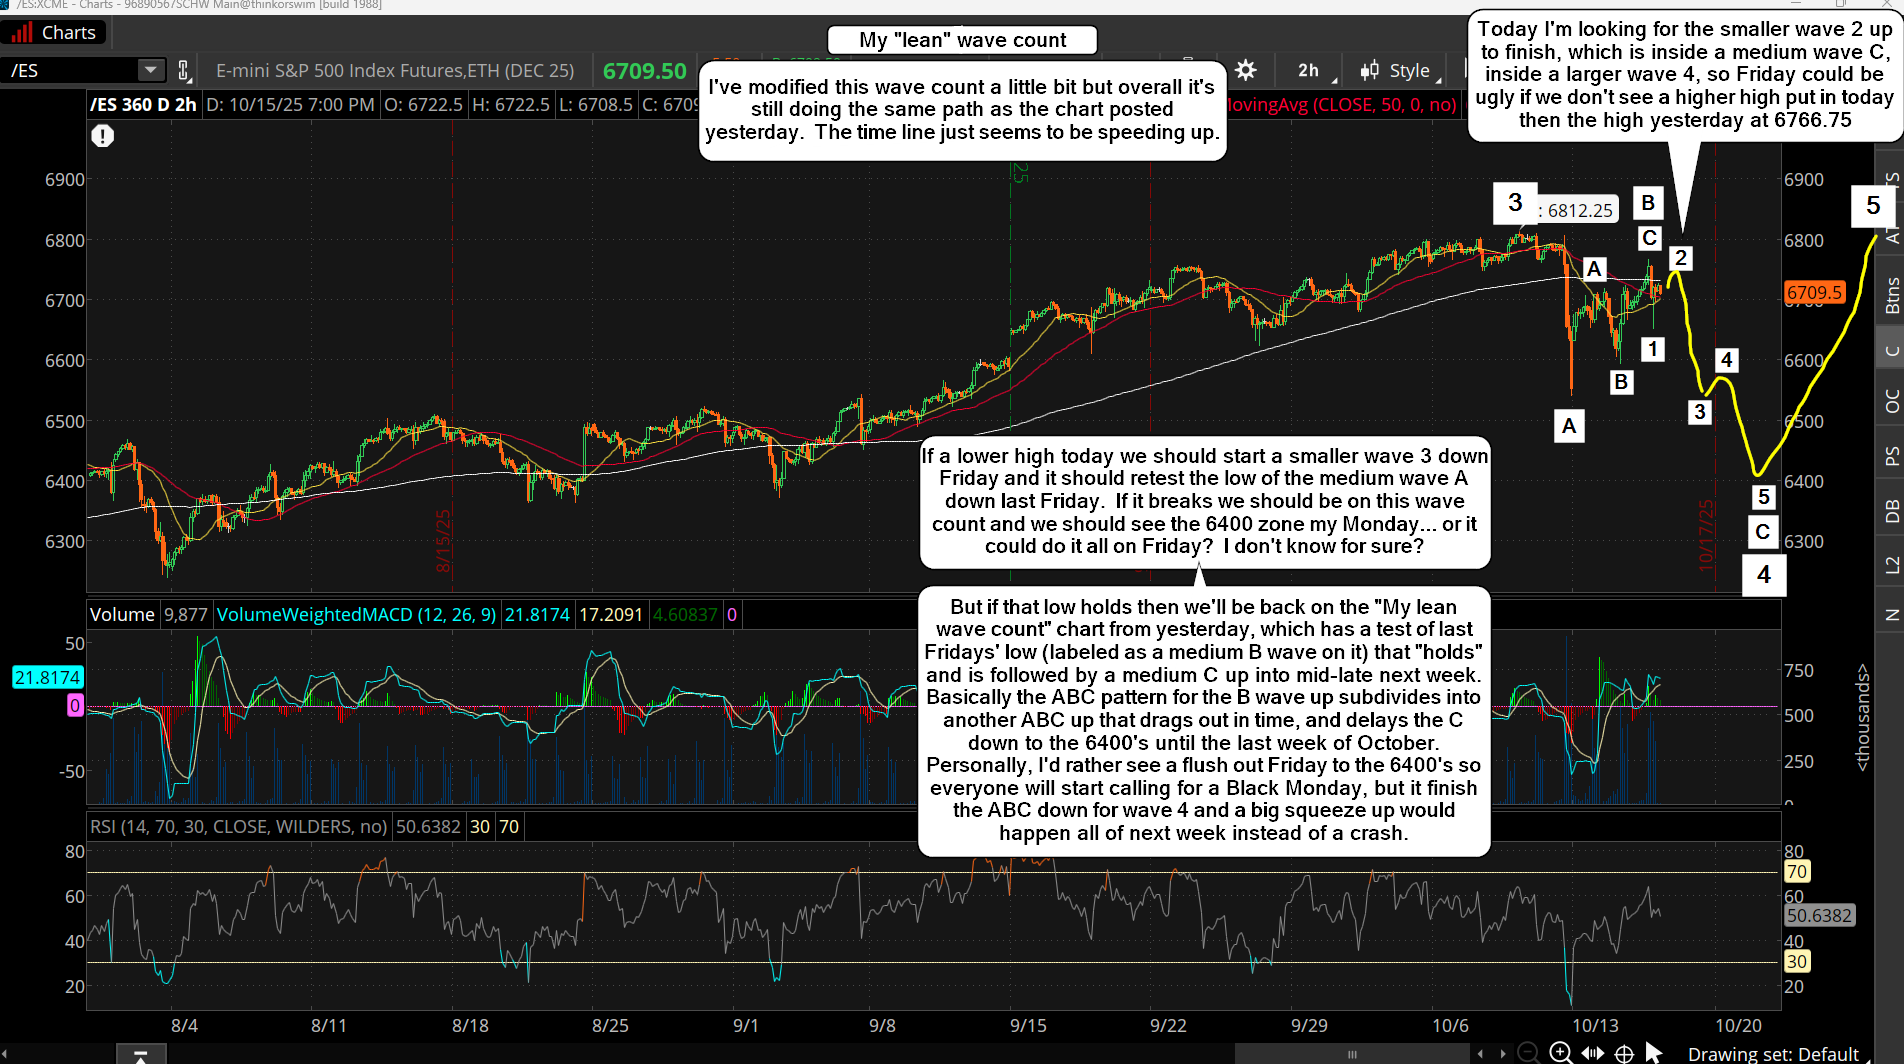
A flat day yesterday as expected. Today should start the pullback but if this is a C wave down I'd only look for the wave 1 to play out with the wave 2 back up happening to the close or early tomorrow. It's setting up for a wave 3 down inside a C wave to happen on Friday, and if it double bottoms the October 10th low the wave 4 bounce should happen in the Sunday futures with Monday the 27th having the wave 5 of C to hit the stops below the prior low and then reverse hard back up.
I'd look for a rally all week if that happens, and a top into November 6th, which again... should be a higher high. How much I don't know but enough to take out the stops on bears that are likely right above the current all time high. It should be about the same as the coming low I guess, about 50-100 points to take them all out. After the stops are hit with that new higher high we should rollover for the crash wave. November 6th is a very important day, which I will explain in a future post if the market continues to track the current expected pattern.
Ok, yesterday worked out well with a rally up to hit the stops on the bears. It's super close to a new high, but as I write this post after the close on Monday the futures are going sideways, so there's no way to know if they will make a new high or not? I don't lean that way, as I lean toward the new high being the rally going into November 6th, after a pullback to the mid-6400 zone into next Monday happening first.
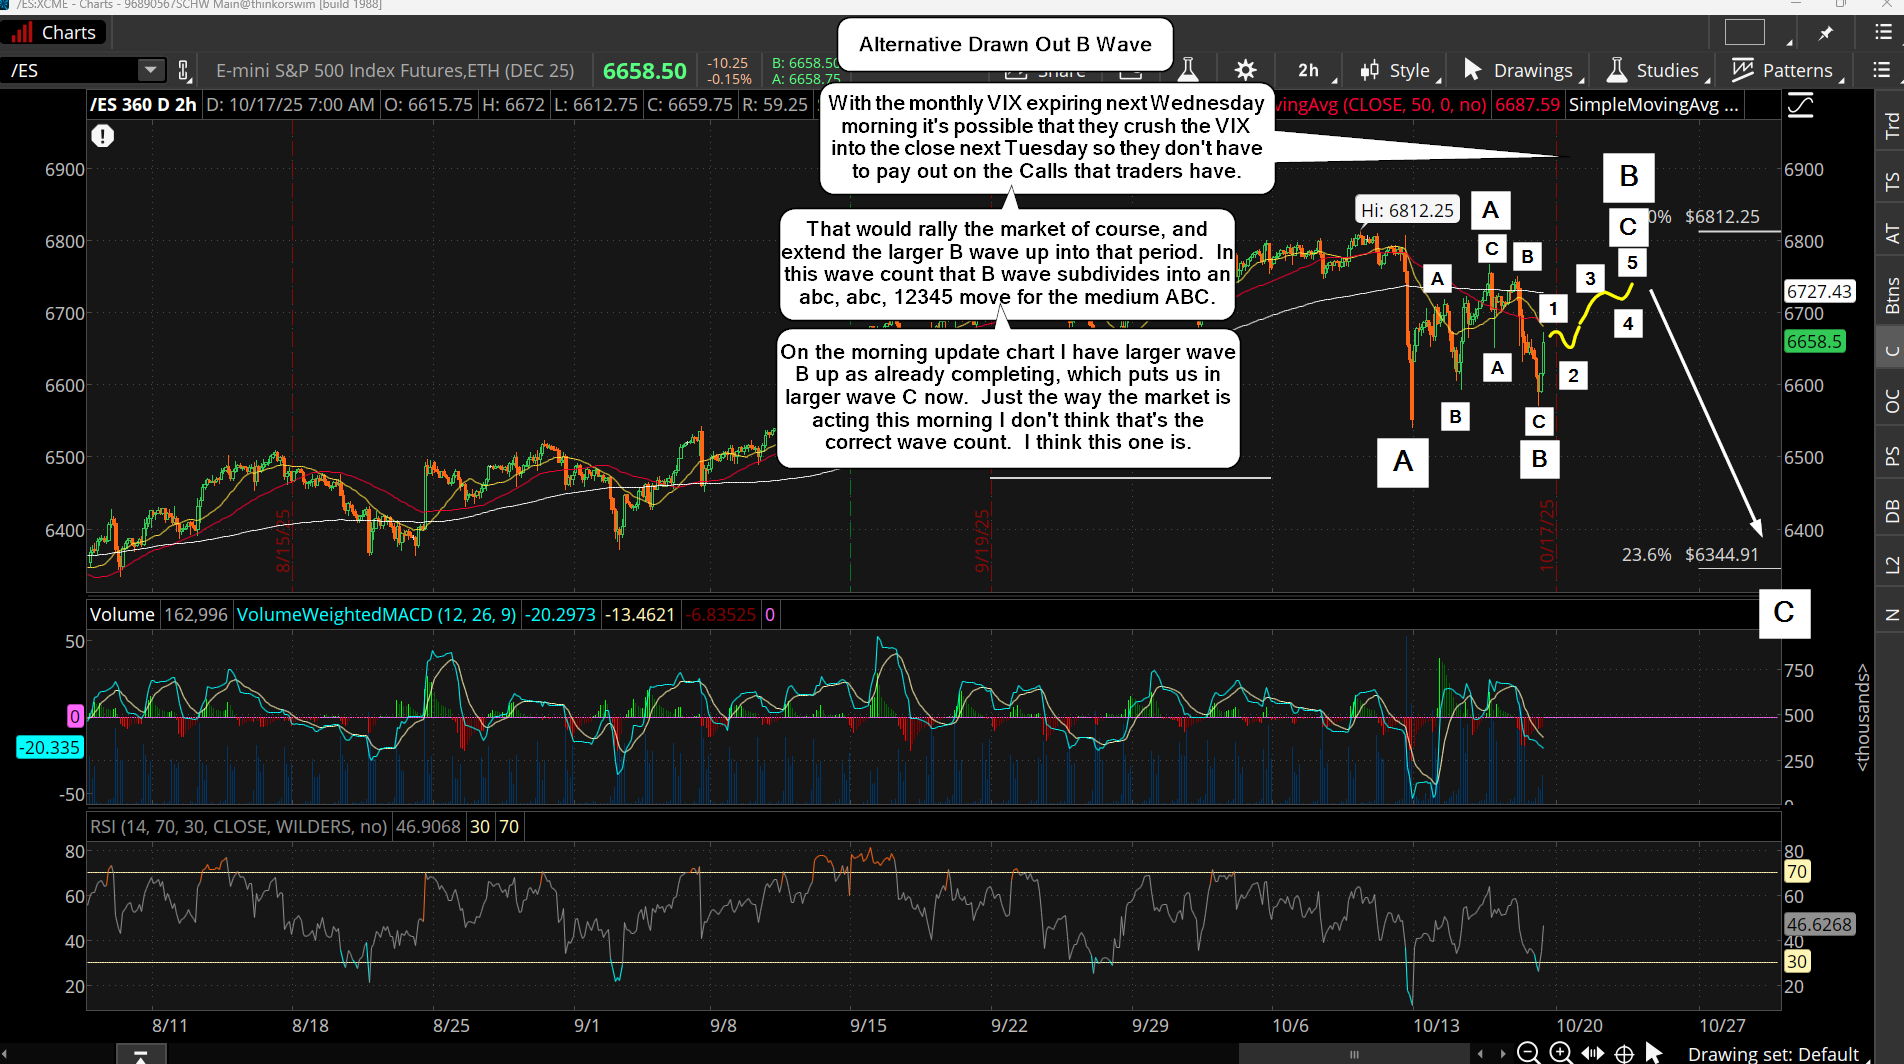
But again, it's all just a best guess and you never know until after it's all over with. For now though I think we chop Tuesday without much upside, and maybe a little downside... but not much there either. The reason is the monthly VIX as the last trading day is today with it officially expiring all those monthly options at 9am EST on Wednesday, which is before the open so it can't be traded. Therefore I think "they" will keep the VIX flat or lower until after it expires, and that means the ES/SPX shouldn't do anything much today but chop.
If we make a new high, then the drop should be bigger I'd think, but assuming we don't then the drop should only take out the October 10th low by 50-100 points to hit the stops on bulls. The we rally into November 6th for (hopefully) a new higher high to kill the last bear alive. After that some kind of "event" should happen to cause a crash. I will explain more later if the current moves play out as I've forecast.
This week I'm looking for more upside into Wednesday to get the VIX down lower as it expires Wednesday morning at the open, so Tuesday at the close is the last trading for it. Because market makers want it down, so that they don't have to pay out on the calls, we should not see the ES/SPX do much downside, (if any?) and should see more upside to take out bears currently trying to short it.
I posted a chart on it on X shortly after the open Friday as I felt my current wave count needed to be updated to one where there's more subdividing waves. That chart is below...
After Wednesday though the monthly VIX will have expired for October and therefore it can be pushed back up again, and that means down in the ES/SPX. There's still a good chance that the recent low on October 10th will be taken out into next week, and I'm not expecting a lot below it, but we could see 50-100 points below that 6540 ES low to hit all the stops on the longs.
Then we can see a face ripper into my target date of November 6th for a slightly higher high, which after that I think we could crash and fill the gap on the ES down around 5339, and that will have every bear in the world looking for the April low to get hit next. But if I'm right that won't happen and we'll turn back up in a major big squeeze from that 5339 zone, with a new high into January most likely.
As for today... up into Wednesday, but not a new high , just a stop run on the bears shorting the peaks last week.
We rolled over yesterday to start what should be a wave 3 down inside a C wave. That wave 3 is probably going to subdivide into 5 smaller waves and with today being OPEX we could see the wave 2 bounce with yesterdays drop being the wave 1 down. If this happens we'll see the wave 3 of 3 of C down on Monday and into Tuesday where we could see the bottom of this move get hit, which I still think is around the 6400 zone.
Basically the market will want to break the low from last Friday to hit all the stops on the bulls, and after that the bears will be loaded up fully short and we should see a powerful rally back up the rest of the week. In conclusion I'm looking for a "pause" today that looks bullish but should hold support and not break it until Monday.
I only say that because today is OPEX and they might want the market to close around a certain zone to pin it for max profit of expiring options. The wave count is very bearish, and so are the technicals, which both support a bounce, but how long it holds is unknown. It might hold all day long and at the last hour rollover hard and keep going into next Monday. But I lean is that it holds all day to close the week out.
I've modified the wave count a little as I think we are going to do part of the "My lean wave count" from yesterdays post, as market is looking like it's following that path the closest... meaning the "The crash wave count" chart now has low odds of playing out. The market could be accelerating the timeline some too as on the "My lean wave count" chart I think we could complete the larger C wave down by tomorrow or next Monday, instead of the last week of this month.
It's still the same target zone of 6400 on the ES, and should still complete the even larger wave 4 down. It will then setup the market for a powerful rally into the first week of November where we could see a higher high and complete the even larger wave 5 that everyone is looking for 7400+ to happen. I don't know if that is going to play or not?
I doubt it though as I think we'll be lucky to scratch out a slightly higher high, and the tariff wars between the US and China are getting more and more heated, and the government shutdown isn't looking likely to be resolved either. I don't think Trump is going to back down from China, and the Democrats aren't going to give an inch either. I suspect both parties are going to let the market fall apart and we won't see the Fed come in with massive QE until we are much, much lower.
Without it I just don't see a blow off top happening into early November. Assuming we drop to the 6400's in the next few days, I think the final wave 5 up will be a tough one that just uses trapped bears for fuel to keep the squeeze going. I don't think the smart money will buy, as they will most likely just wait for the double top to get hit (maybe a pierce high to take out the last bear?) where they will short the crap out of the market.
Anyway, that's all just guessing with the politics, but it does seem likely. Plus the technicals support it as the market is way more overbought on the bigger time frames and it's only going to be the shorter time frames that give the market the bounce after one more pullback. We could still see a crash happen, but not until after the last higher high. I have a good reason to think it will be on November 6th, but let's get past this week and next before I go into to much detail on it.