Sunday, August 23, 2026
Home Blog Page 20

ES Morning Update July 1st 2024

0

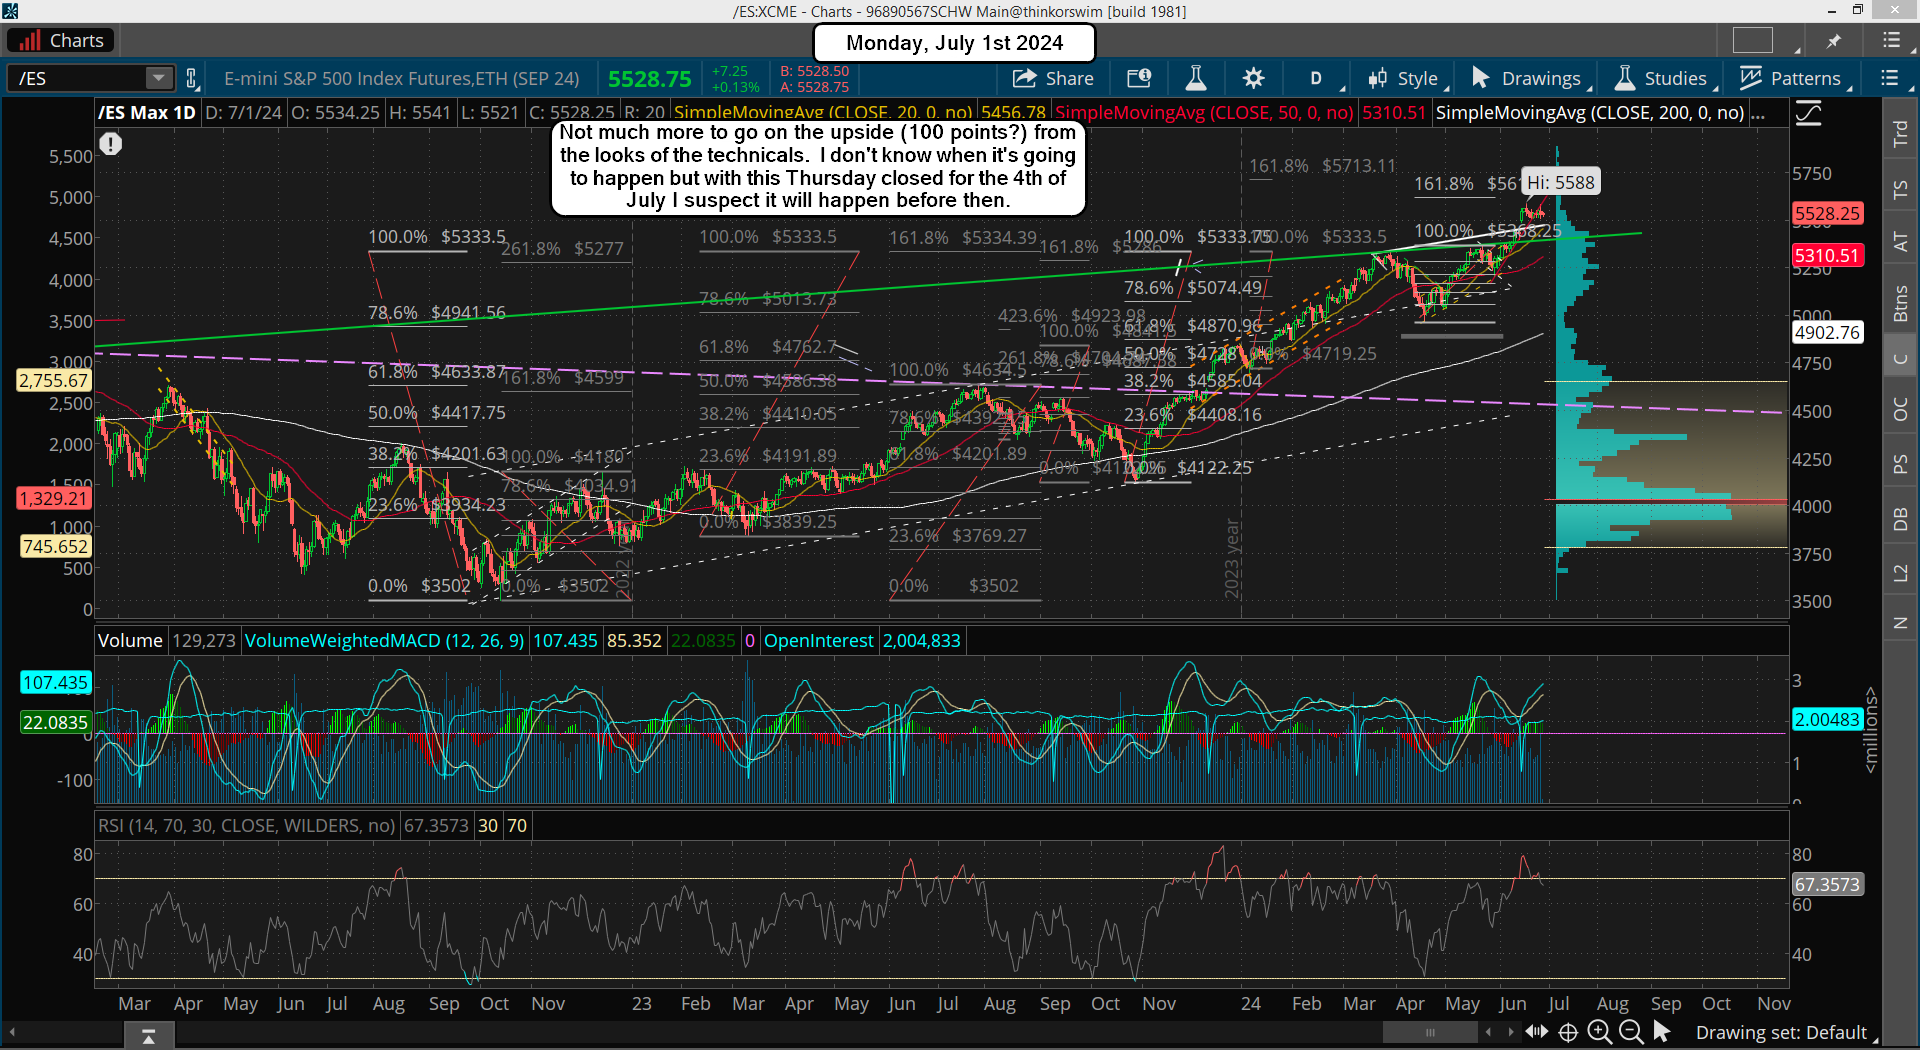
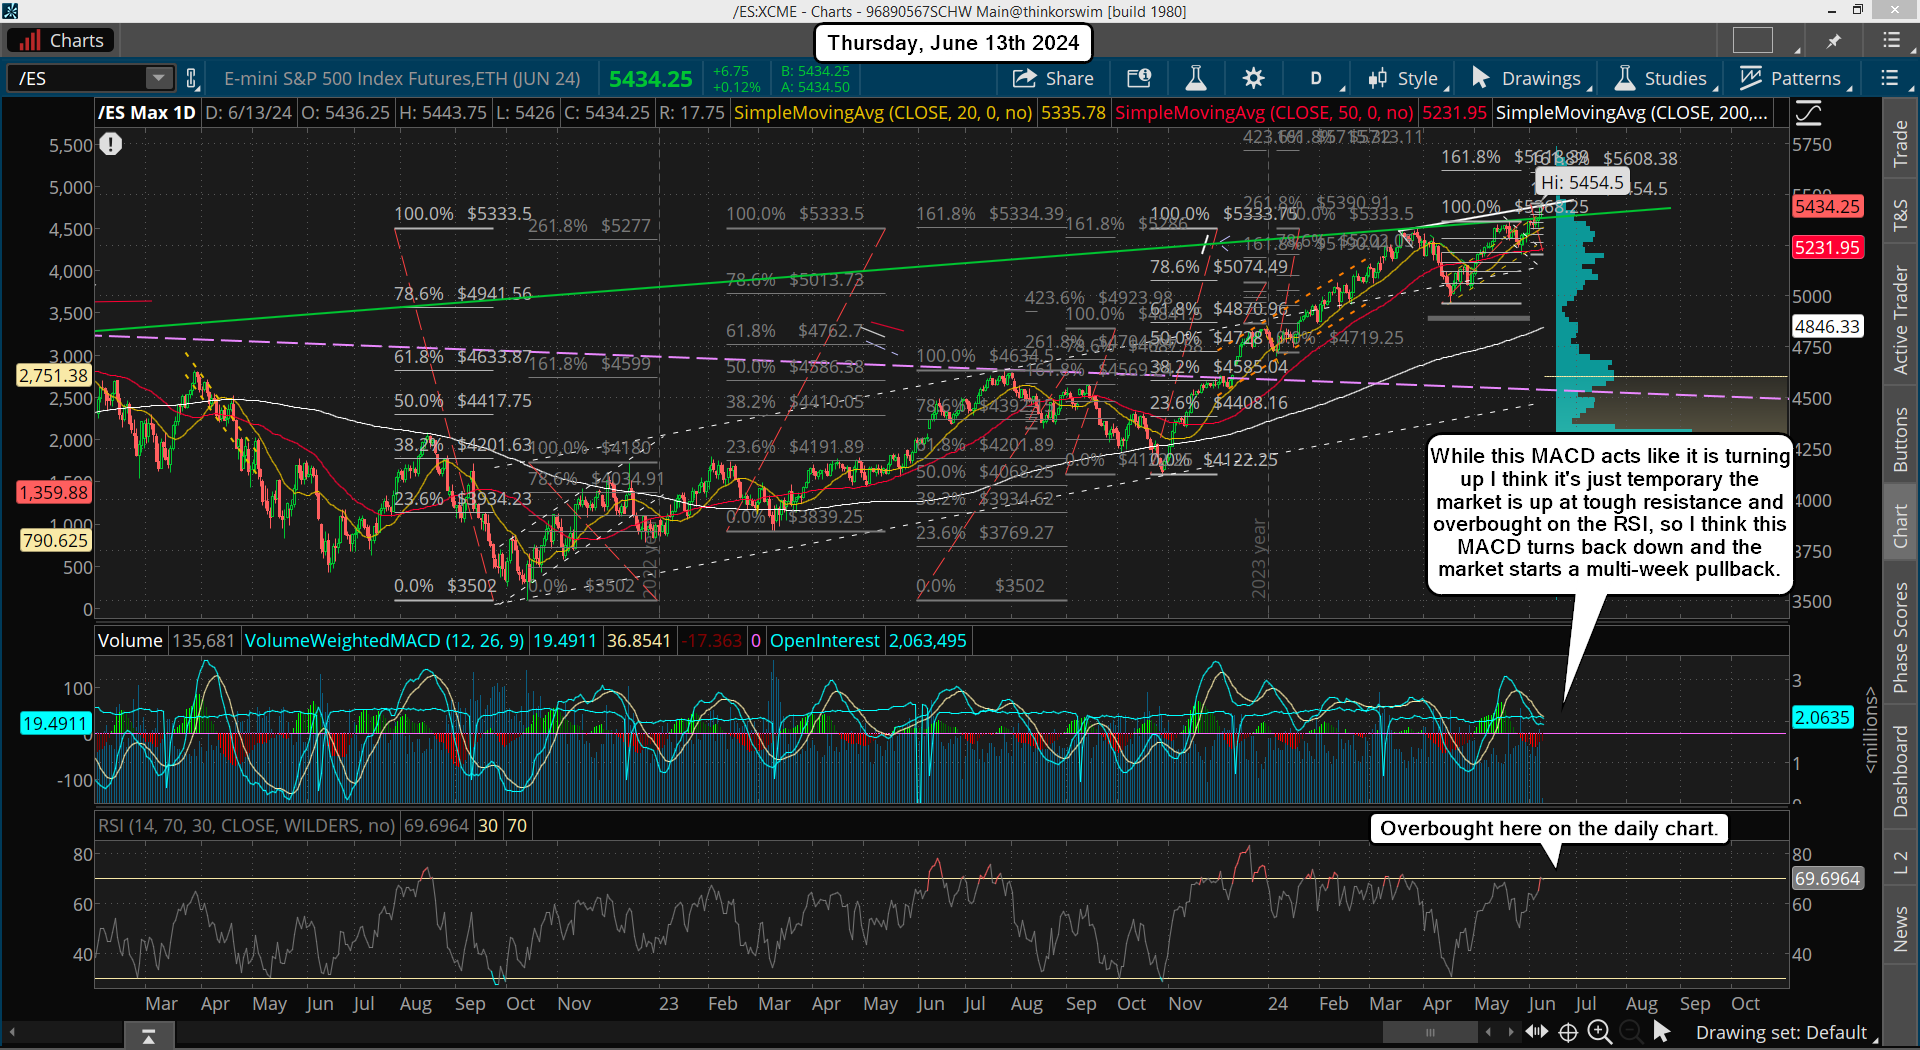
The market has spent the last several weeks in a choppy rangebound zone making another bull flag... but will it result in another month long rally? Anything is possible but I doubt if it happens this time around. The reason I say that is based on the past and how the technicals are aligned now, which similar patterns produced pullbacks from. Let's look at the daily chart below for example.
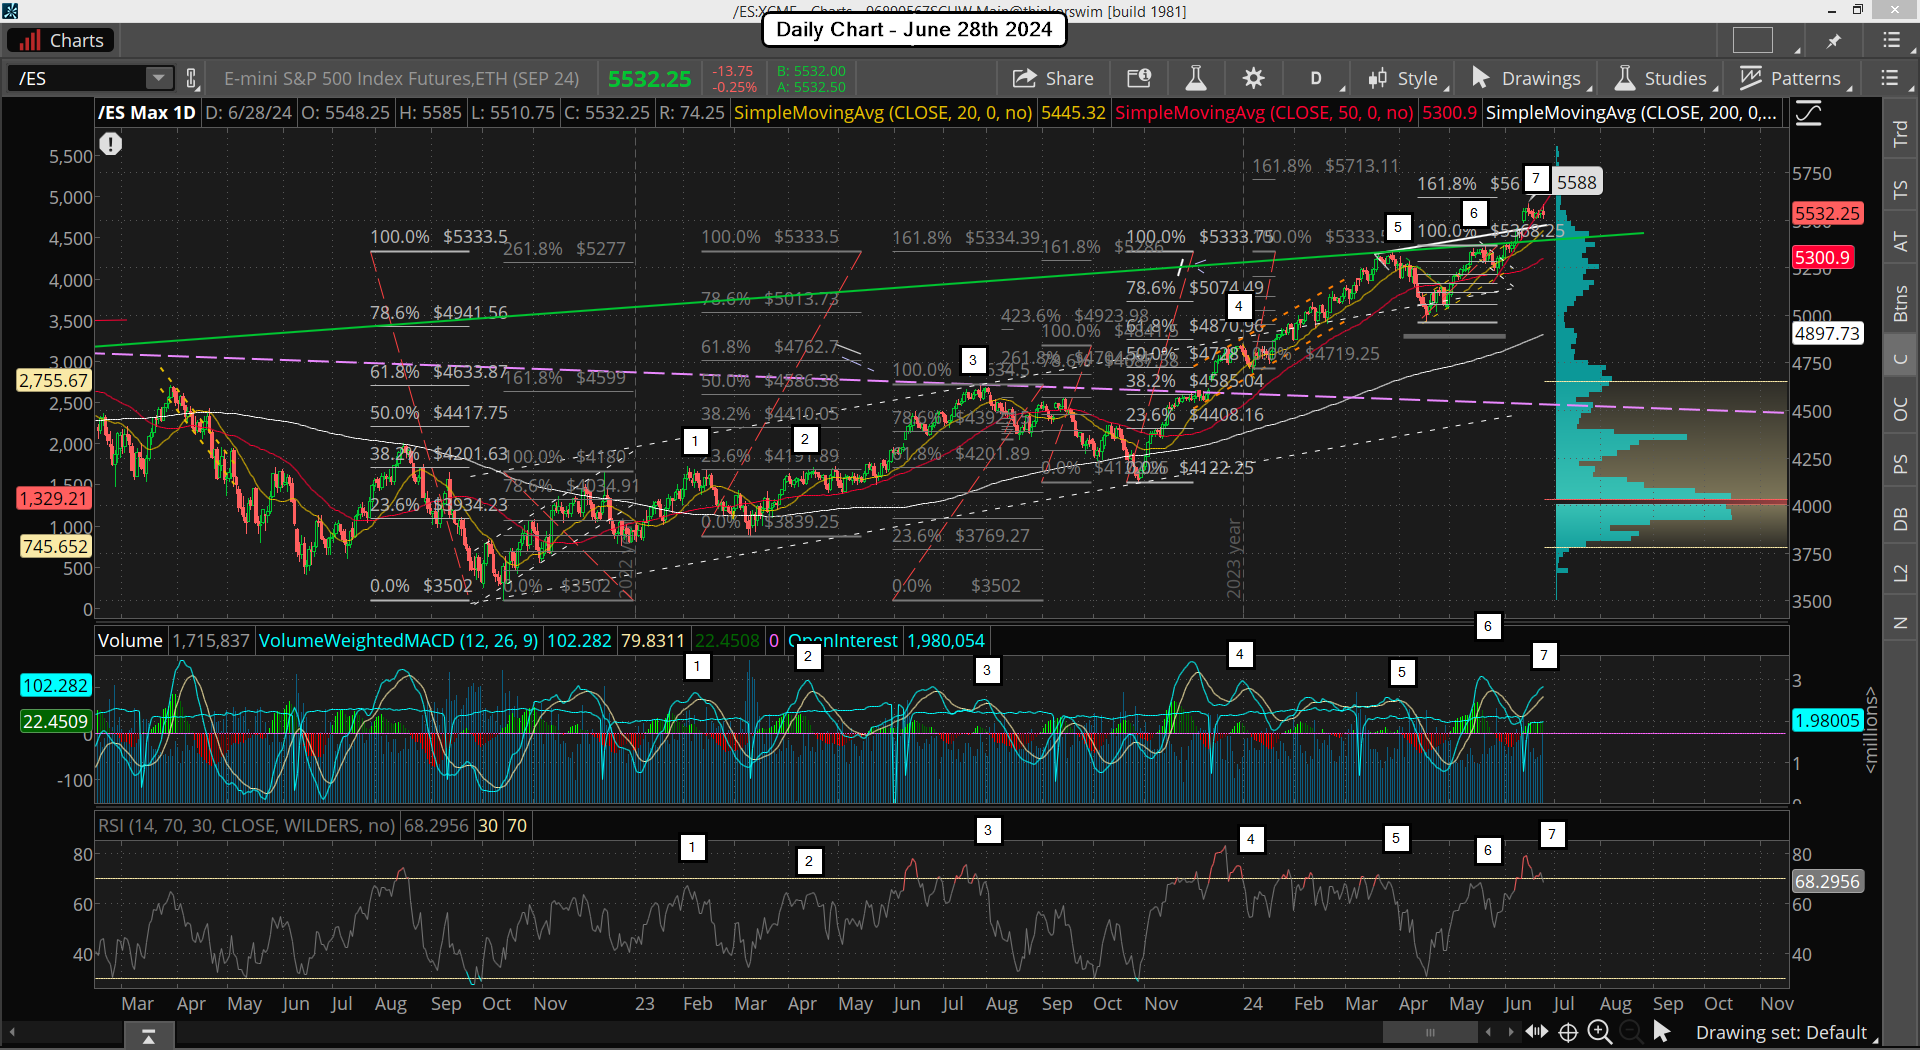
On it you will see that the MACD's and RSI were overbought during the prior similar patterns, just like they are now. And they produced a pullback in all the recent cases, which some were small and others bigger, but a pullback still happened. I'm only covering the period after the market bottomed in 2022 and started back up as we have to compare apples to apples and oranges to oranges... meaning uptrends to uptrends and downtrends to downtrends.

At point 1 the weekly chart was very oversold but the daily got overbought on the MACD and almost overbought on the RSI. A pullback happened, which was a backtest of the 200 day moving average, a common event when the downtrend is ending and an uptrend starting. Point 2 gave only a small pullback, which I'm sure was because the weekly chart was pointing up strongly from being very oversold on its' MACD's and the RSI around neutral. It would have been foolish to short it back then based on that alignment, and the smarter move would have been to wait on the MACD on the daily chart to turn back up and go long. Point 3 gave us a deeper pullback because the MACD on the weekly chart reached the overbought level. Chart below.
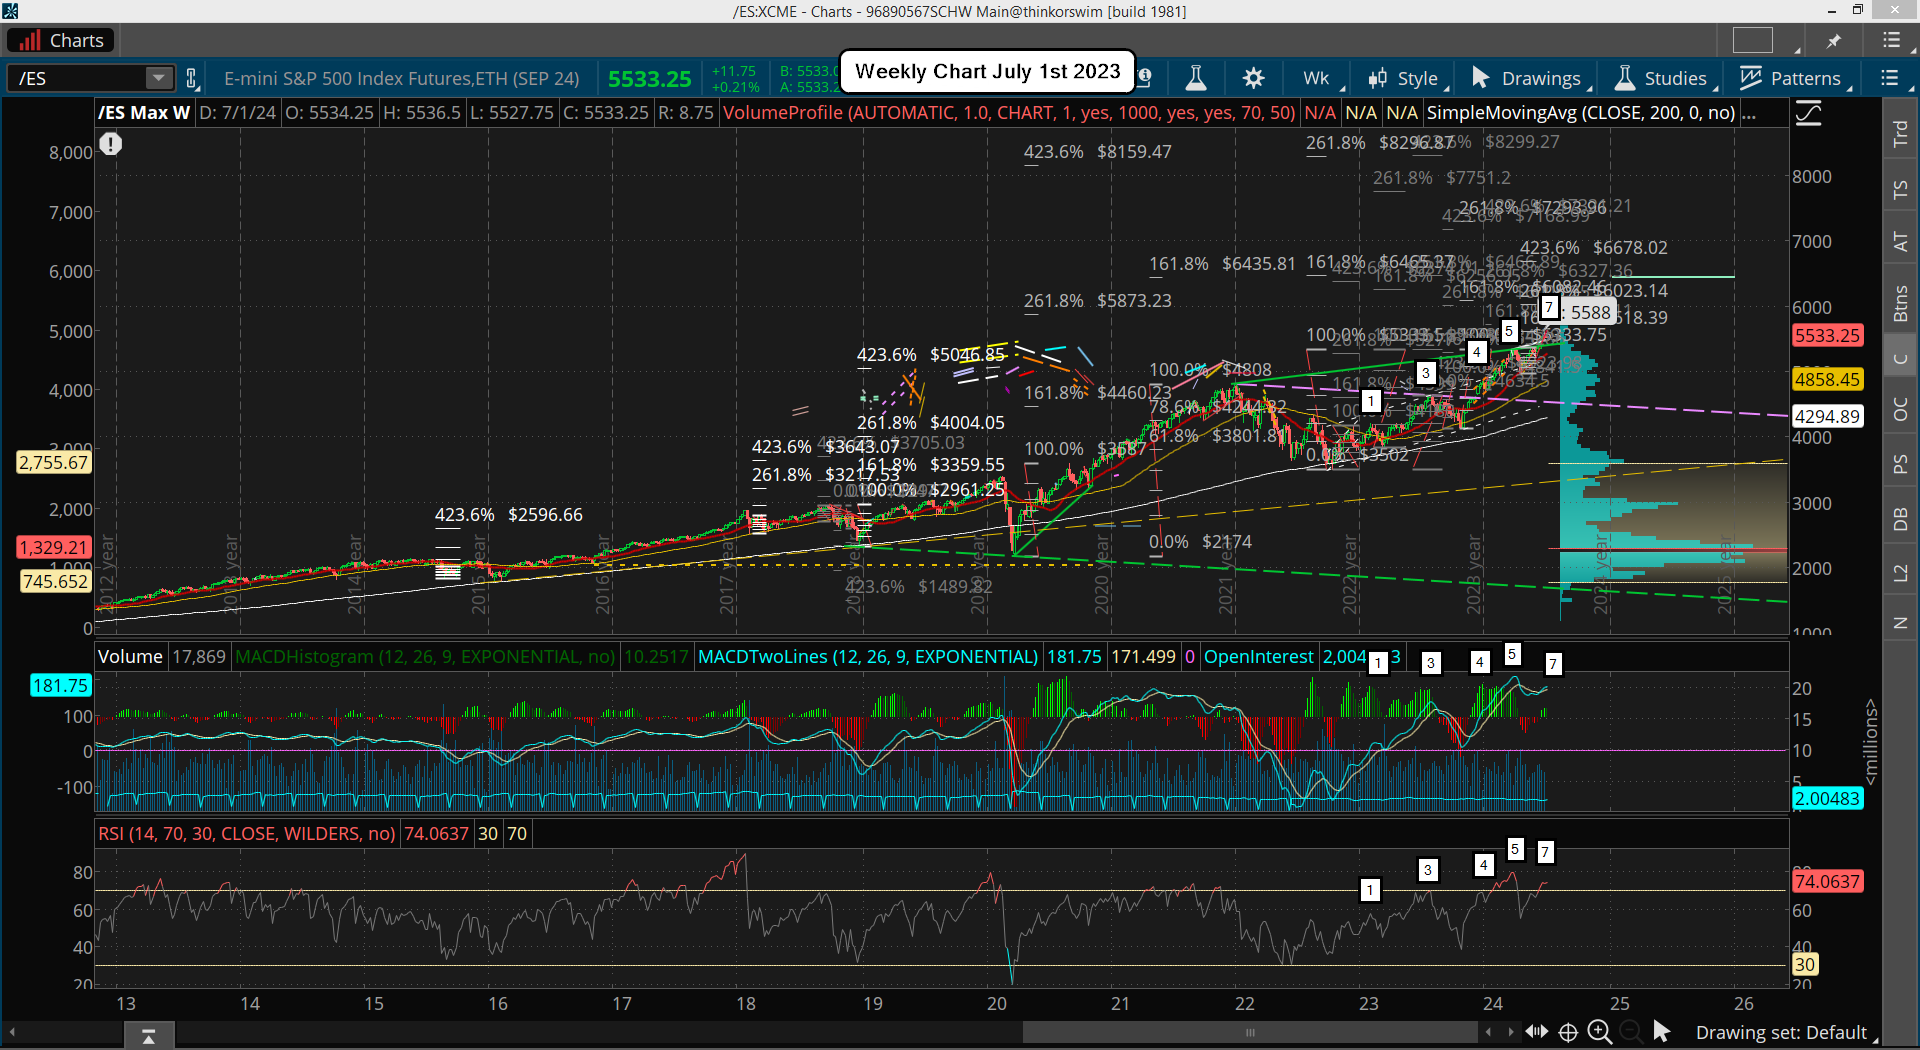
As you can see now on the weekly (and daily) charts the pullback from point 3 needed to be a bigger one because both the charts got overbought on the MACD's and RSI. When more time frames align together there's always a bigger move, whether up or down, and in that case it was down.

At point 4 the weekly chart was pushing up strong again on it's MACD and RSI, reach the same overbought level as on point 3, but that strength keep the pullback small from the daily. Point 5 is where the weekly chart got very overbought on its' MACD and RSI but the daily chart only a little overbought, which is the opposite of point 3. But it still produced a nice pullback as pressure from the weekly forced the daily chart to rollover. As you can figure out by now the deepest pullbacks were from periods where both the weekly and daily charts got overbought and I must conclude that from looking at both charts currently they appear to be overbought together again.

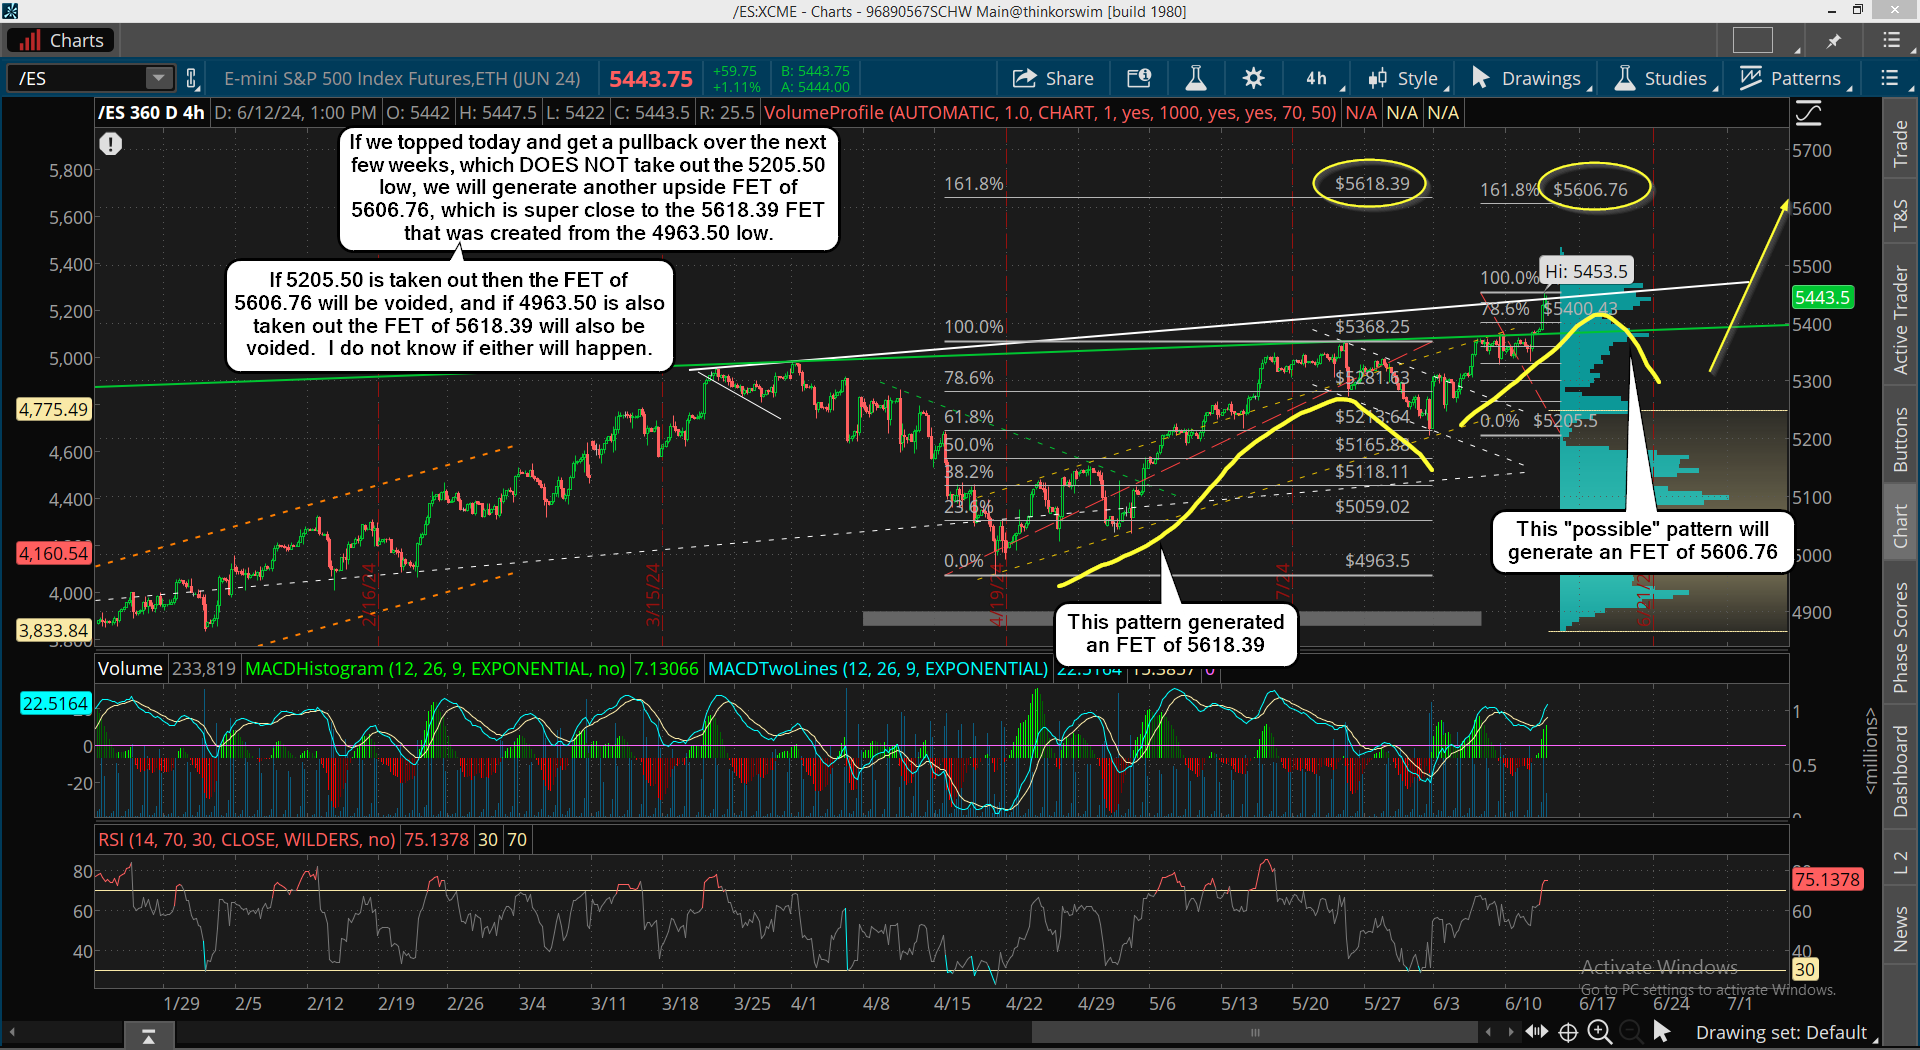
Therefore there's little left on the upside on my opinion before we see a nice pullback. My FET at 5618 is still on the table I think and should be hit this week. I say that because of the expected light volume due to the holiday on Thursday for the 4th of July. But next week every trader should be back and the volume with it. So going into the 2nd week of July is where I think we could see a nice pullback happen.

Have a blessed day.
ES Morning Update June 28th 2024

0

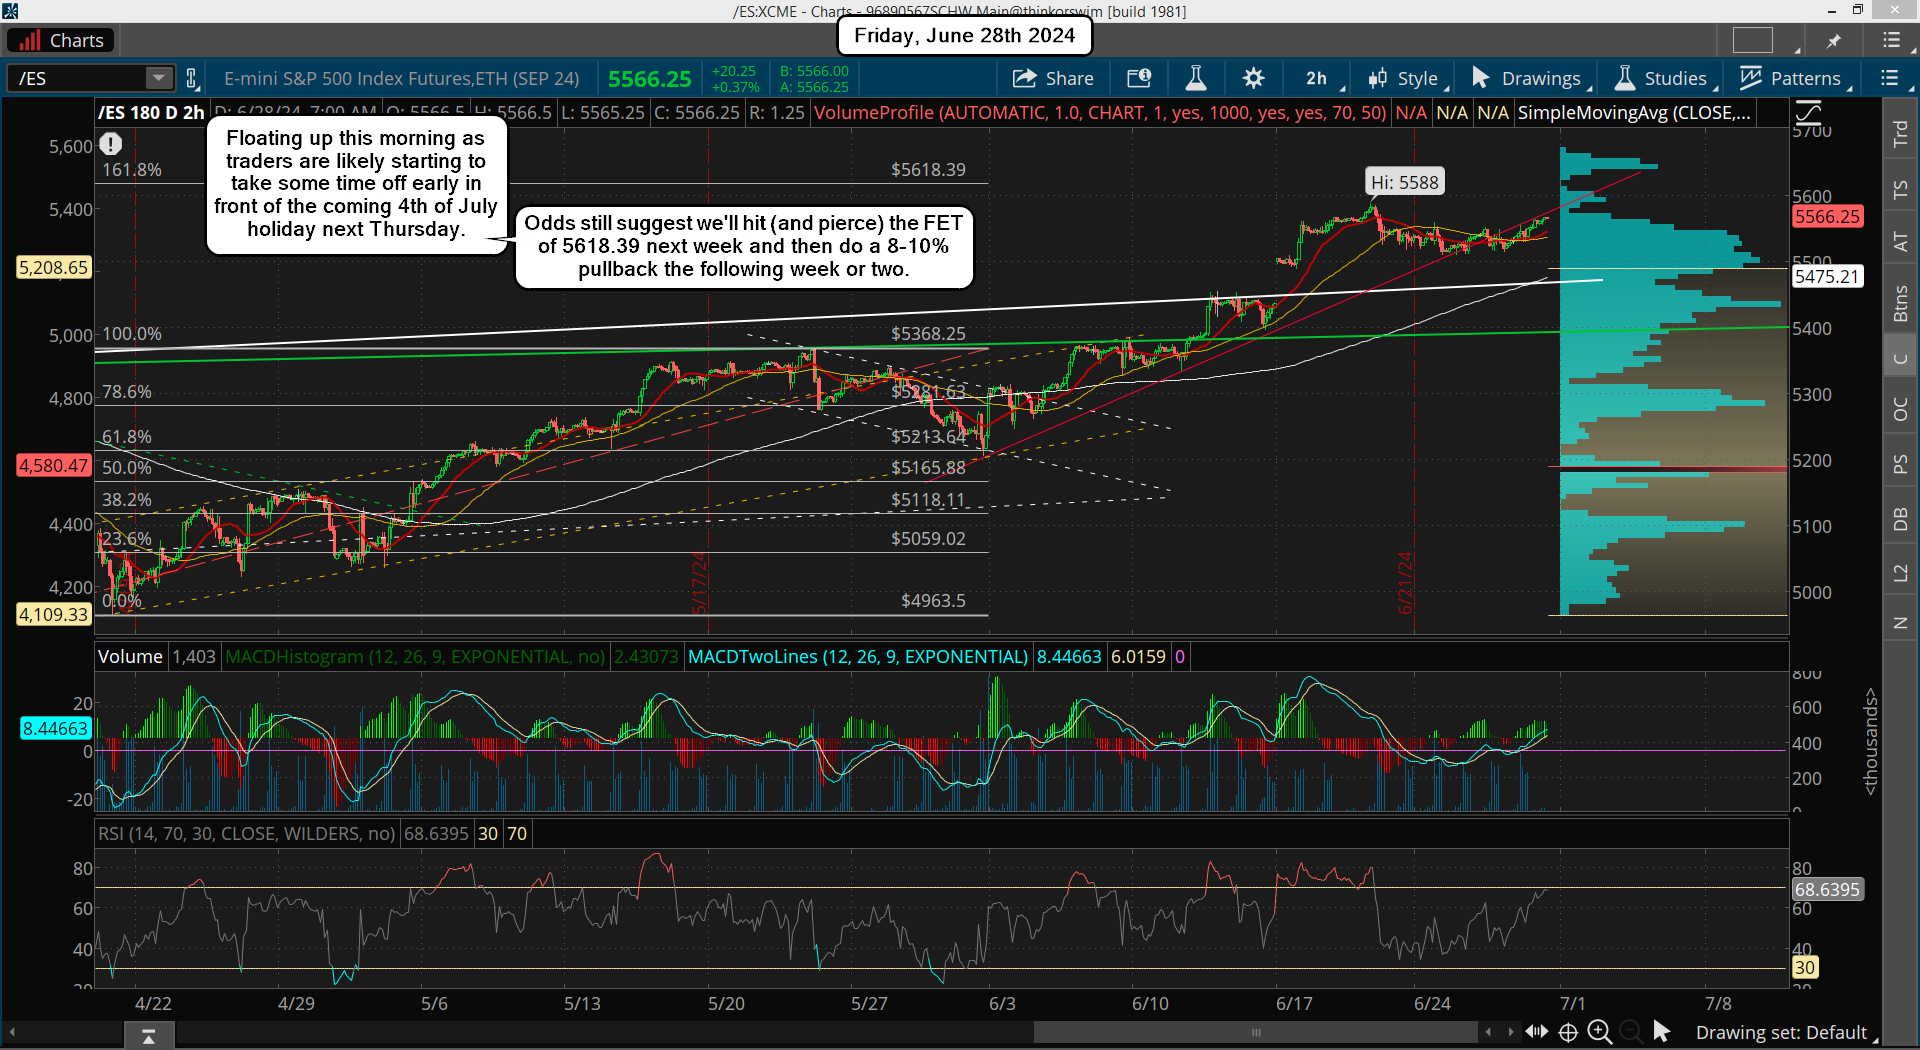
A rangebound market all week as expected. Today we rally some to close out this week and the month of June. The market is resting now before the next big move, which I still think is down 8-10%, but of course it could be up too. I mean, overbought charts can get more overbought, but they still suggest the move will be a down move. If we reach the FET next week, which seems likely to me, then the following week I'd look for the pullback. Light volume is very likely next week due to the 4th of July holiday, which tends to favor the upside, and as long as that happens the move after traders come back should be a down one. Nothing more to add here as this week has been as expected.

Have a great weekend.

ES Morning Update June 27th 2024

0

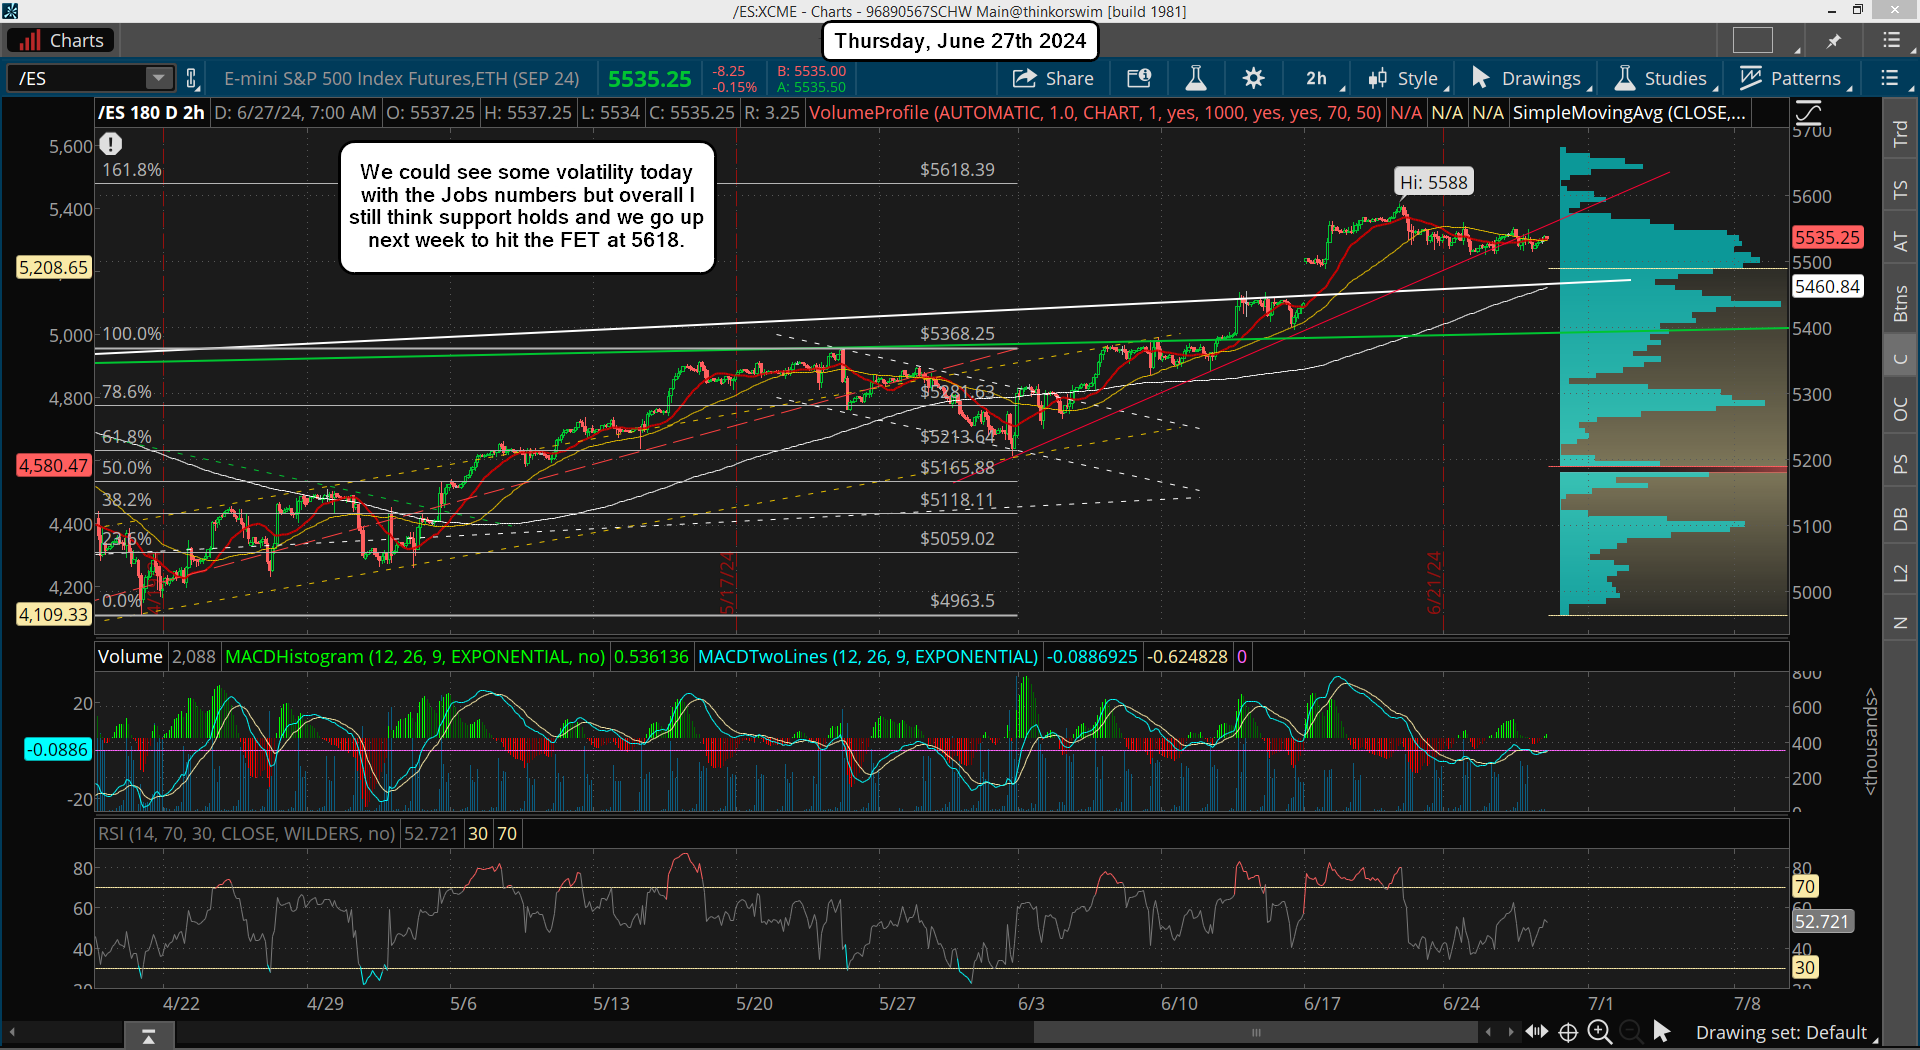
The market is still under pressure from the bears but holding the range quite well. We have Jobless Claims out this morning, so we could see some small volatility, as well as GDP numbers. Overall though I'm still waiting for the last move up to hit the FET at 5618, which I think will be next week due to the expected light volume from the 4th of July holiday. Support is still the rising white trendline, and if it gets pierced the rising green trendline should hold. I don't think it will be hit but certainly possible. If we get more weakness today and part of tomorrow, then it will setup next week for that last move up.

Have a blessed day.
ES Morning Update June 26th 2024

0

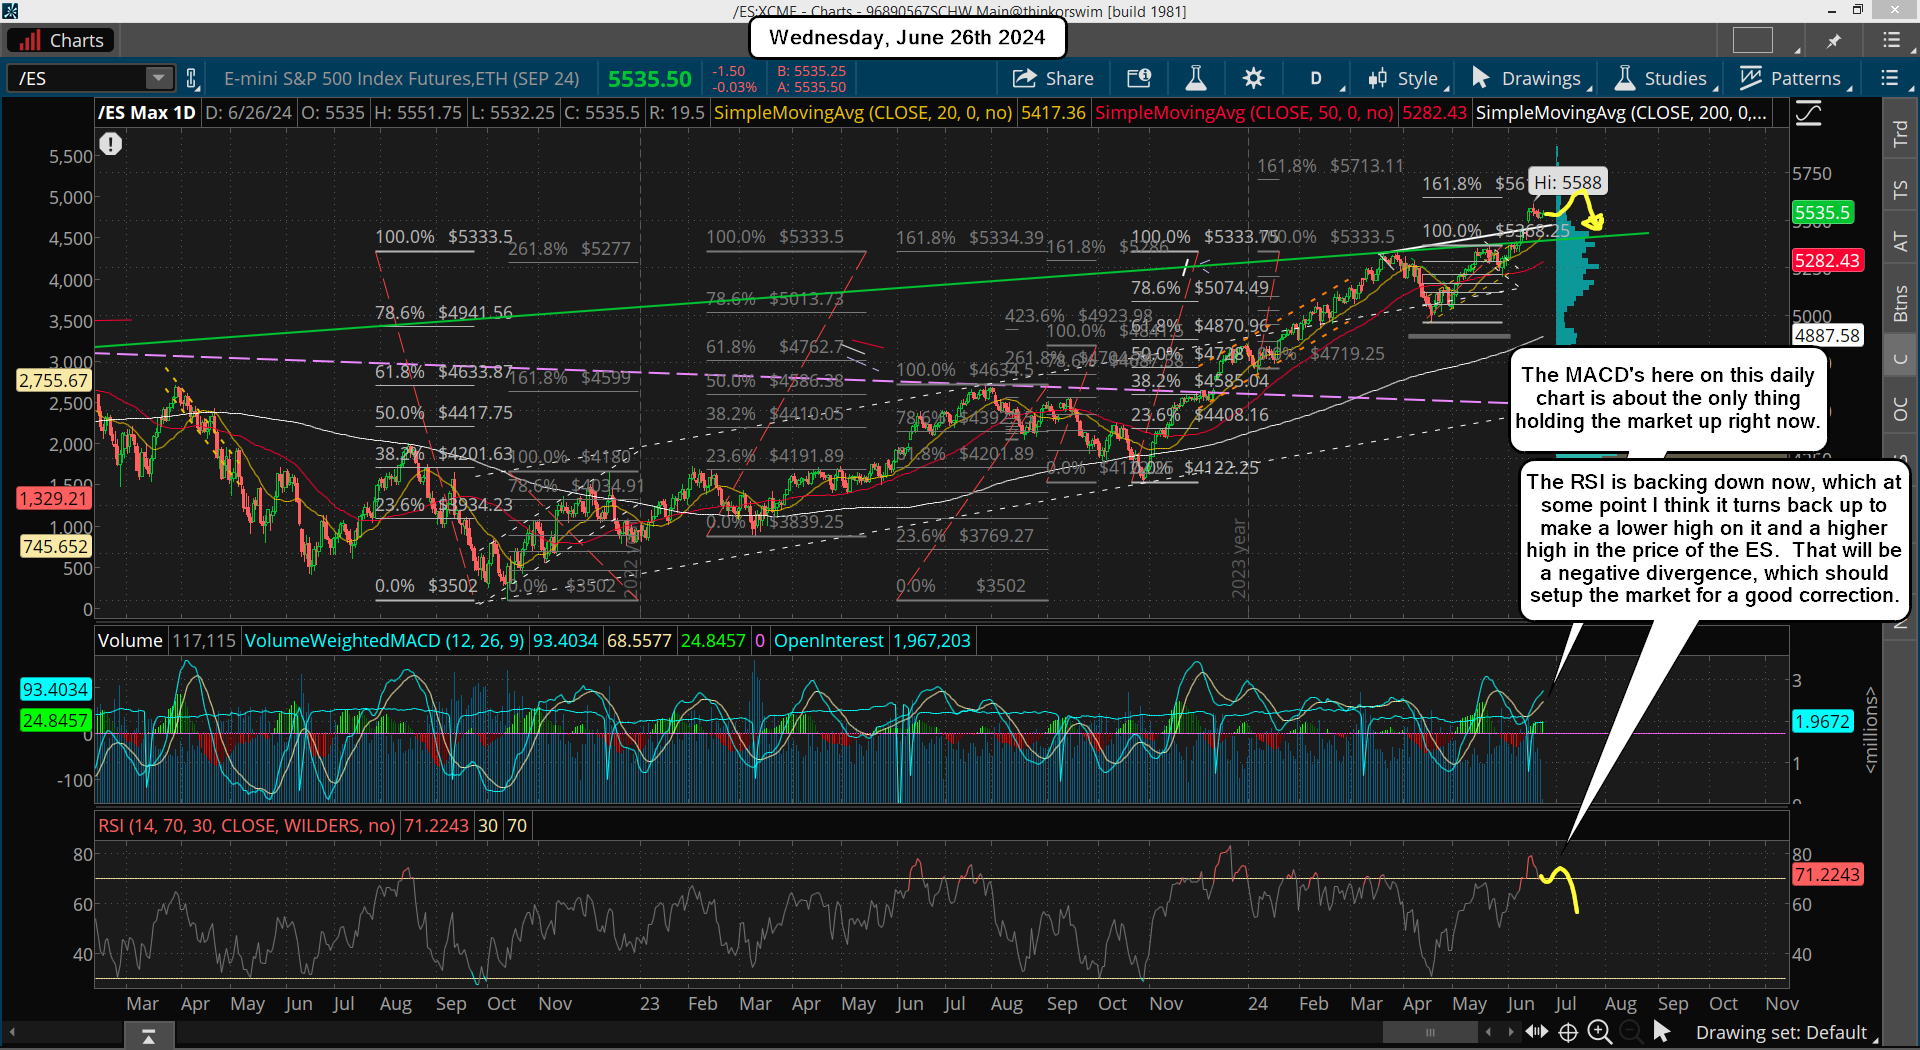
Another boring day yesterday, and today will probably be the same. There's just nothing to add that hasn't already been covered on Monday and this week is playing out as expected... a lot of chop. I don't have anything new to add as I still think we have one more move higher to hit my FET at 5618, and I think it will be hit before the 4th of July. My best guess is the 3rd but I could be wrong and we could hit it this week. We shall see.

Have a blessed day.
ES Morning Update June 25th 2024

0

Yesterday was pretty much as expected as we bounced early in the day and pulled back late in the day. I think this chop will continue all week with bounces intraday and small pullbacks too. I'm sure they will flip it from day to day where we sell off first and rally second but in the end the market should stay in a fairly tight range from the all time high down to as low as 5400, but that's only if the white trendline fails. Otherwise 5450+ seems more likely to hold the dips as that's around the zone where the white trendline is at now. Nothing more to add as I covered it all yesterday.

Have a blessed day.
ES Morning Update June 24th 2024

0

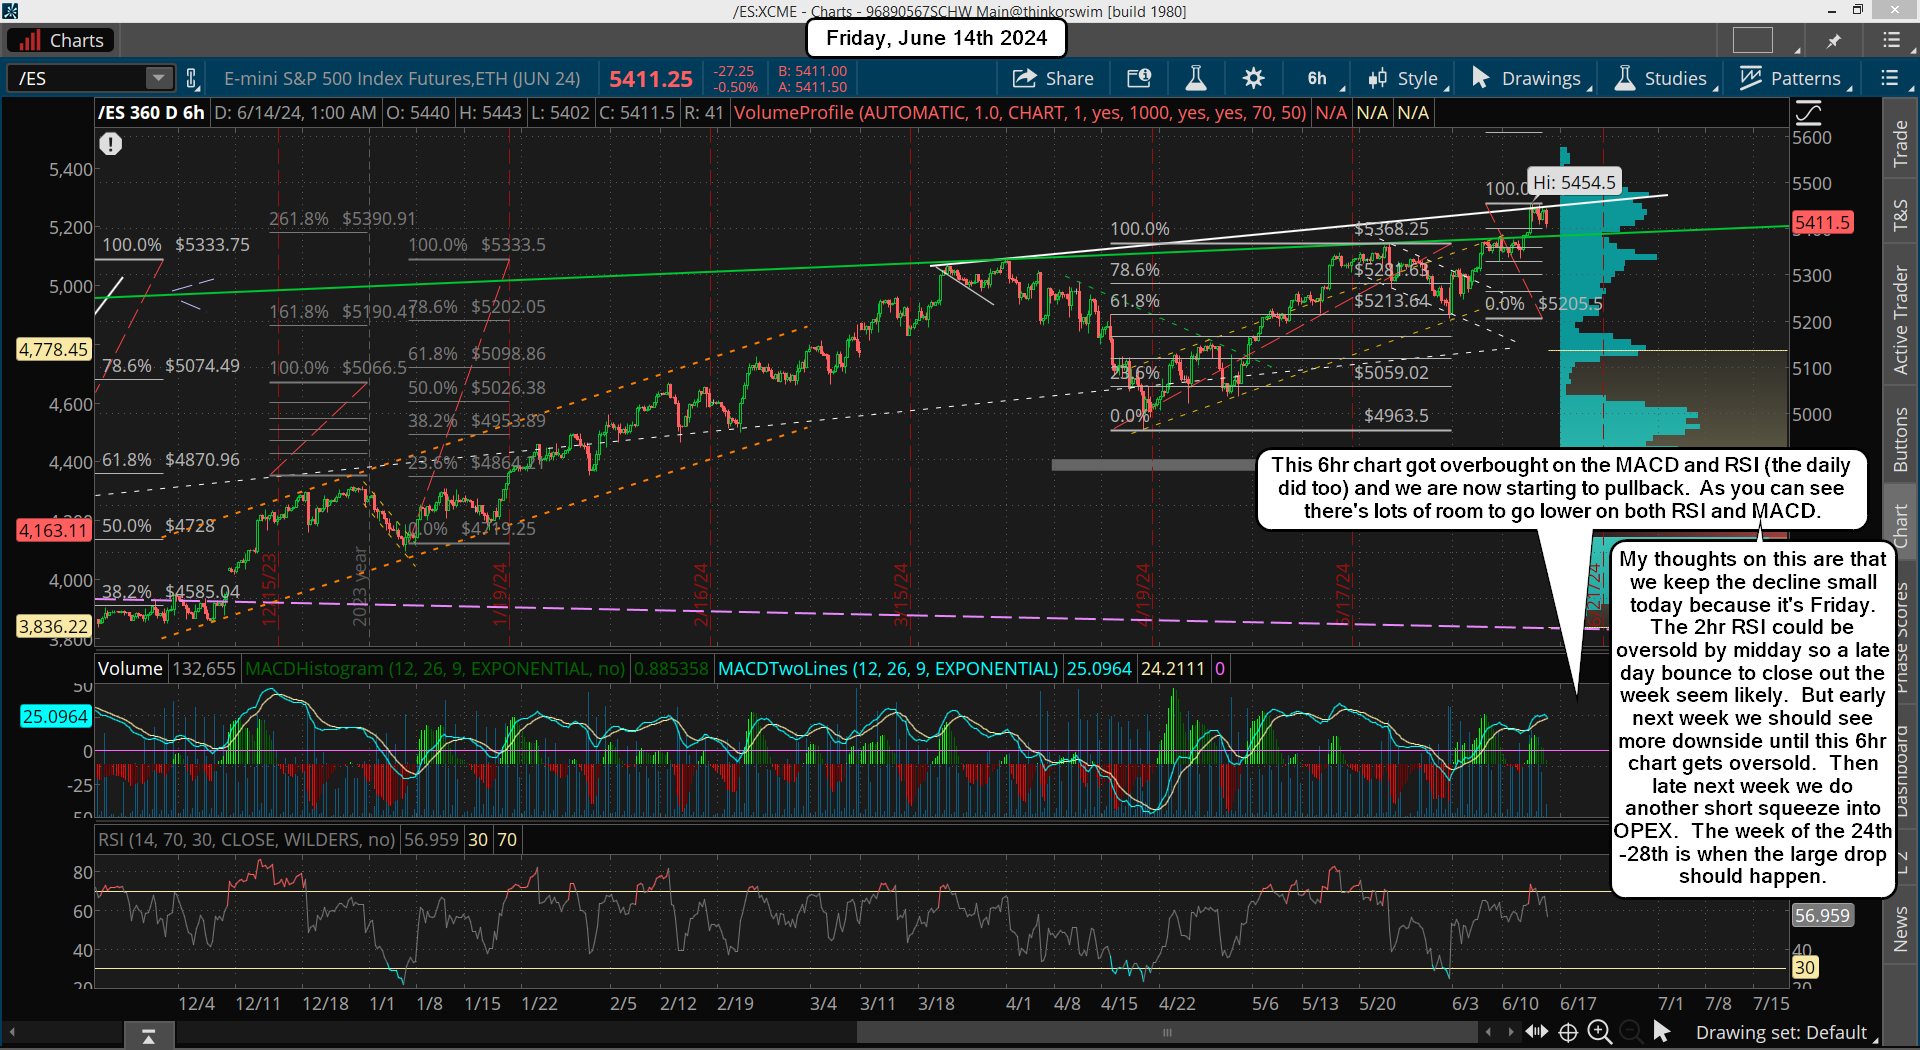
Last Friday was as expected, a nothing day. We did have an early bounce but it didn't hold and we pulled back again and just chopped the rest of the day closing slightly down. This is the last week of the June and as I said previously "turns" commonly happen around the end or beginning of every month. The technicals are overbought pretty much everywhere, from the weekly, daily and down to the 6hr chart.

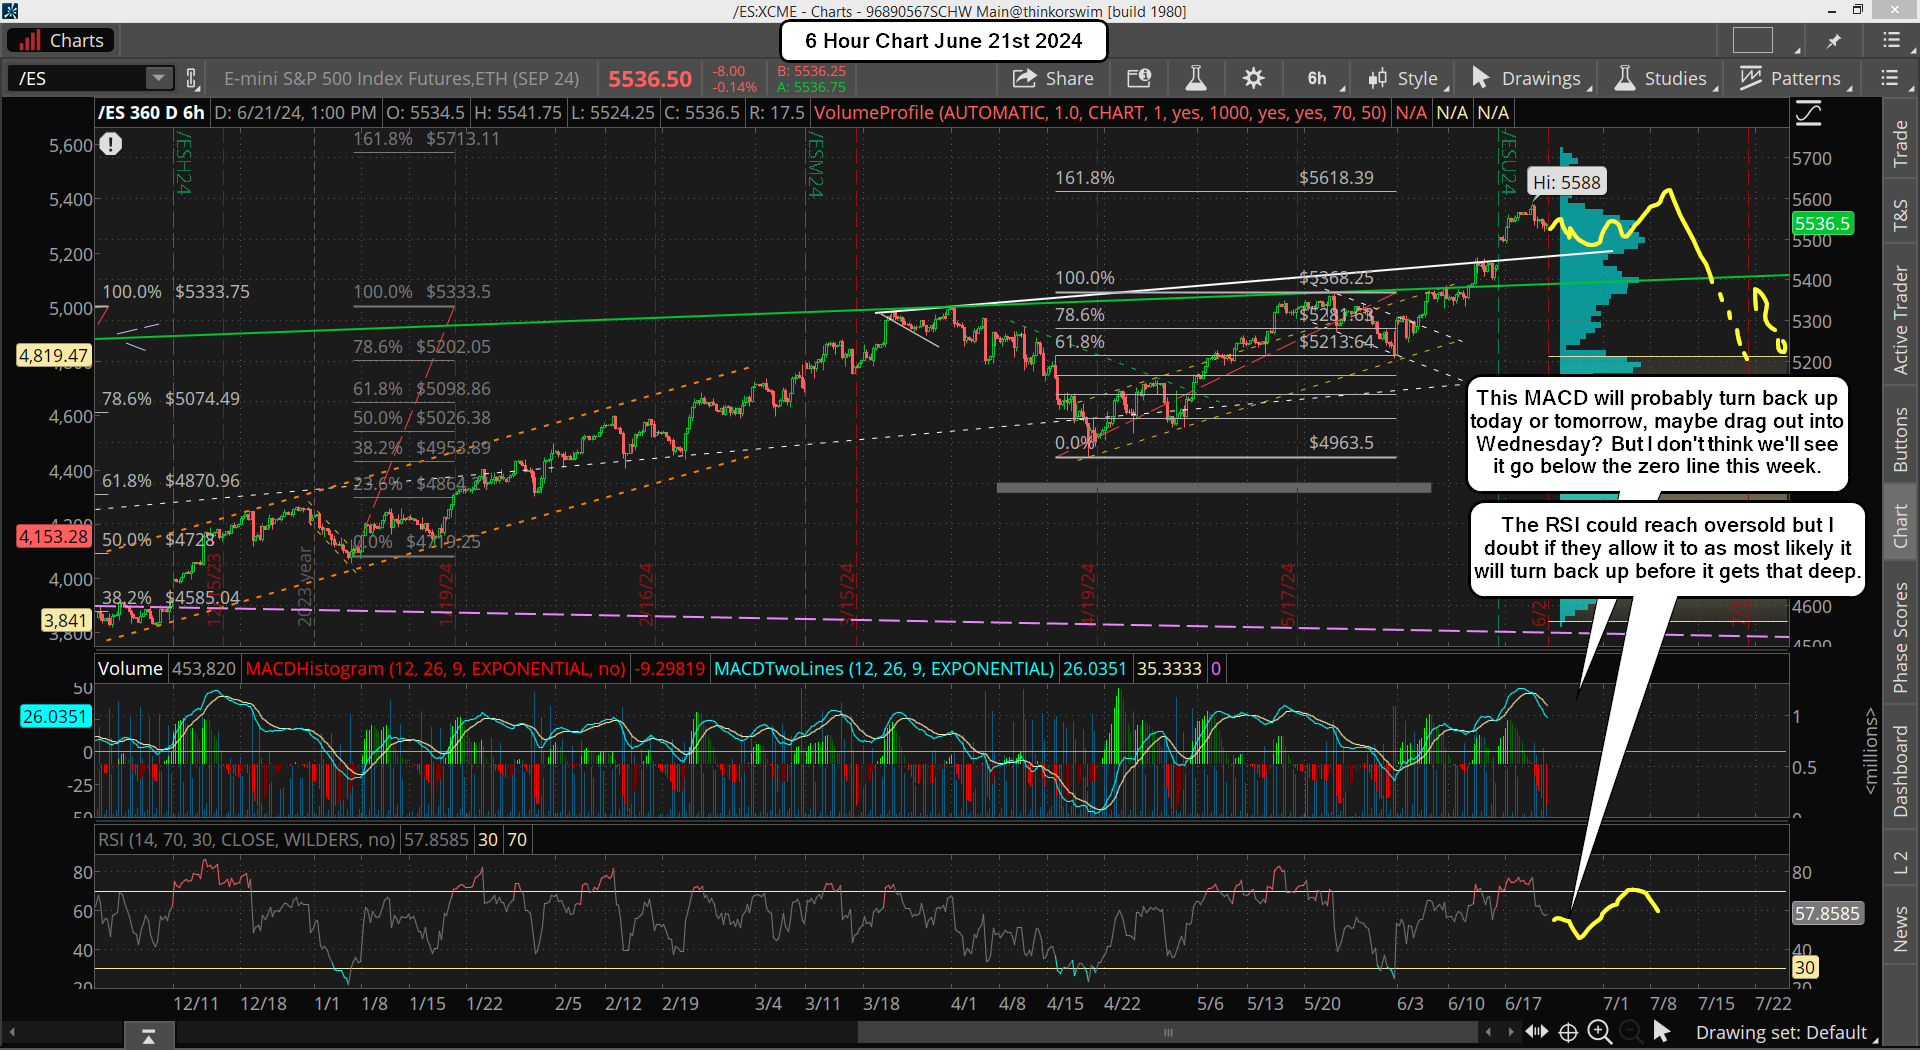
But the time frames less then 6hr could get oversold early this week and allow for one more push up into the end of the month to hit the FET of 5618, which I think still has pretty good odds of it being reached. If this happens then the "turn" will be a move down of course, whereas if instead we pullback then the turn will be up... and this really feels like a lower odds forecast as I just think we are so close to the FET, and the bigger time frames are so overbought, that a significant pullback is coming. Not a 1,2 or even 3 percent move, but a possible 10% move, which should last for a few week I'd think so that the weekly chart can reset from being so overbought.

As far as "what" could spark the big move down I point to the CPI on July 11th as a possible one, and that's also the date President Trump gets his sentence about whether or not he goes to jail for being a patriot convicted of 34 felonys with no actual charges. Yes, we now live in a communism country, and if we pullback early July, (an A wave?) and bounce into the 11th (a B wave?), we could have a nasty drop follow that opens the door again for the FP on the SPY from the Yahoo site as a possible target again.

The 11th of July will be an important date for sure, and normally we pullback some in front of important dates due to the "unknown" factor, as most traders want to be less exposed. This could take the form of an A wave down and B wave up, or maybe do the entire ABC in front of it and bottom into it? I doubt that happens but anything is possible I guess. We could also top into the date but again, there's low odds of that happening in my opinion. Most likely we top this week or early next week around my FET and then start down into the 11th with a possible one or two day squeeze for the B wave in front of (or after) that important date.

For the short term I think we pullback to find support around the rising white trendline, which is about 5500 or so on the ES, then bounce and possibly do one more trip down to test it again (might pierce it?) before we rally back up for the move to hit by FET at 5618, which again... could be hit by the end of this week, or early next week.

Have a blessed day.
ES Morning Update June 21st 2024

0

Finally... a pullback. But we failed to hit the FET at 5618, so I'm very leary of this move as I really think they will hit the FET before we get a deeper pullback. If it doesn't happen today then I'll still be looking for it to hit next week. Keep in mind that today is OPEX so I would not expect a whole lot to happen. They tend to "pin" the market at some level for max pain on options, so we could go sideways today.

Next week is bearish from a Seasonality point of view so the bulls will have that going against them, and very overbought charts. So the bulls will not want to give up much ground today if they plan on doing that last move up to the FET next week, which could happen in the Sunday futures or Monday open? I'll end it here as I don't have anything else to add.

Have a great weekend.

ES Morning Update June 20th 2024

0

Almost at the FET of 5618 now as the bulls continue to grind higher inch by inch. I could say it's overbought until I'm blue in the face but that doesn't seem to matter when the bulls have a target that they want to hit, and with tomorrow being OPEX it wouldn't shock me to see it hit into the close Friday. I posted a wave count on 6/6 showing what I think is most likely, and below is that chart again.

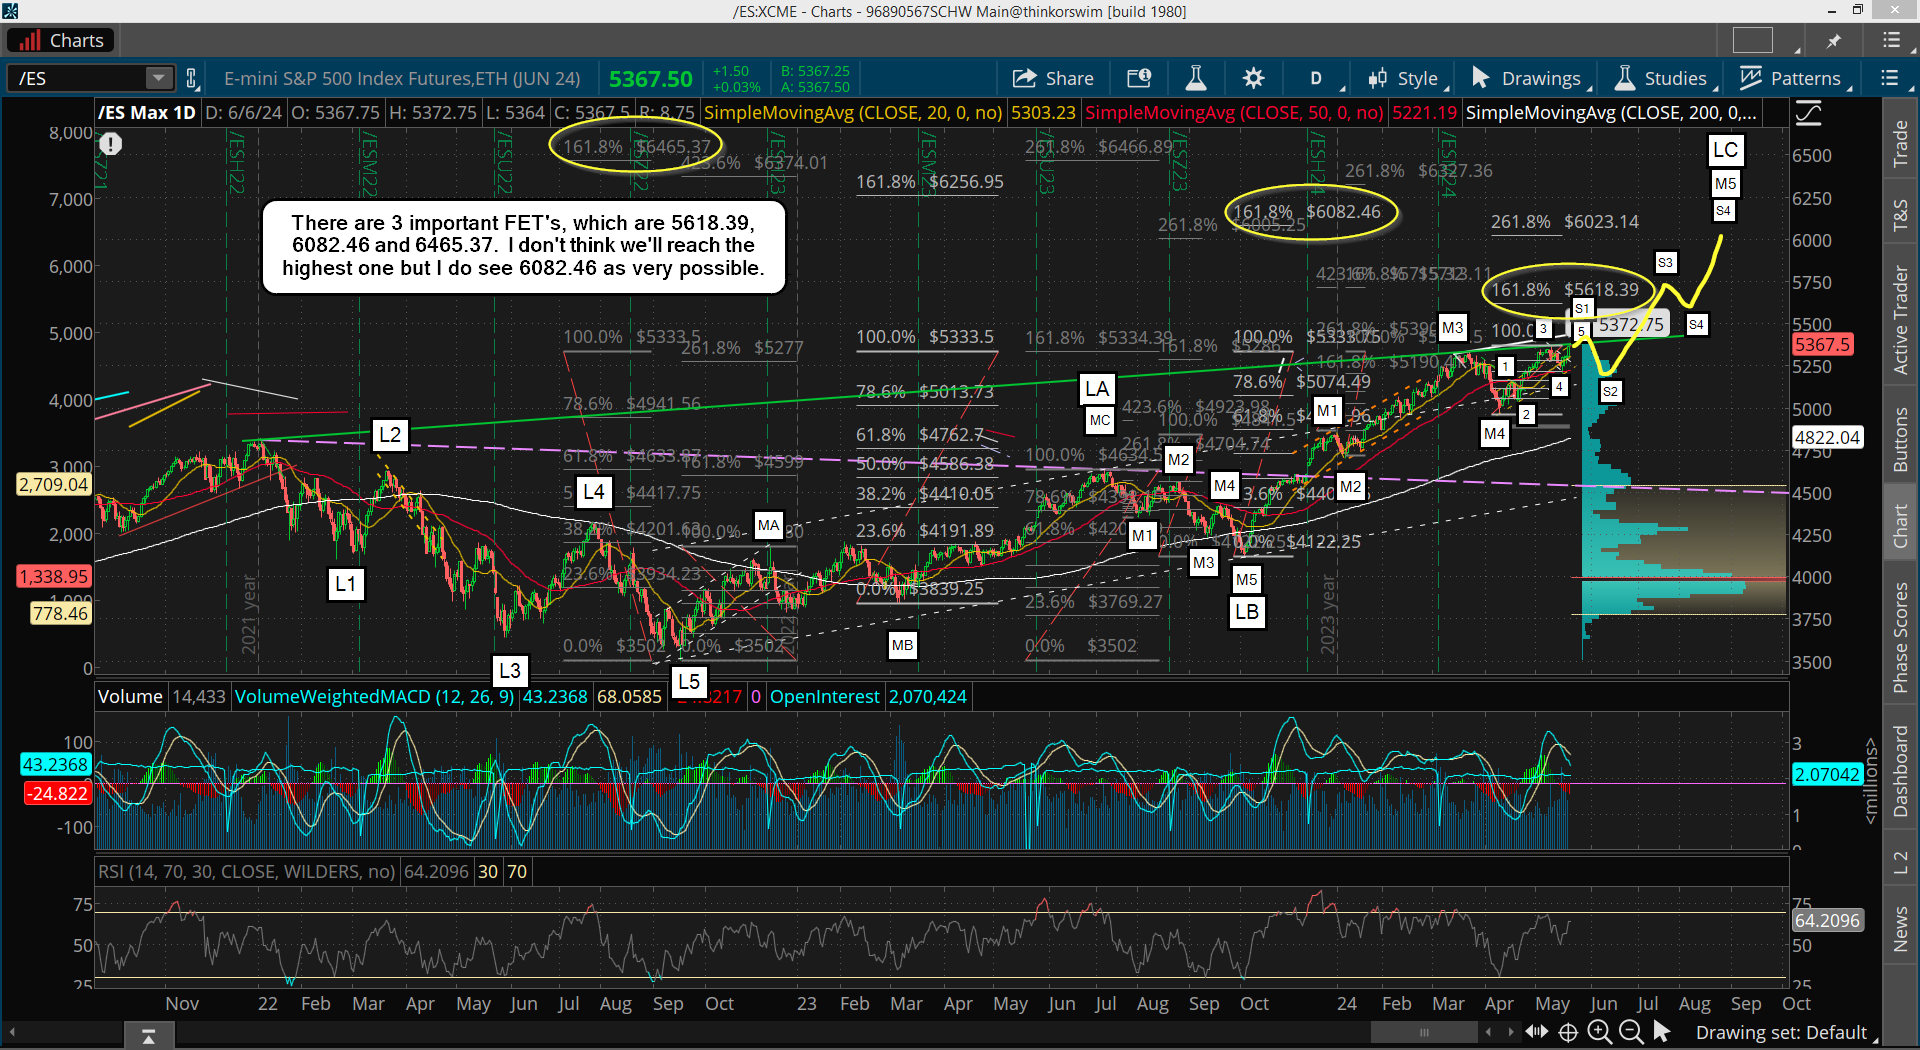
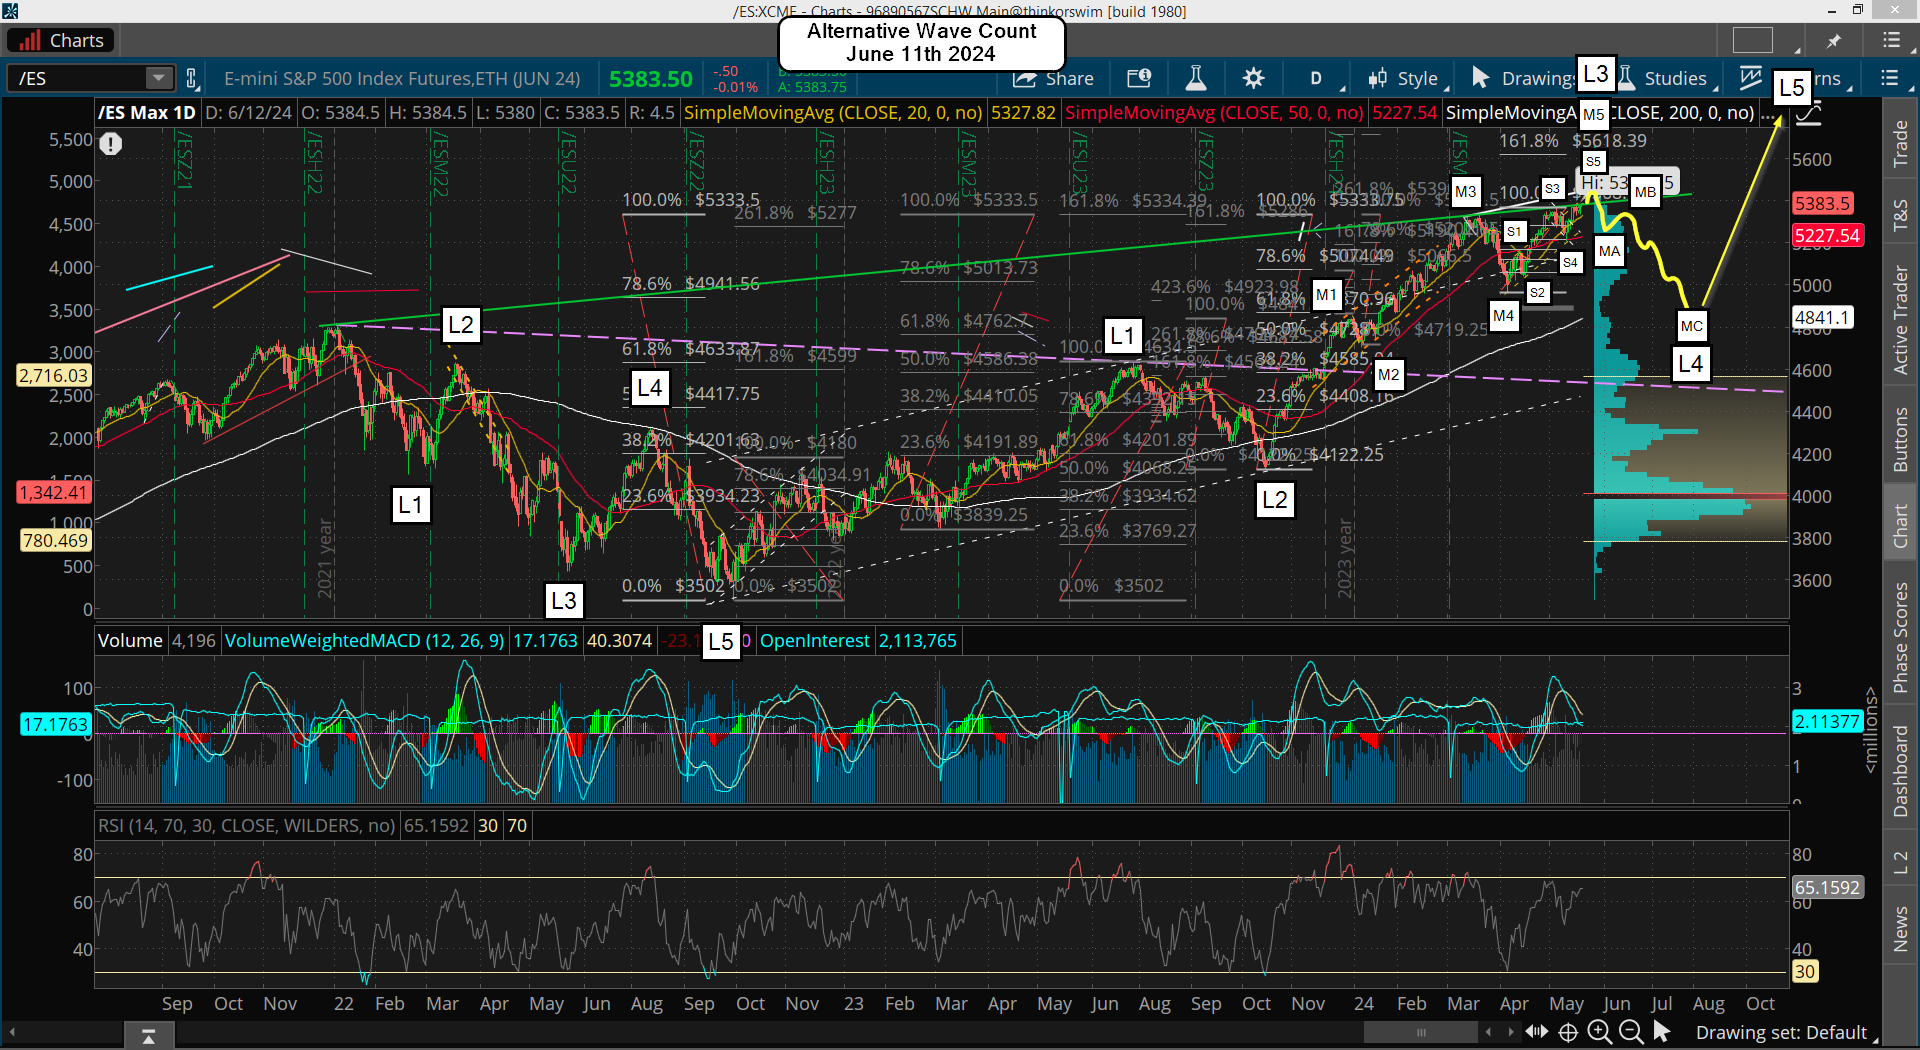
As you can see the pullback would be deeper then the 5/31 low but higher then the 4/19 low. The part I got wrong on it was thinking that S1 would end at the rising green (or white) trendline and start S2 from there. Instead we seem to be headed start up to the FET at 5618.39 first, which should then end S1 and allow S2 to start. It tells me now that the wave count is probably wrong and needs adjusted as S1 seems too long to be right. So on 6/11 I did an alternative wave count, which is below.

On it I still point to the rising green (or white) trendline as the end of the move before the pullback, so that was wrong, but the wave count could still be accurate. If we reach the FET on this rally then we could be completing M5 inside L3, but the 5 waves inside the move would need relabeled as again, S5 seems too long in length compared to S3. Guessing the wave count is really hard and I have to continue to adjust, but the important thing here is that we are very likely going to hit the FET at 5618 this week and from there I expect a pullback into next week, which really the most important thing to get right for trading.

Have a blessed day.
ES Morning Update June 19th 2024

0

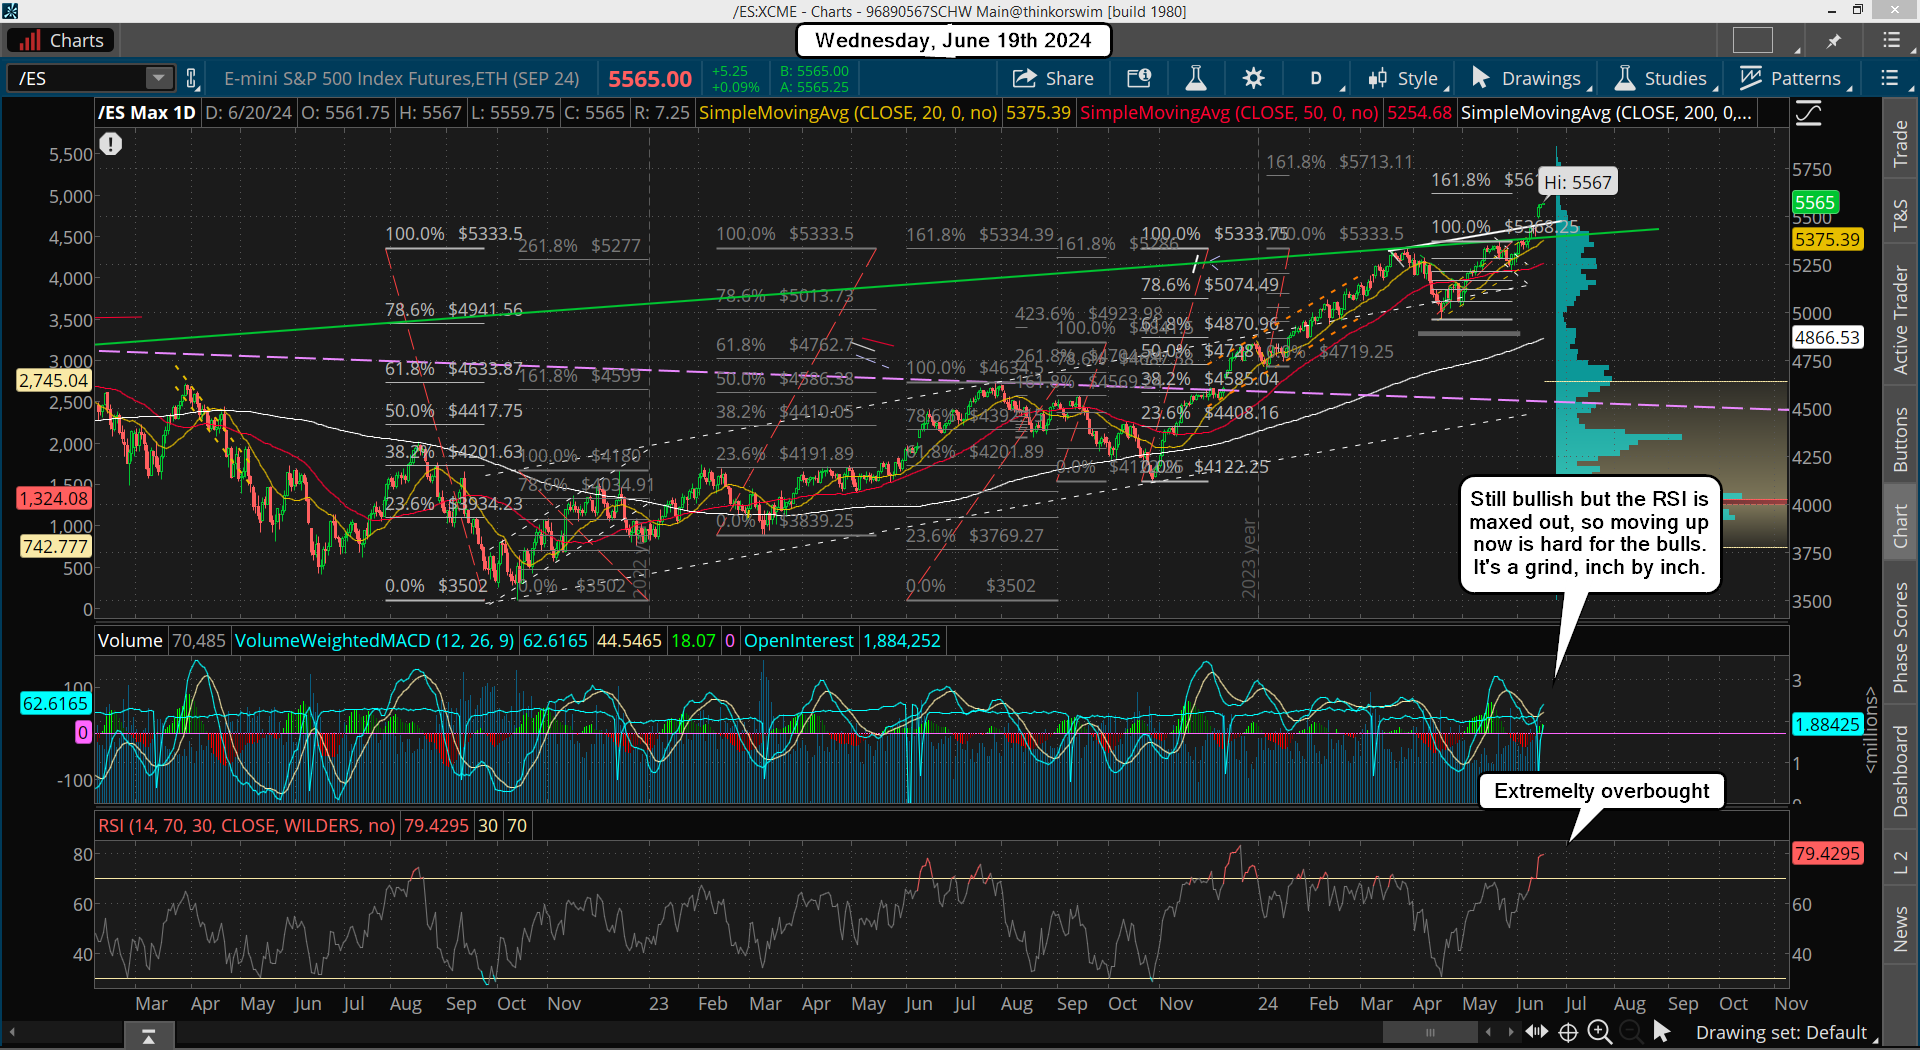
A whole lot of nothing yesterday as market continued to chop and inch higher. This week is OPEX, so it's perfectly normal for this kind of action to happen. We are close now to the FET at 5618, and it could be hit at any time. I don't have anything else to add that hasn't already been said, so I'll end it here.

Have a blessed day.
ES Morning Update June 18th 2024

0

The bulls didn't even pause at all yesterday, but went up steady all day. Not much to do here but watch and wait as my FET's are quite close now and could be hit any day now. We are very overbought on all time frames but again, the market can stay overbought longer then most can stay short.

I don't see any reason to even think about shorting right now as the market looks like it won't stop until it hits the upside FET of 5618.39, which reminds me a lot of the prior FET of 5334.39, and that one was hit on 4/1 with a high of 5333.50... but it got close on 3/22 at 5311.75, and then chopped for a week into the 1st.

Will that repeat again? It's very possible that we put in a top this week below the new FET, and then chop into the end of this month before we run up to 5618 or so on the 28th. That would frustrate a lot of bears and it would suck in a ton of bulls thinking the week plus chop was another bull flag that was going to breakout huge with another 200-300 point squeeze. But if it repeats the prior pattern it will just barely go higher to hit the FET and the rollover to start a real multi-week pullback.

Have a blessed day.
ES Morning Update June 17th 2024

0

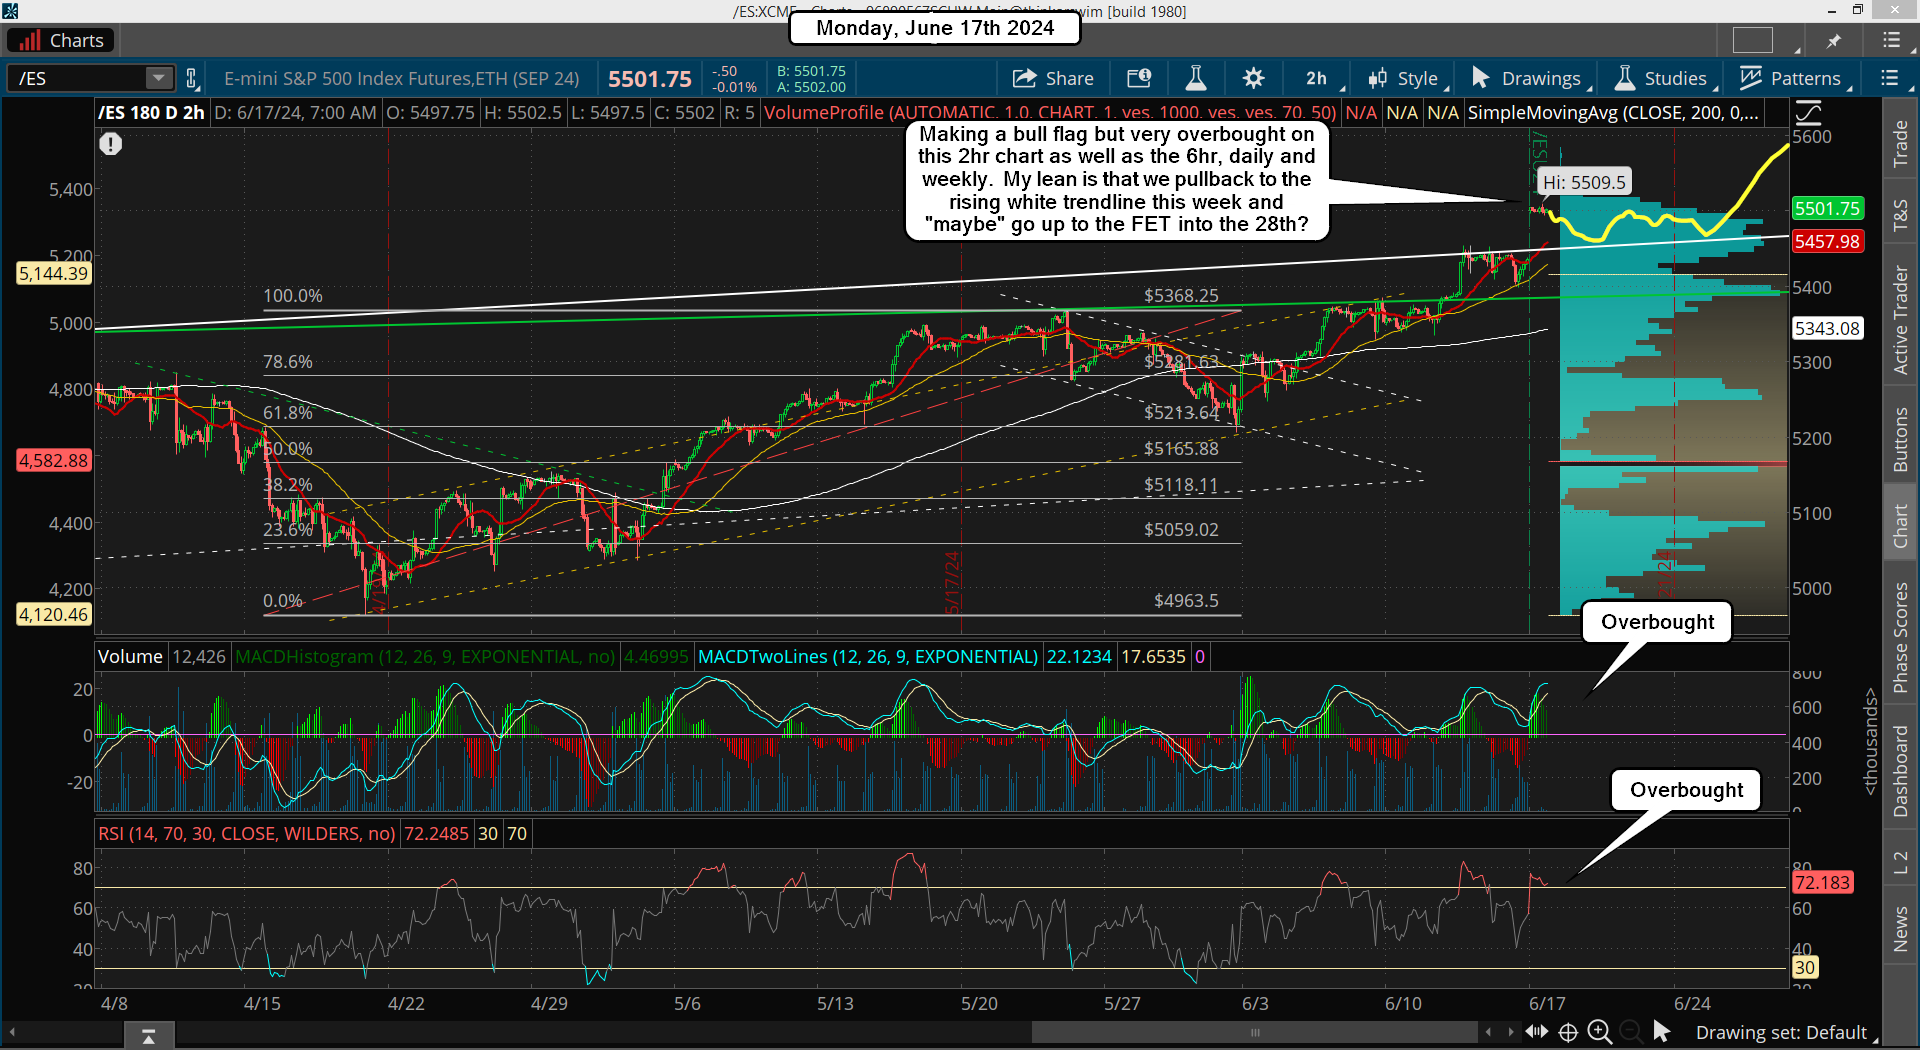
We have the roll from the June contract on the ES to the September now, which added 58 points on it instantly. I forgot about that when I did the wave count last week, so now it's busted as we are going higher and it's looking like the FET of 5618.39 could be hit before we get a serious move down.

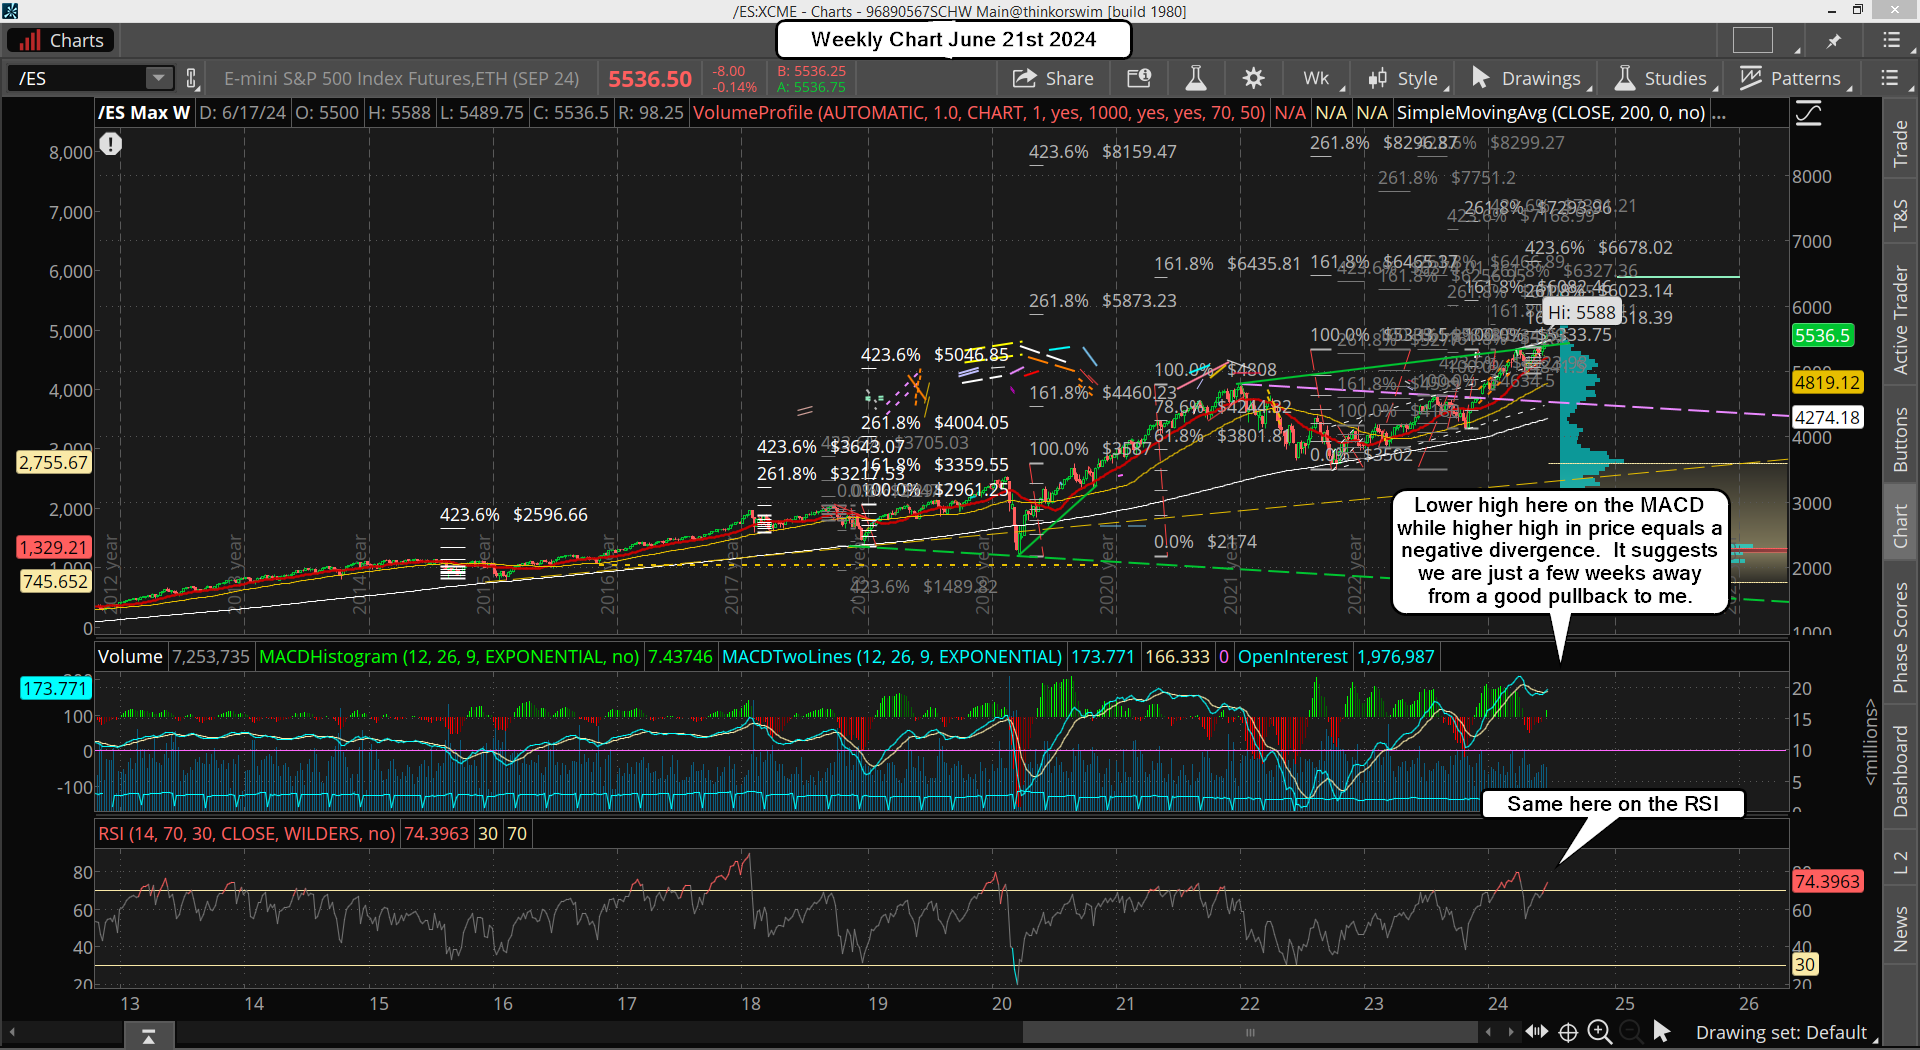
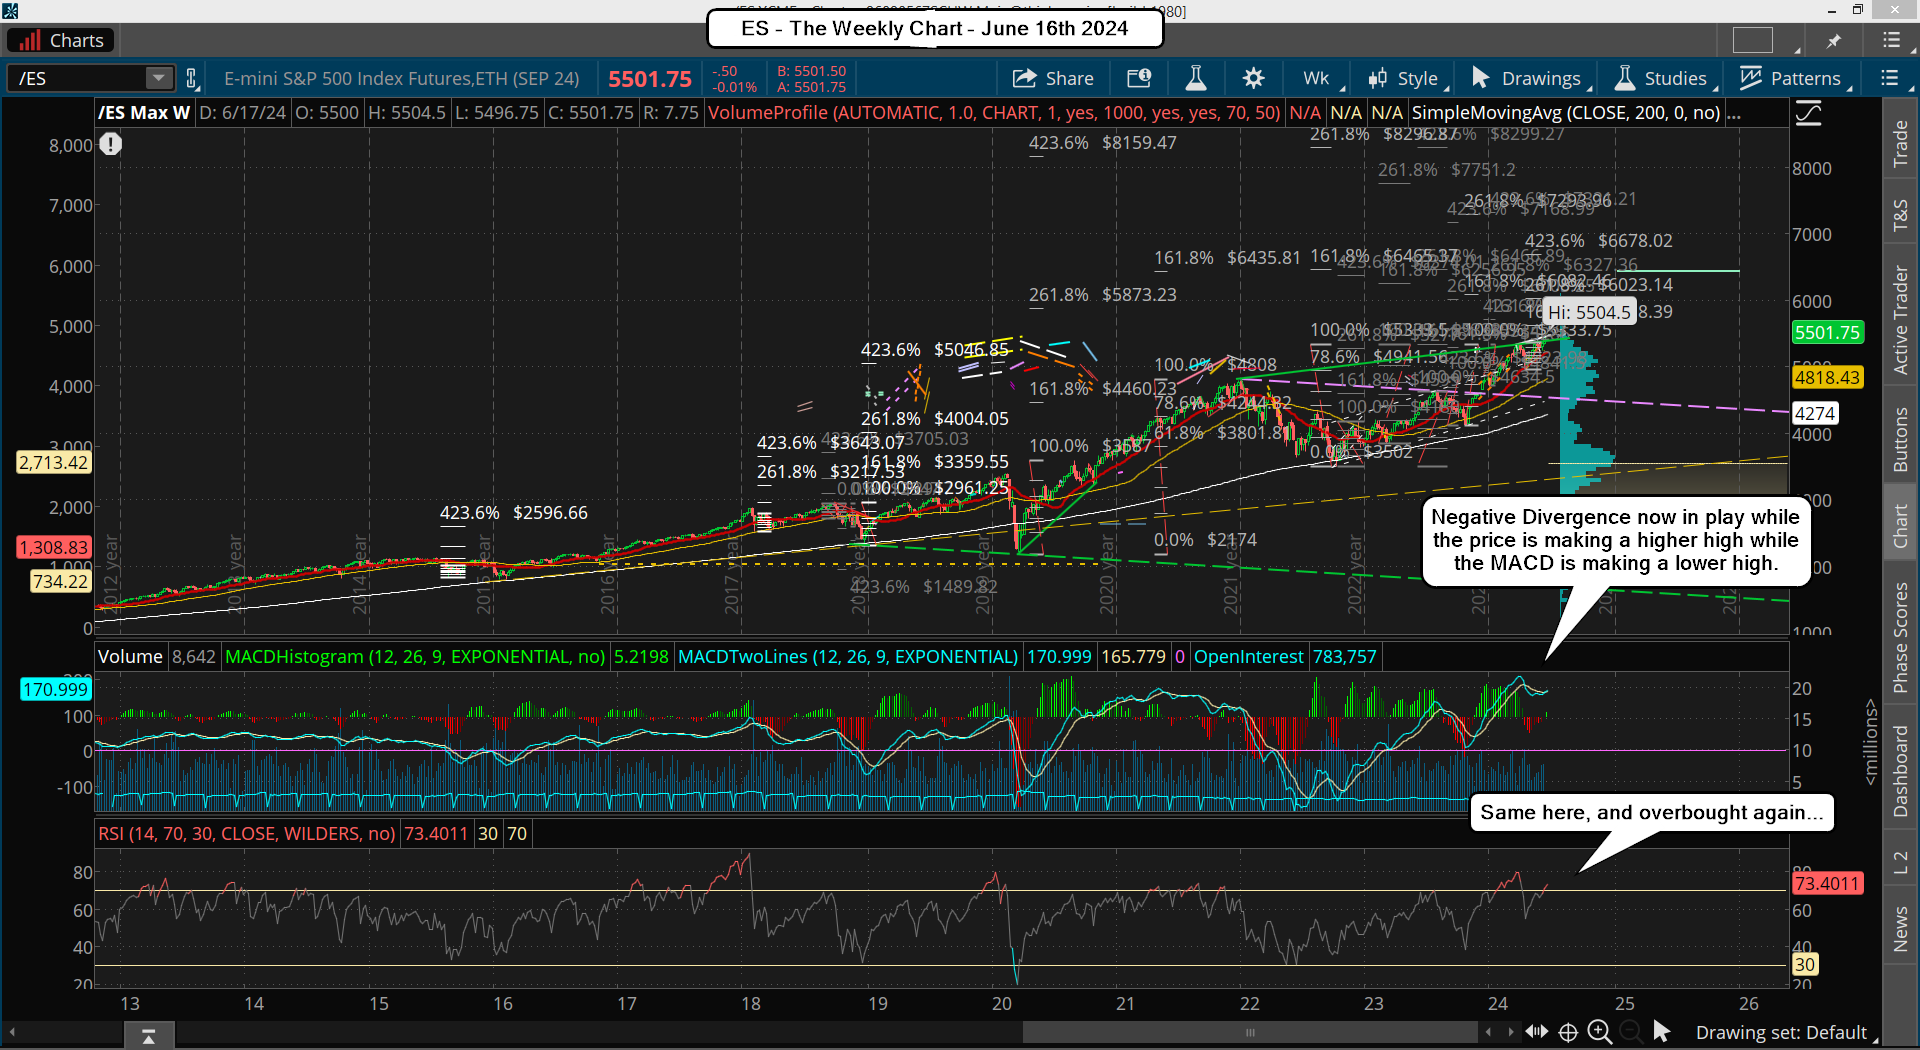
The rising white trendline held for awhile but this contract roll caused a gap over it, so now it will be support. Of course we are overbought now on all charts pretty much, which is from the weekly to the daily and the 6hr chart. Here's the weekly...

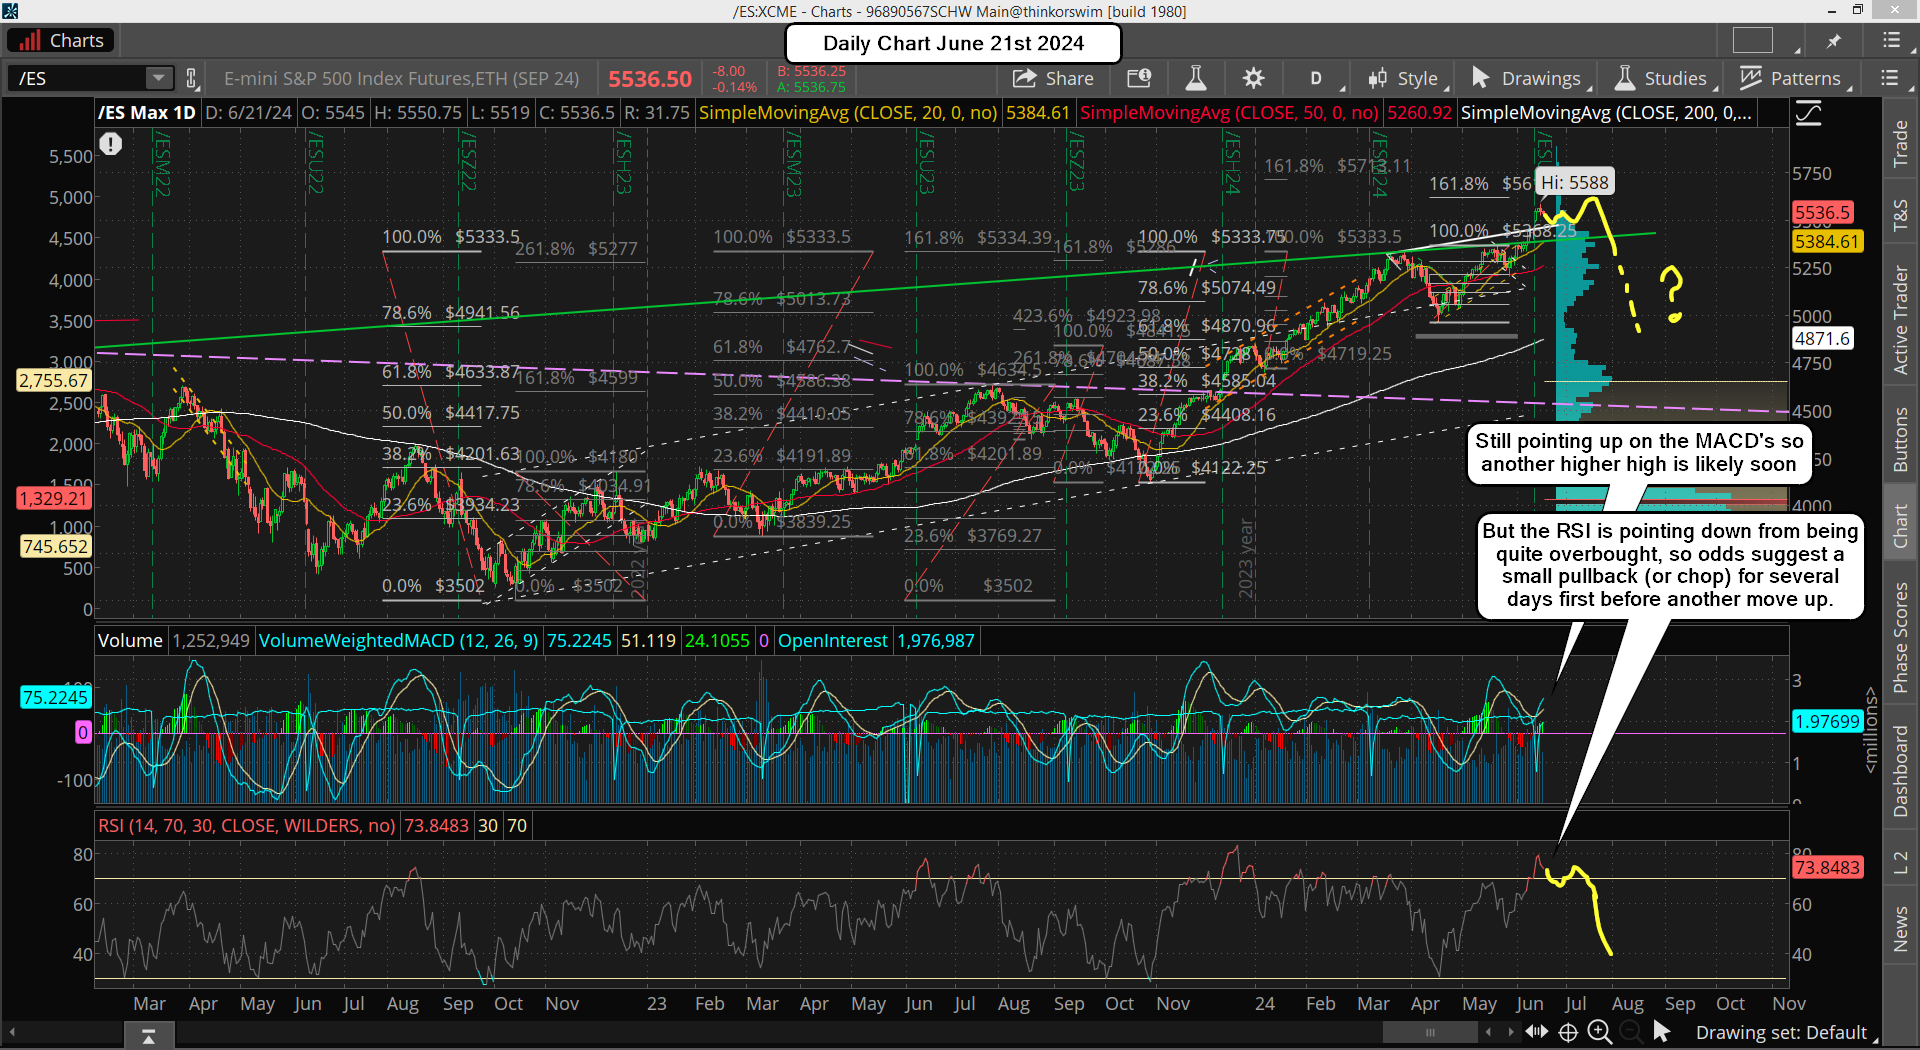
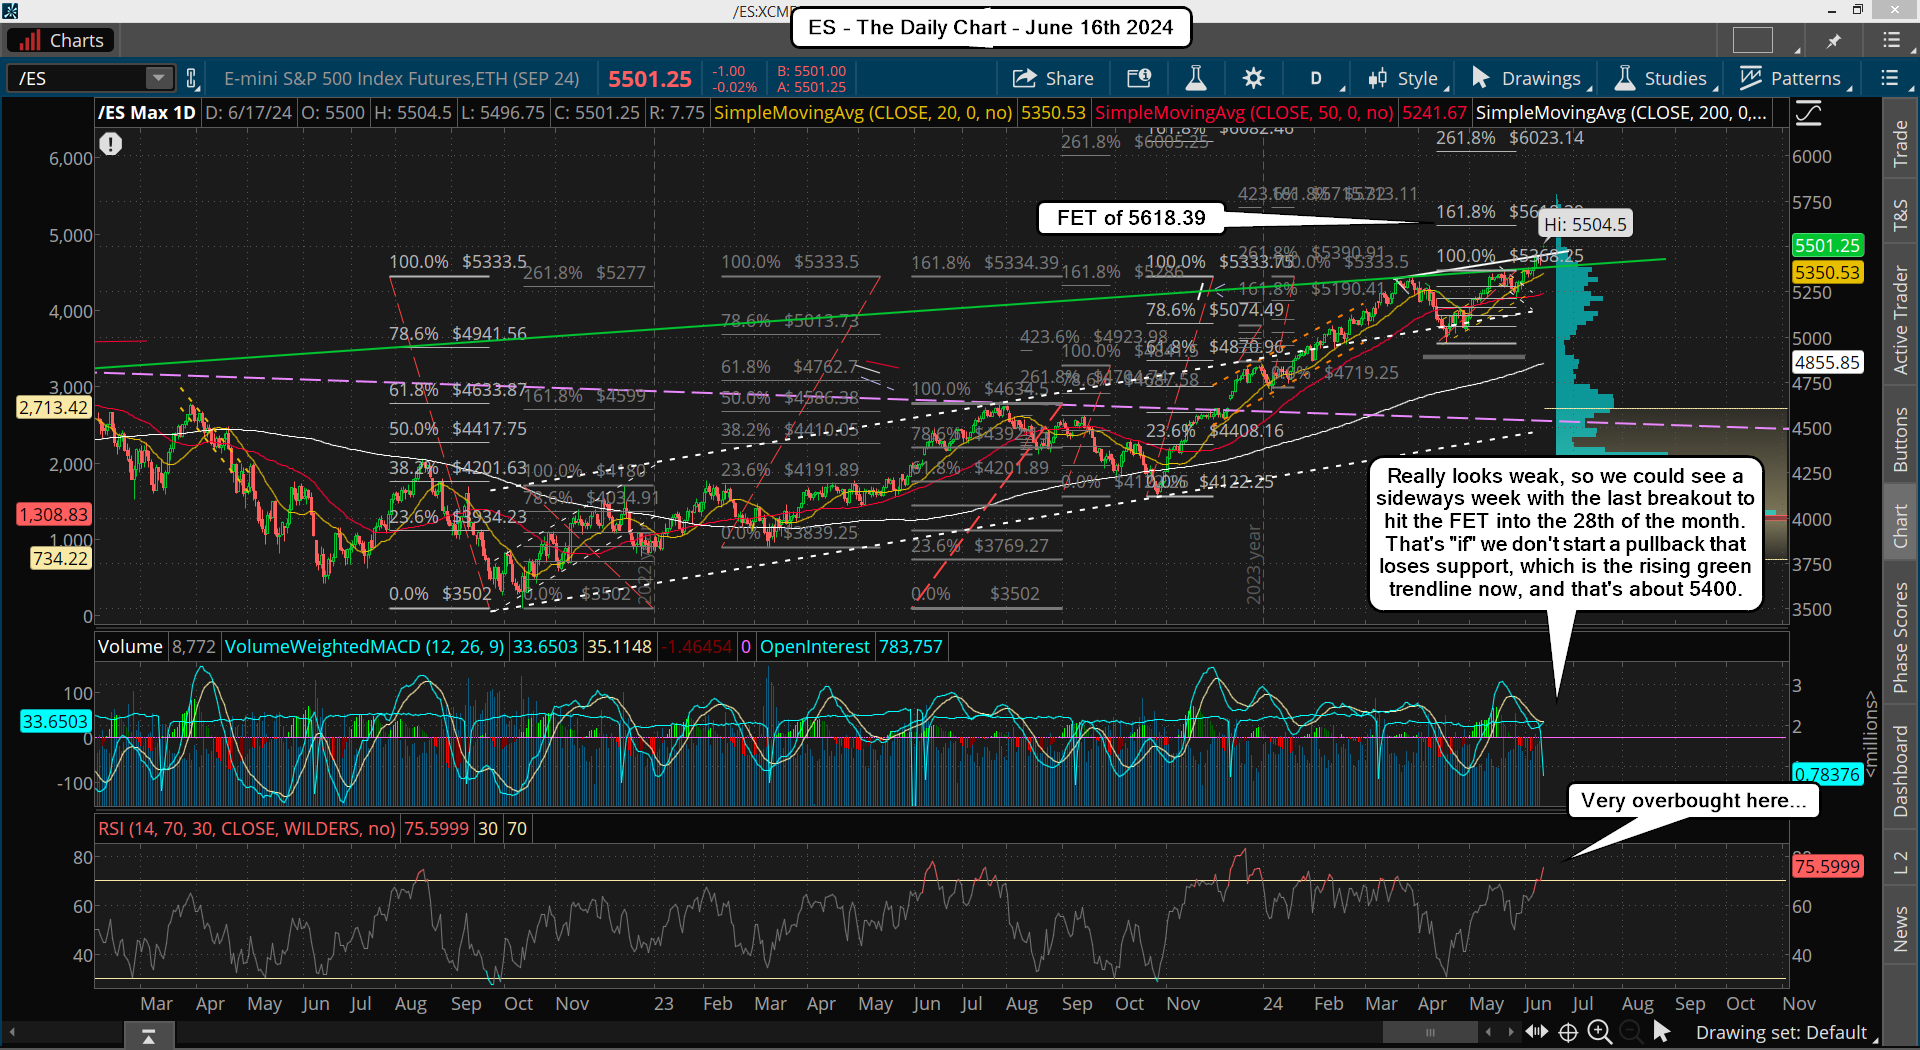
So if, that's a BIG "if", we do rally up to the FET this week the market will be super overbought then and I could see nasty fast drop happen afterwards. I mean we could see something like the drop that happened after the January 2018 top, which was super fast. The charts will be that overbought if we rally up to 5618.39, which is crazy to think it could do it but we all know that overbought charts can get more and more overbought. Below is the daily chart...

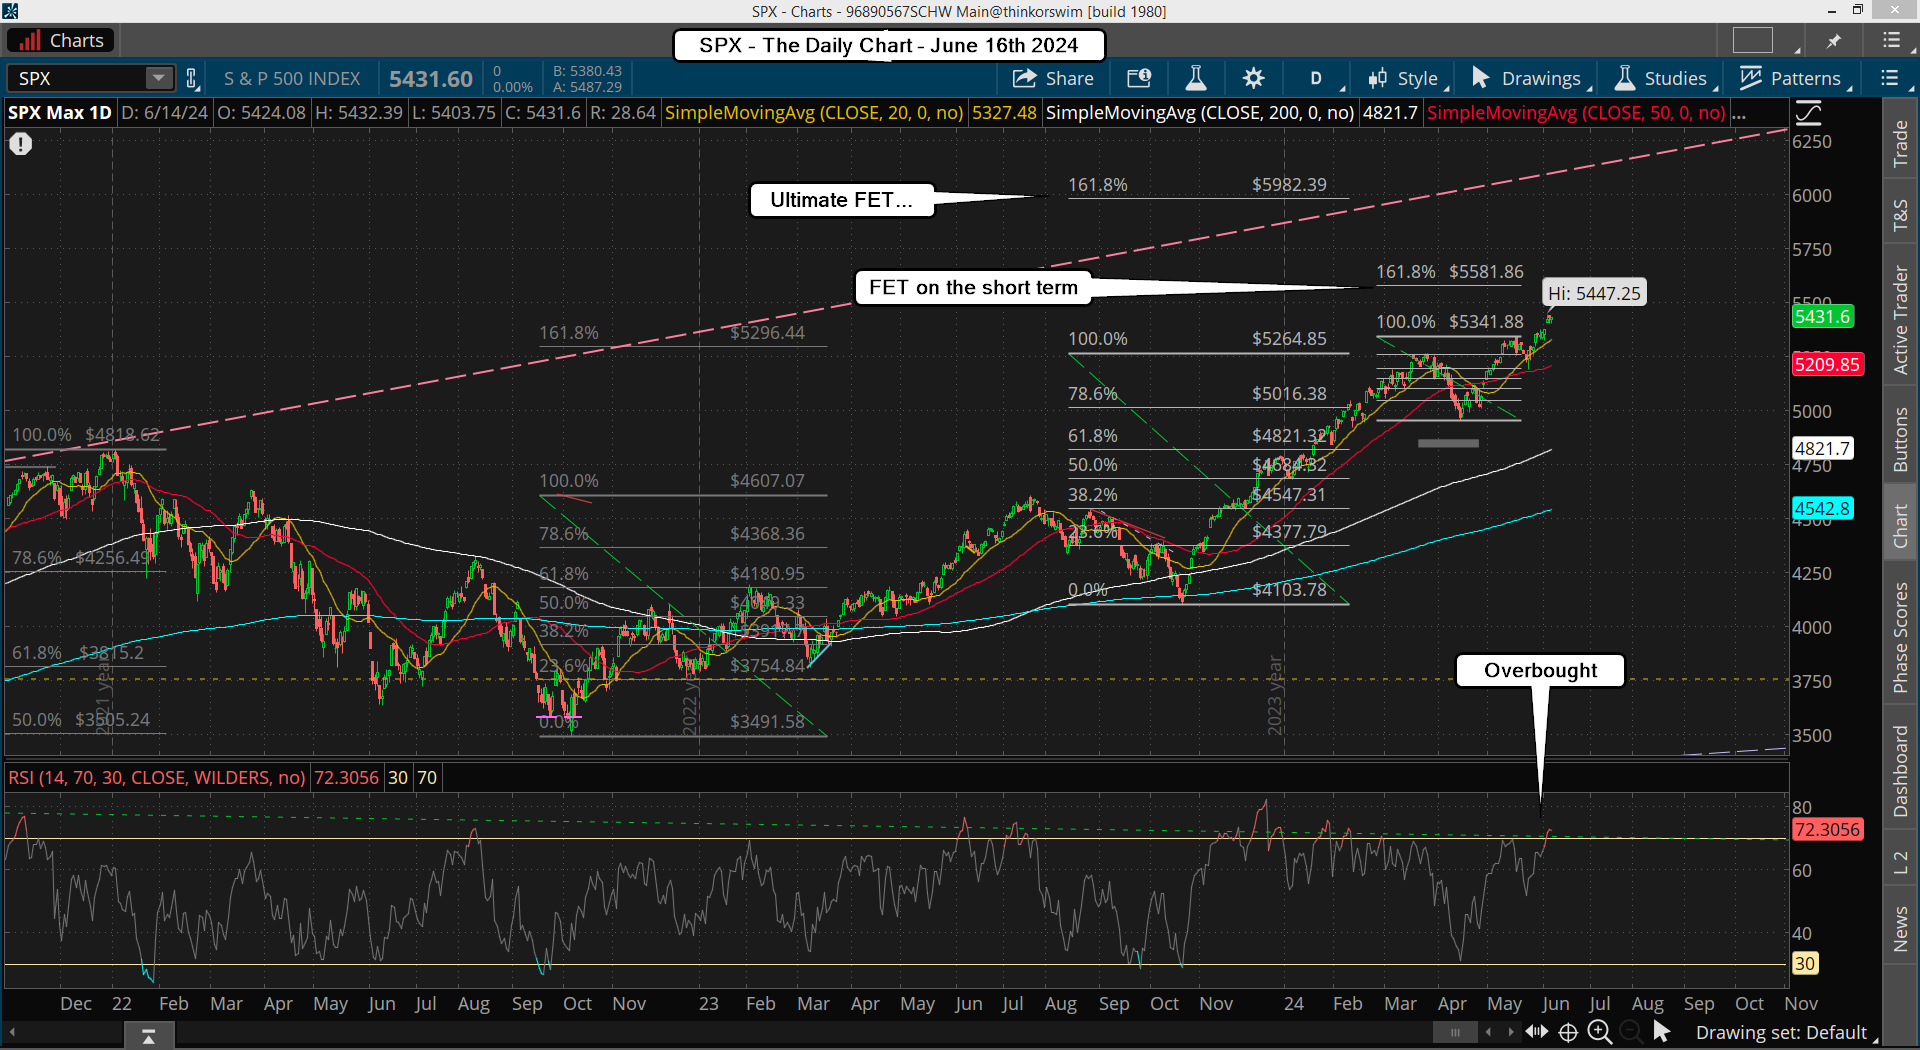
The FET on the SPX is only 5581.86, so we could see this happen for sure as it's not too much high on either the cash or futures.  As far as turn dates, if we are going to rally up first, the 28th of this month will be the next important one.  So if we go no where this week but instead we just build another bull flag then I'd think we'll hit the FET on the 28th to finally top this market out.

I thought that we'd actually go down into the 28th, which is still possible, but we'd have to top today I think.  If that happens then we can drop into the 28th to put in a low before another strong move up happens.  Now if this happens I don't think it will be that deep, basically just a higher low.

However, if instead we rally up to the FET into the 28th then we could have a very serious drop follow, and possibly then that FP on the SPY is hit... who knows for sure?  All I can say is that the FET is a magnet and could be hit before any real move down happens.

Have a blessed day.
ES Morning Update June 14th 2024

0

As expected we had a wave 1 down and 2 up yesterday, of some degree, which isn't important to know right now. There could be many 1's and 2's over the next few days before we get a good move down. As for today I don't see a lot happening as it's a Friday as we all know that it's common for the week of the FOMC to NOT have a large drop happen.

Next week is OPEX, so if my thoughts are correct we'll get an early pullback Monday through Wednesday and then a rally back up int Friday. The week after is when we should see the bigger wave down, which should be a C wave, and I think we'll bottom around the end of this month, which is Friday the 28th. Whether or not we make a higher low then the 4963 low or a lower low I just don't know.

Have great weekend.

ES Morning Update June 13th 2024

0

We got the short squeeze I was looking for, and we hit the rising white trendline spot on (pierced a little). Everything looks good to me for the top being in for this multi-week rally. I currently don't see anything big on the downside yet as we should still do a series of wave 1's down and 2's up... meaning the pullbacks should be bought during the first week as bulls buy the dips.

This is typical in the early stages after a top happens. Now while odds are good that we will have a pullback I still don't know how much? I did another chart with shallow pullback, which is below.

Now this would change the wave count of course, and it's certainly something I'll be open to happening. My focus will be to just watch the technicals closely and let them give me clues on how low we go and how long this last. But until we get started I can't predict any downside target. Let's just let the market tell us.

Have a blessed day.
ES Morning Update June 12th 2024

0

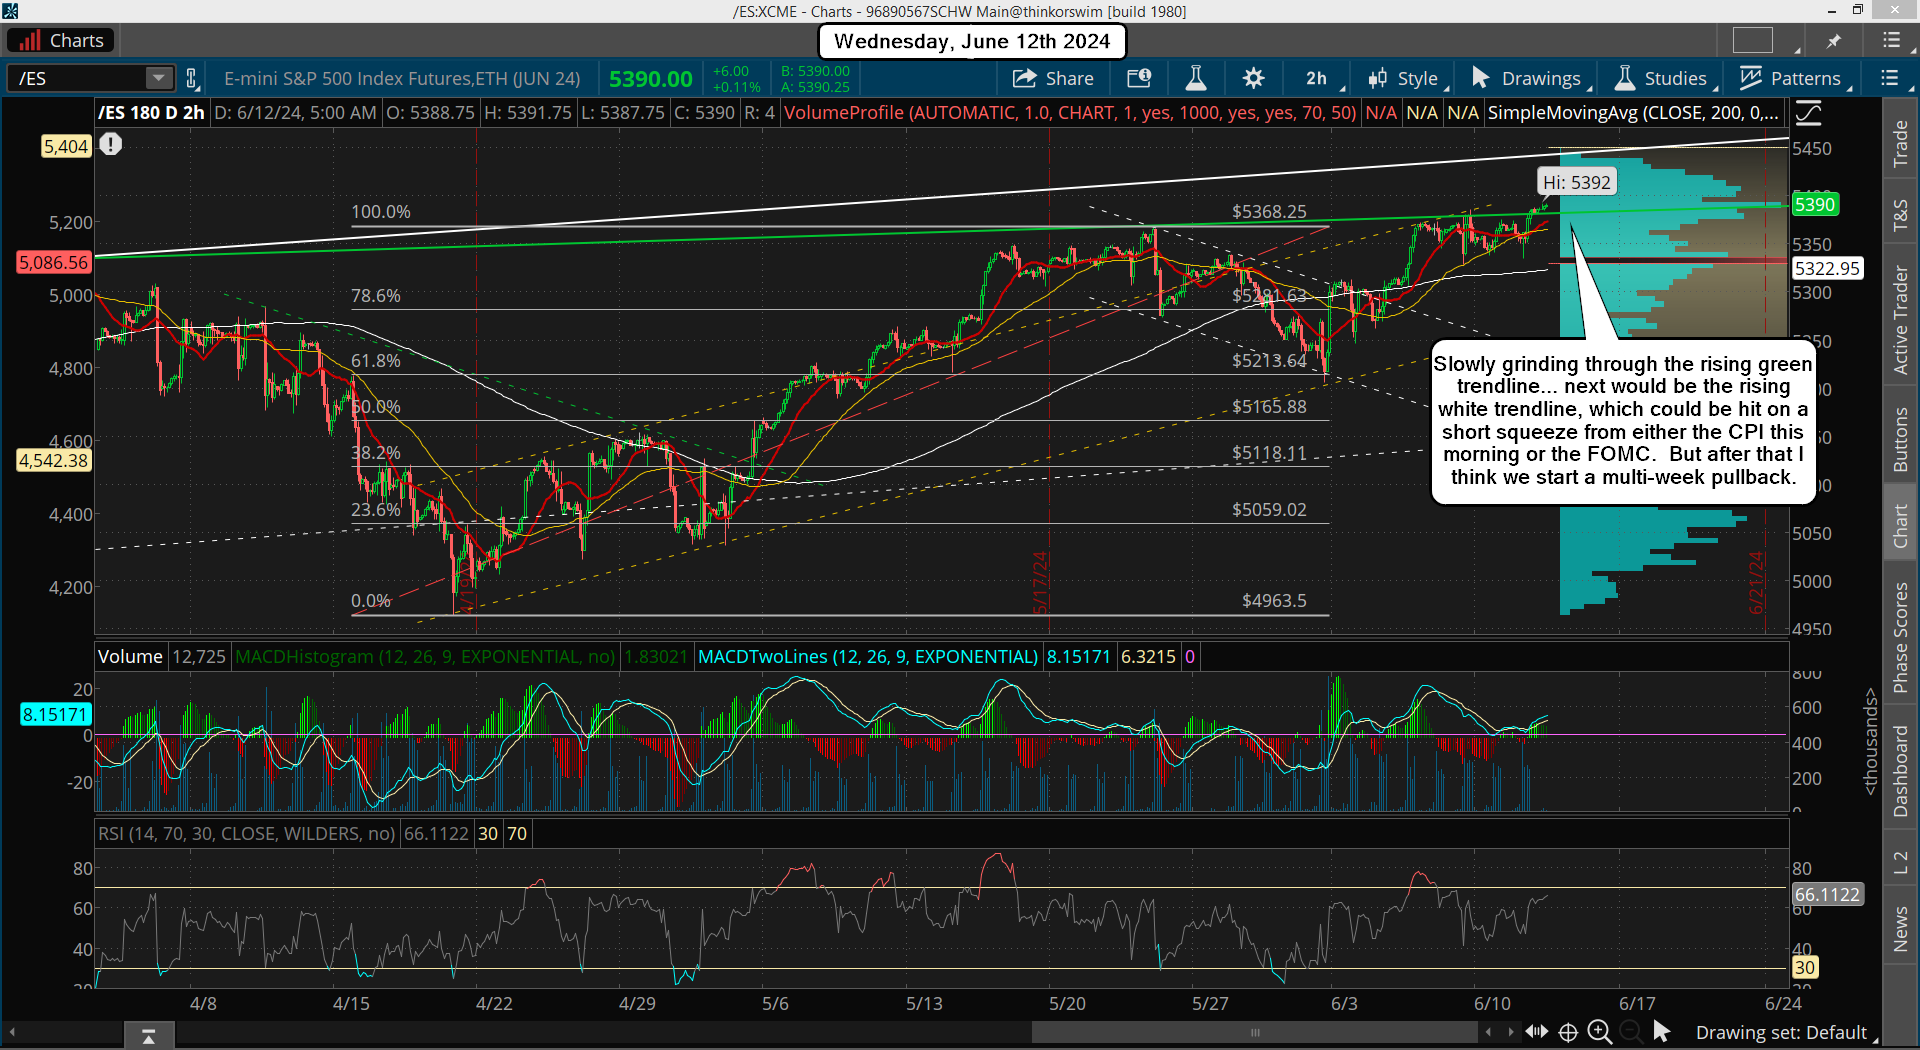
Big day today the CPI and the FOMC will certainly cause some big moves in the market one way or the other. My lean is still that we have a squeeze higher first before we start a multi-week pullback, but I could be wrong of course.

We might see a drop after the CPI and then it get completely erased back up after the FOMC? Or we rally on the CPI and drop after the FOMC... really hard to know for sure. It's just a guessing game here and the only thing to do really is just to let it play out in one direction or the other and look to take a position short (or long) based on where it goes after each event.

To me, I can't take any longs here as upside looks limited to me... maybe a 100 points of risk there, but the downside has risk of 400+ points in my opinion. The pullback should take out the 5205 low and make a move toward the 4963 low in the coming weeks, and if my wave count is right it will stop somewhere in the middle of that zone and end Small Wave 2 down. Here's that wave count again from 6/6 ...

If I'm wrong on my wave count, meaning we take out the 4963 low (and likely go to the FP on the SPY), then I'd then think that whatever high we get this week ends Medium Wave 5 and that the pullback will then be Large Wave 4 down. It could reach the FP on the SPY for sure, which would be around 4850 or so. Then Medium Wave 5 up will take us into an August or September high of 6000+ to hit my FET hopefully. Here's that chart below...

Have a blessed day.
ES Morning Update June 11th 2024

3

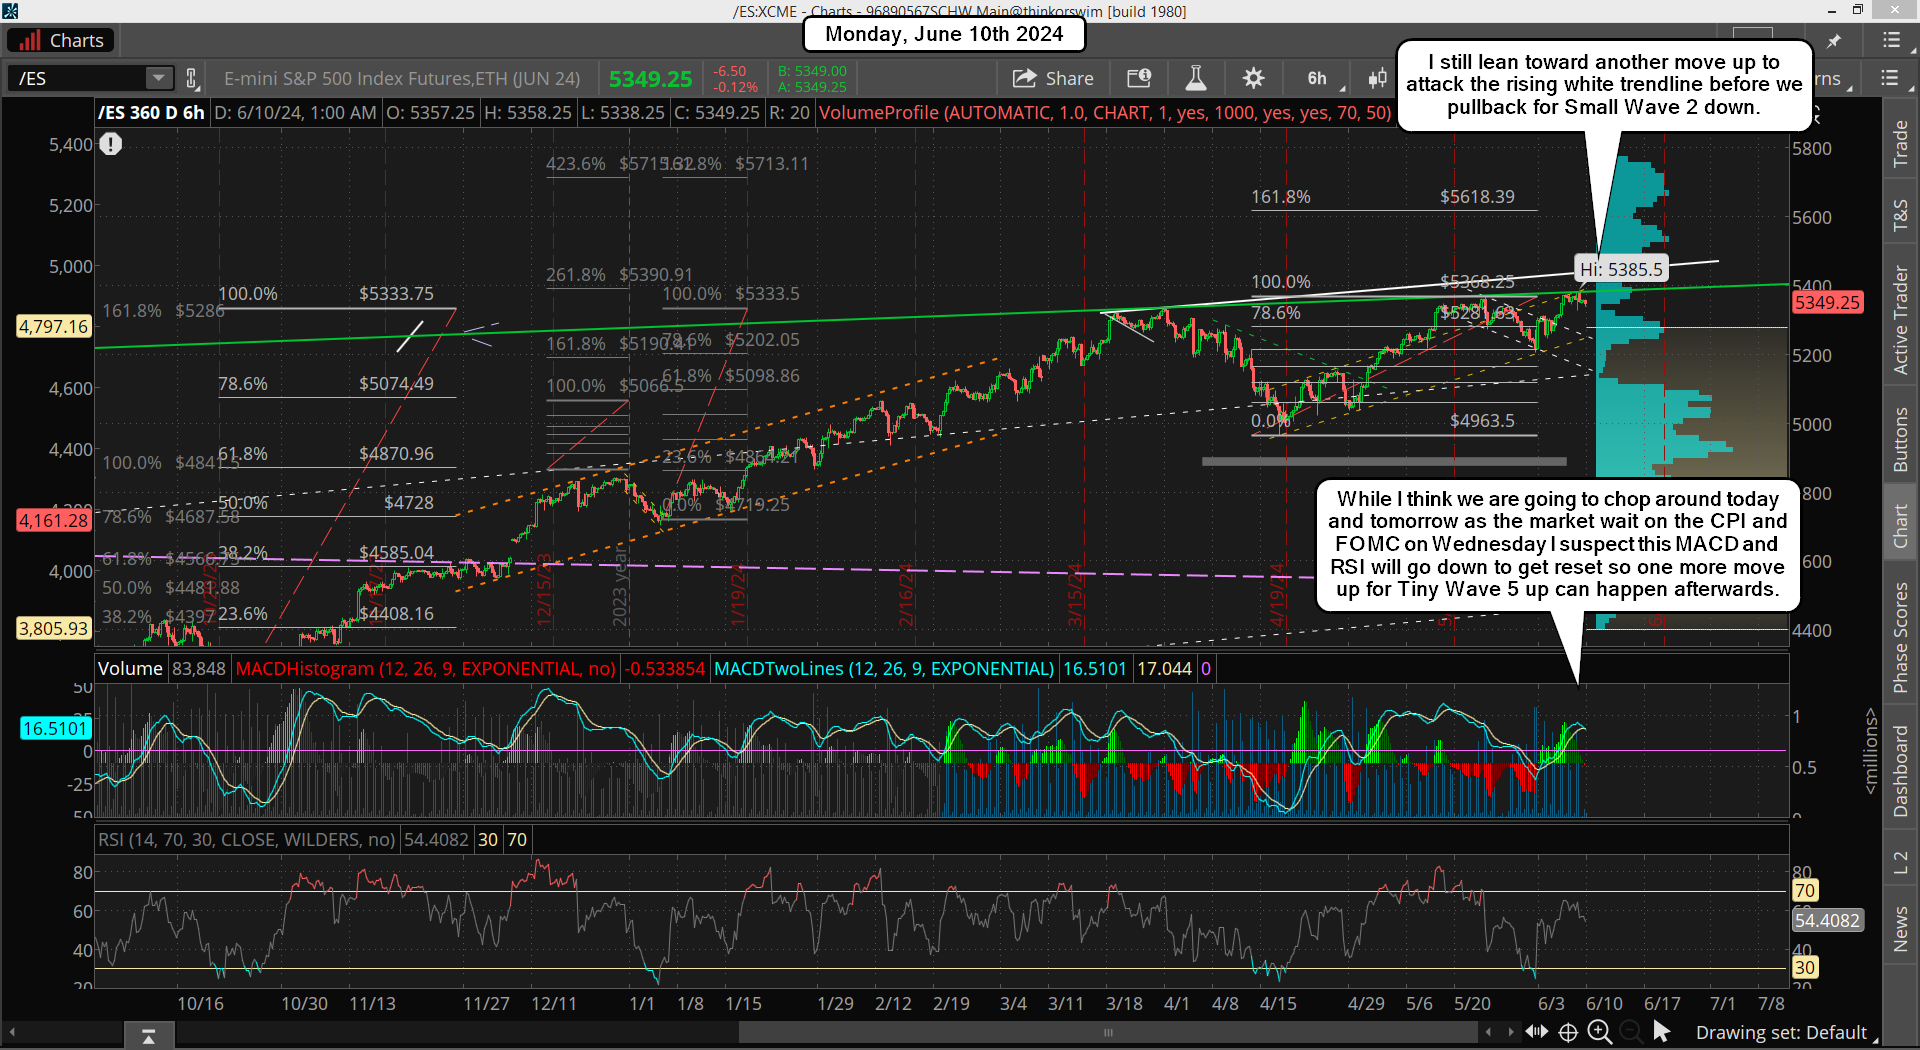
A whole lot of nothing yesterday as we drifted lower in the first half of the day and floated back up the second half. Still no clear direction but a move is coming tomorrow after the CPi and/or the FOMC. The market has been in a tight range the last several days and forming a bull flag, as well as a "cup and handle pattern", which both are bulls of course.

The typical trick is to rally higher first in a short squeeze to kill the bears and trap the bulls before a drop. Technicals are still short term bullish but medium term they are overbought so a pullback should still happen before this month ends, and usually in the second half of the month. But that pullback could start from a higher level, like the hitting of the rising white trendline up around 5450 on Wednesday.

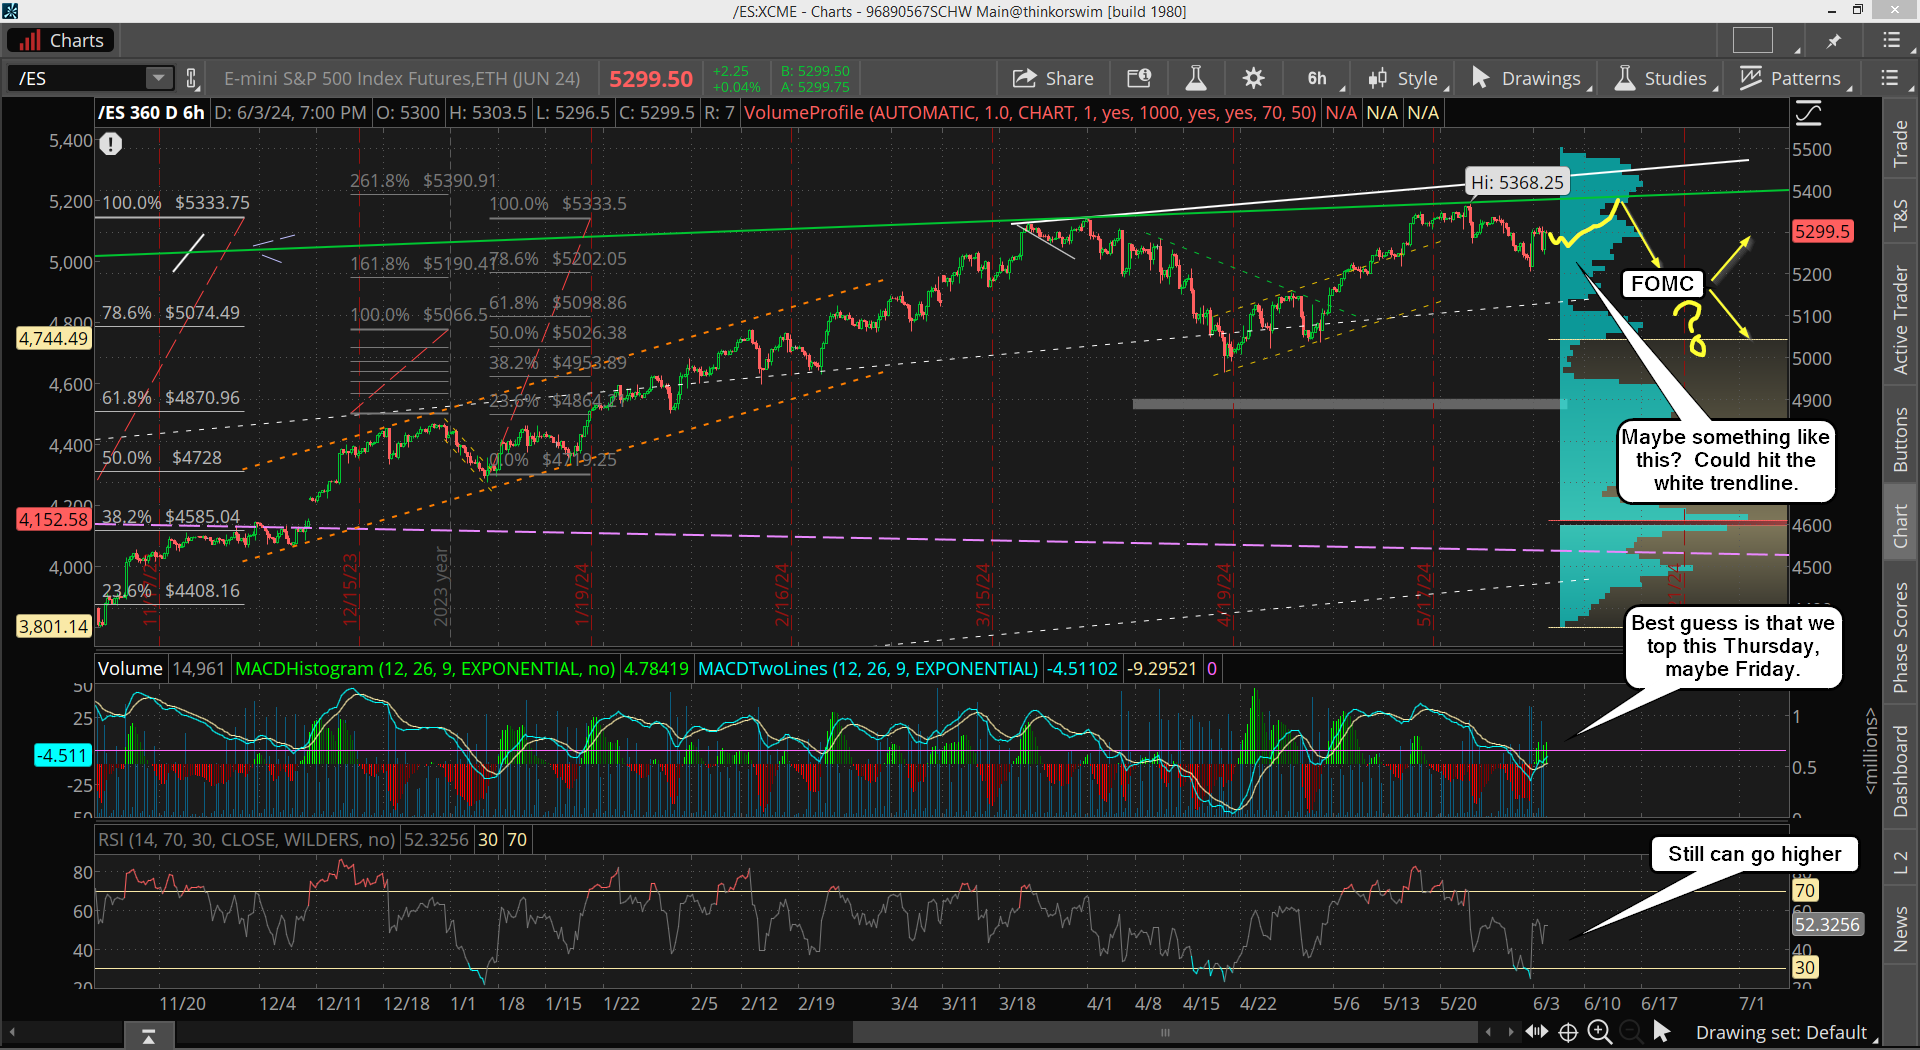
As for today we'll probably chop around some more as everyone is waiting on the CPI and the FOMC. My lean is still that we'll hit the rising white trendline, but that doesn't mean we don't have a shakeout drop first, like after the CPI maybe? Then back up after the FOMC would be my best guess on how it plays out. Nothing but a waiting game now.

Have a blessed day.
ES Morning Update June 10th 2024

0

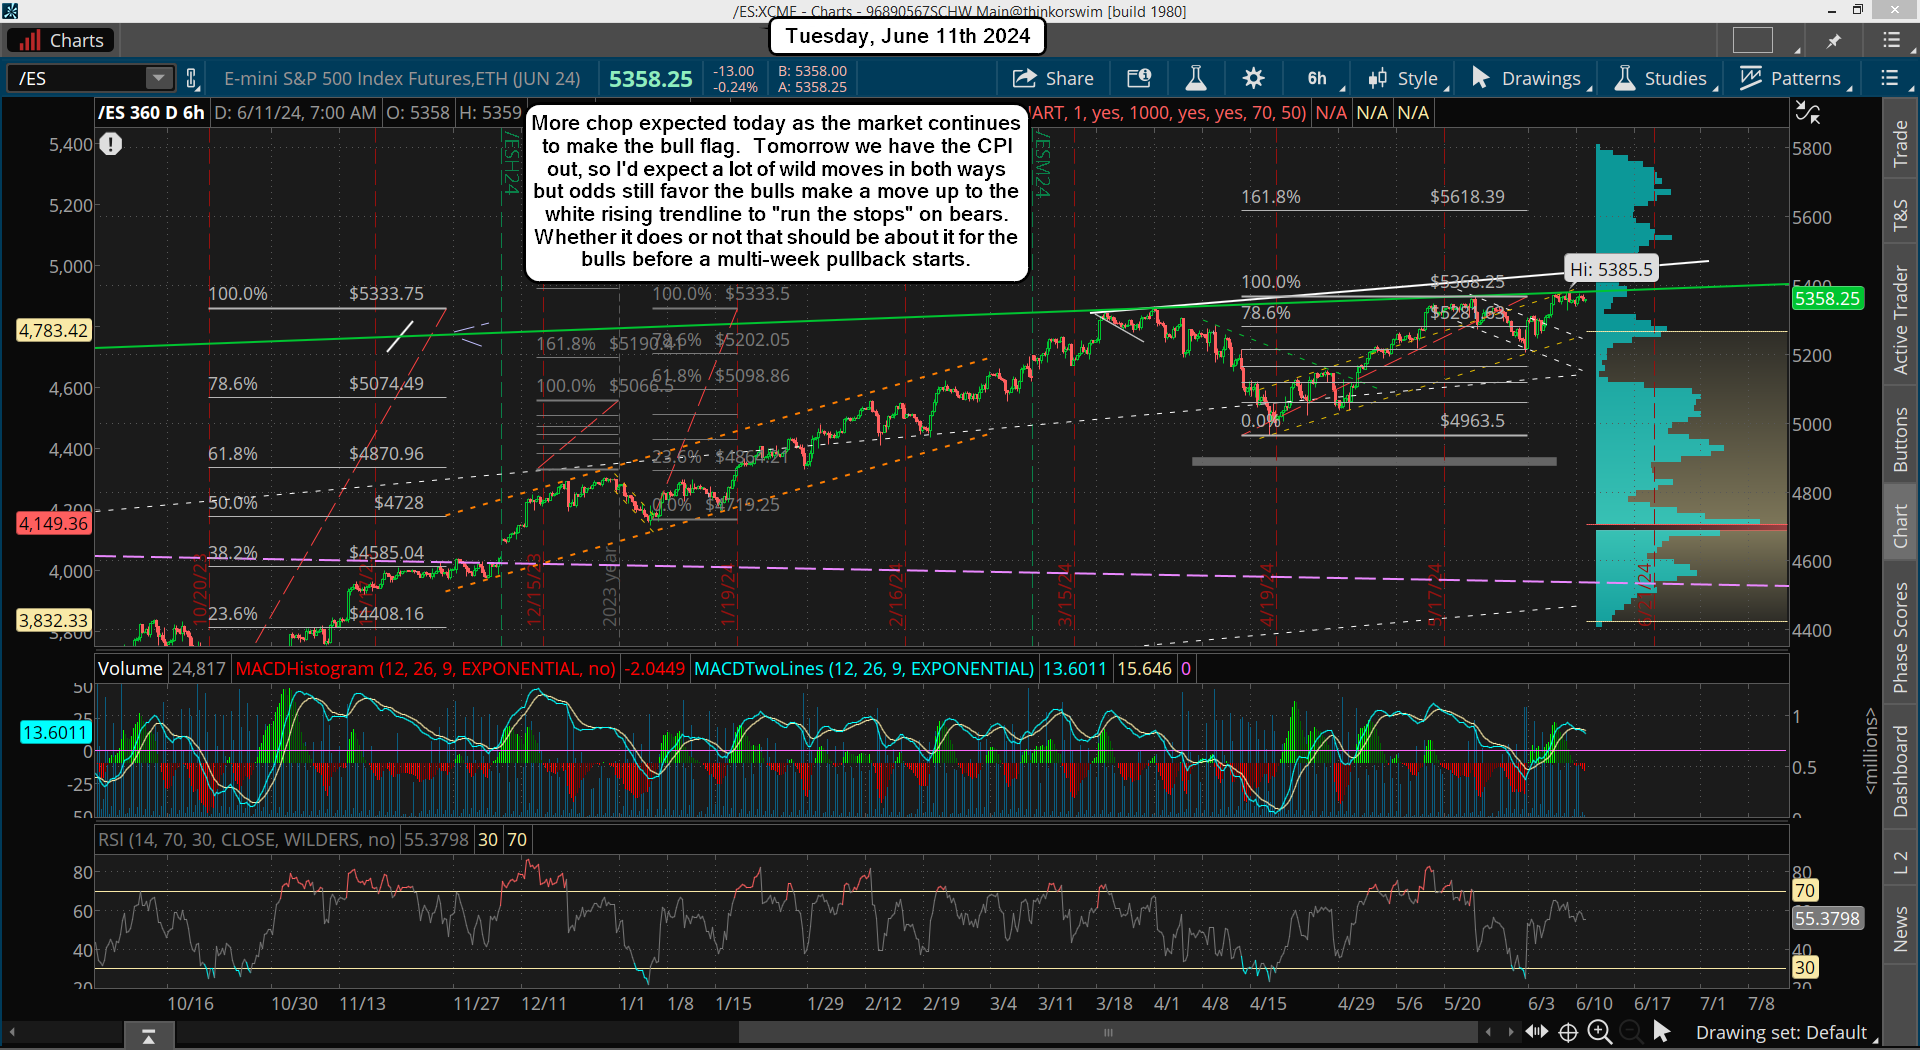
Still missing one last wave up I think, which I thought we would see on Friday but it never happened... or did it? That new all time high midday could have been all there is for that final Tiny Wave 5 up to complete Small Wave 1 up. I have been thinking that last move up would hit the rising white trendline, but maybe it won't?

I'm still open to it hitting, which might hit on Wednesday after the CPI before the open, or after the FOMC at 2pm, but either way we are close to ending Small Wave 1 up and starting Small Wave 2 down.

I assume that it will unfold in an ABC pattern and could last until the end of the month, or sooner. I will add that many wave 2's retrace 61.8% to 78.6%, whereas wave 4's are usually 23.6% to 38.2%, so this pullback could be deeper then most expect, but I don't see it taking out the 4963.50 low where Small Wave 1 up starter. That's too far in advance to predict so let's get to the short term, which I think today and tomorrow we don't see much of nothing until Wednesday.

Then I'll just have to look at the charts on the short term to see if the RSI and MACD's get oversold or overbought into Wednesday as if they are oversold then odds will favor one more move up to "possibly" the rising white trendline for Tiny Wave 5, but if they are overbought then odds will favor the high being "in" for Tiny Wave 5 prior to the CPI and FOMC, so a move down should follow. That's what I see for this week.

Have a blessed day.

ES Morning Update June 7th 2024

1

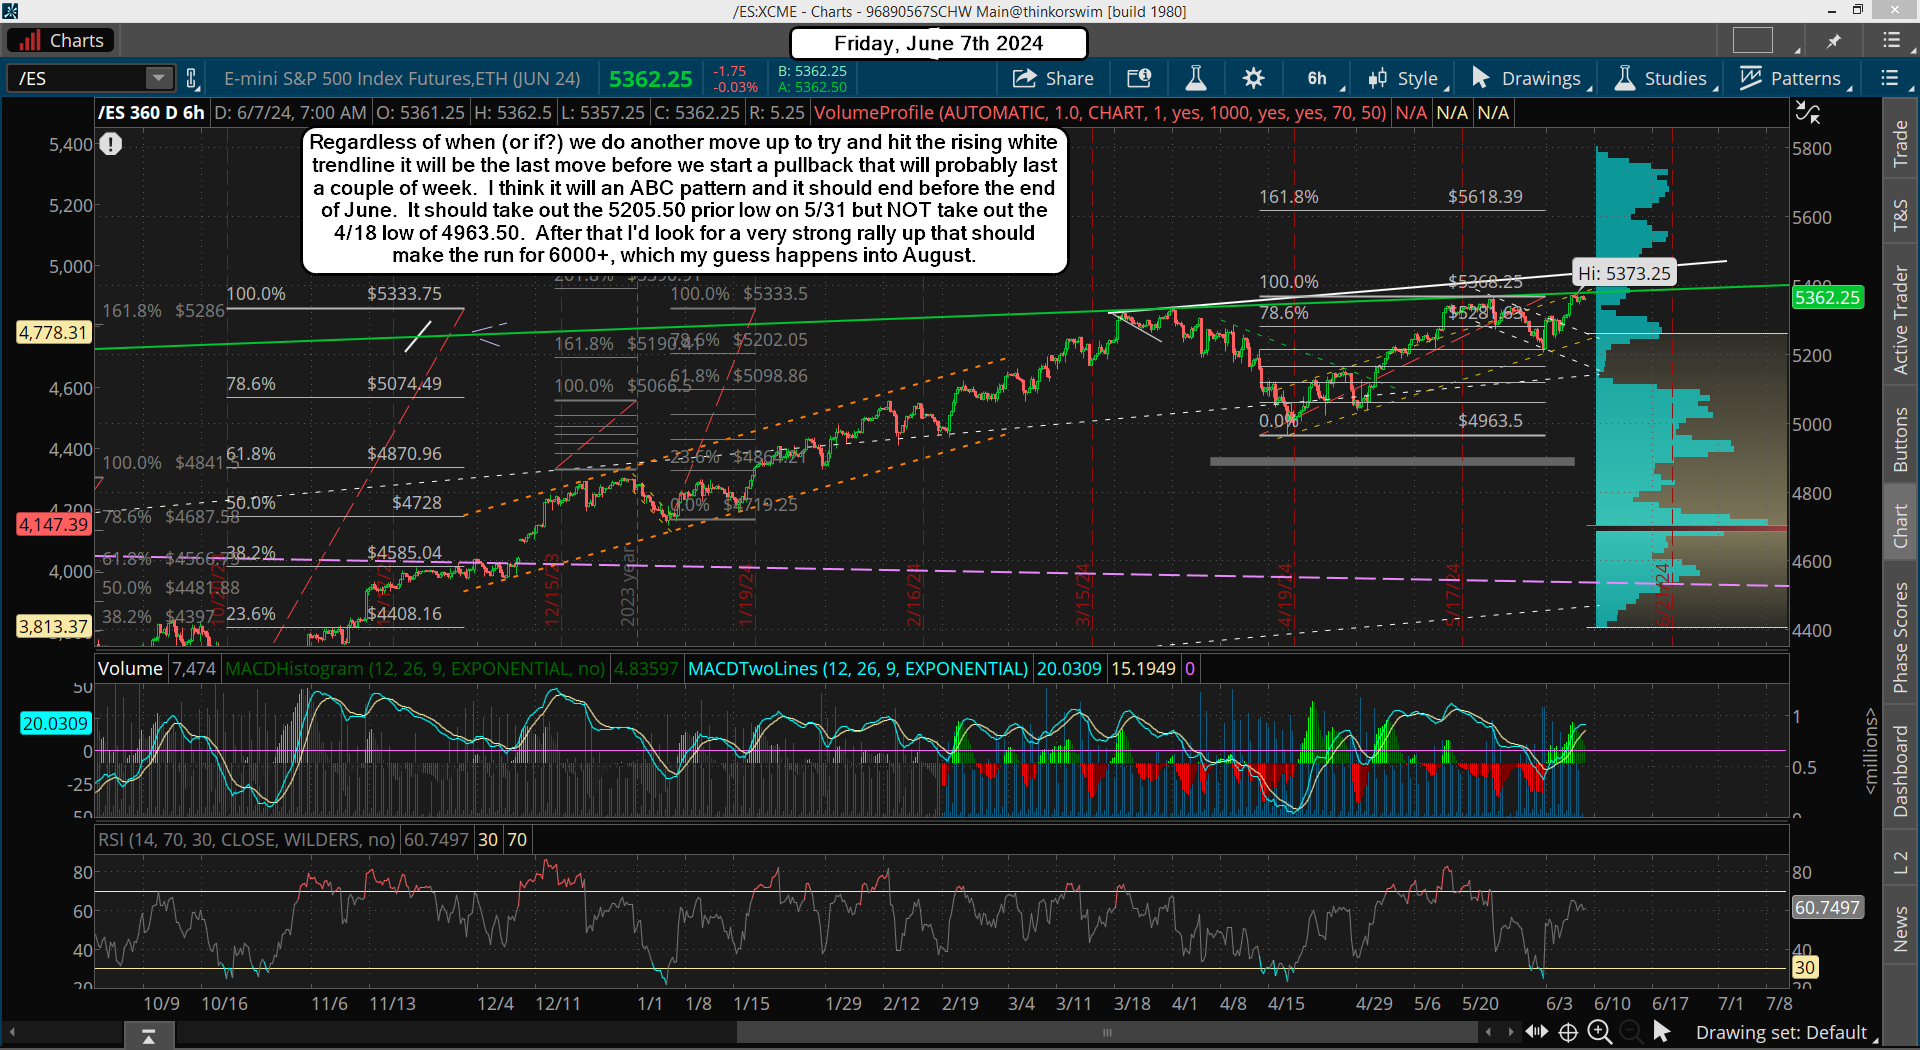
Not much to say today as yesterday did exactly what I thought... went sideways. It's forming a bull flag to breakout again and to run up to the white trendline of resistance. Fridays have been notorious for doing late day squeezes, so I wouldn't be shocked one bit if it happens again today. Whether it does it today or waits until Monday isn't really important as odds favor one more move up before we get a pullback. I covered pretty much everything yesterday so I'll just keep this post short and end it here.

Have a great weekend.

ES Morning Update June 6th 2024

0

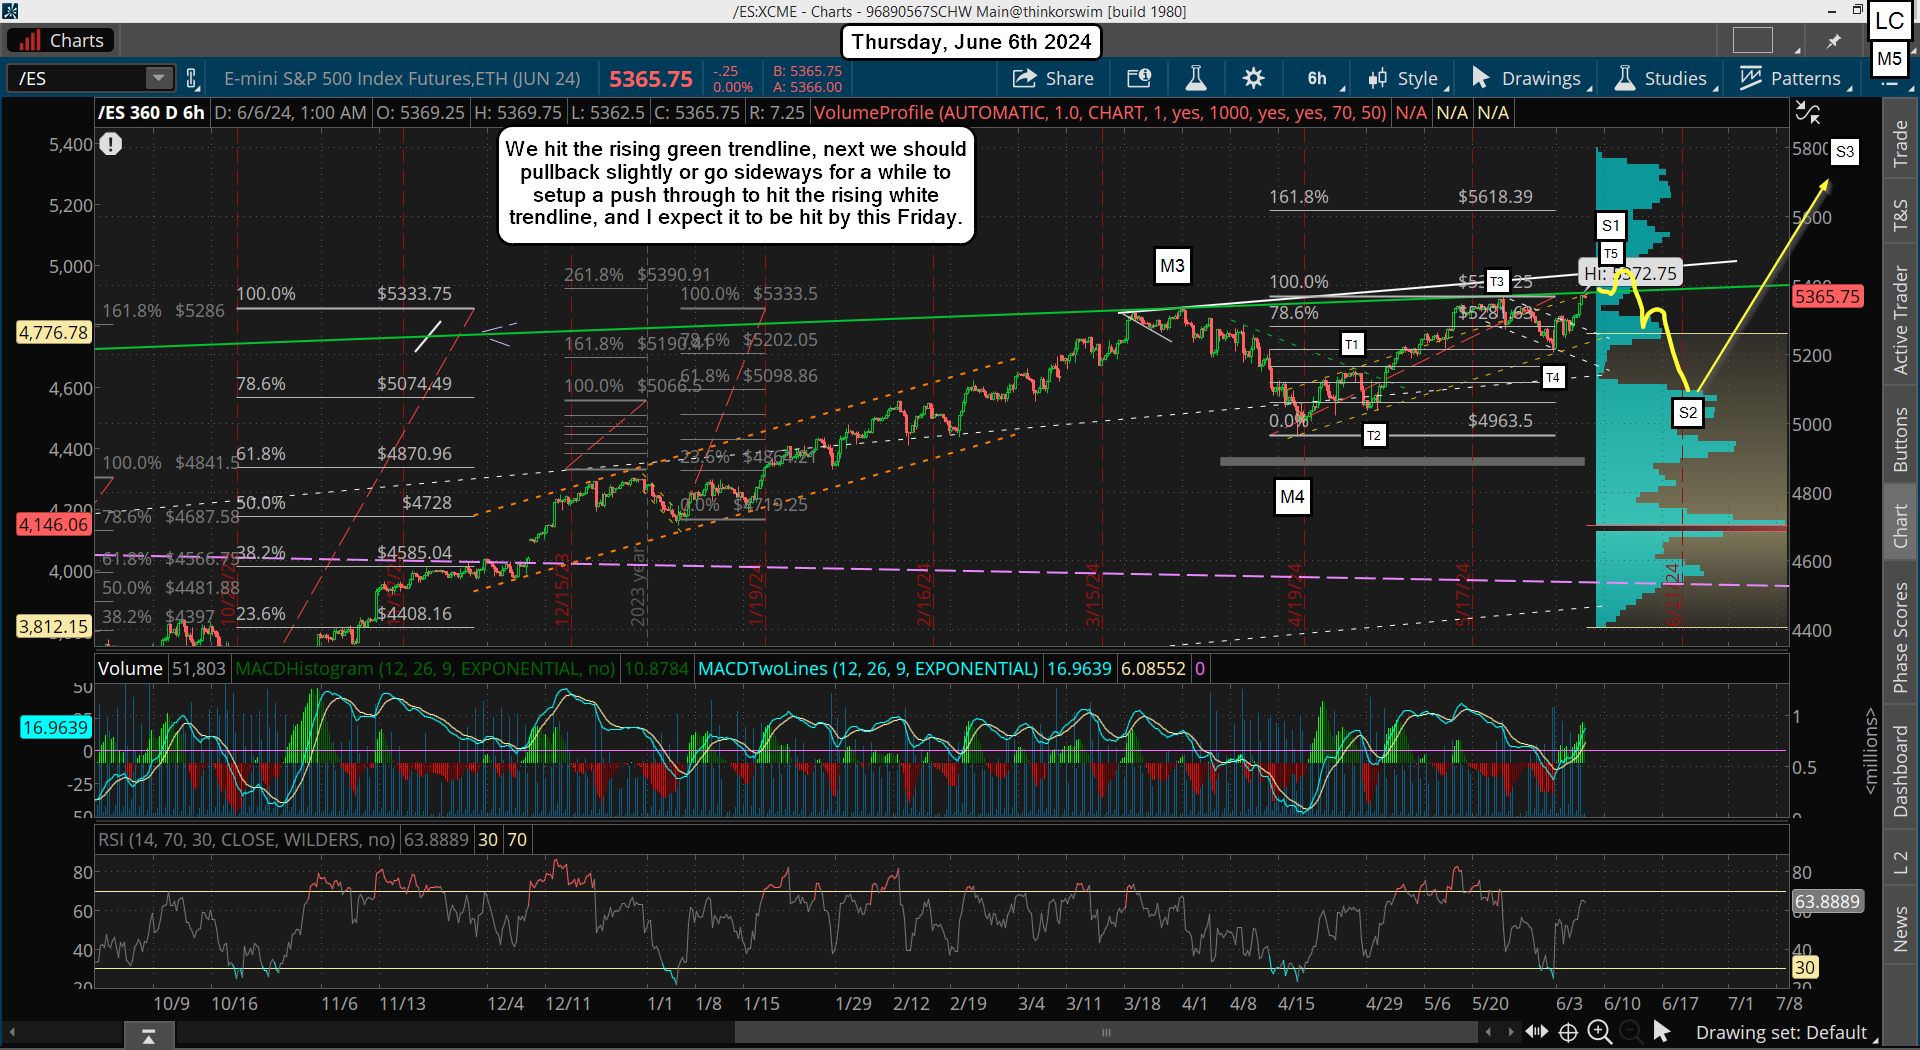
We've rallied into the green trendline now and made a new high. We will likely push through it by Friday and go for the rising white trendline. Again, I doubt if we get through it on the first attempt. The green trendline was hit in March, then May and this third time it should get through... so that's why I don't see it getting through the white line on the first time.

Now, will that be hit today? I don't know but if we go sideways today and/or tomorrow then I look for that push higher into Friday. Regardless of whether it's today, tomorrow or Friday it should end this rally and we should see a pullback start next week going into the FOMC meeting on Wednesday, which has the CPI out the same day.

I haven't looked at the wave count in quite awhile, so let's look at it now. Below is the big picture.

As you can see the Medium Wave 4 pullback was the one that I was looking to hit the FP on the SPY from the Yahoo site, but it stopped short at 4963.50 on the ES, so the Yahoo FP was a dud it seems. From there we started Medium Wave 5 up, adn that's what we are currently in right now. It should divide into 5 smaller waves and those waves can divide into tiny waves too.

Have a blessed day.

ES Morning Update June 5th 2024

0

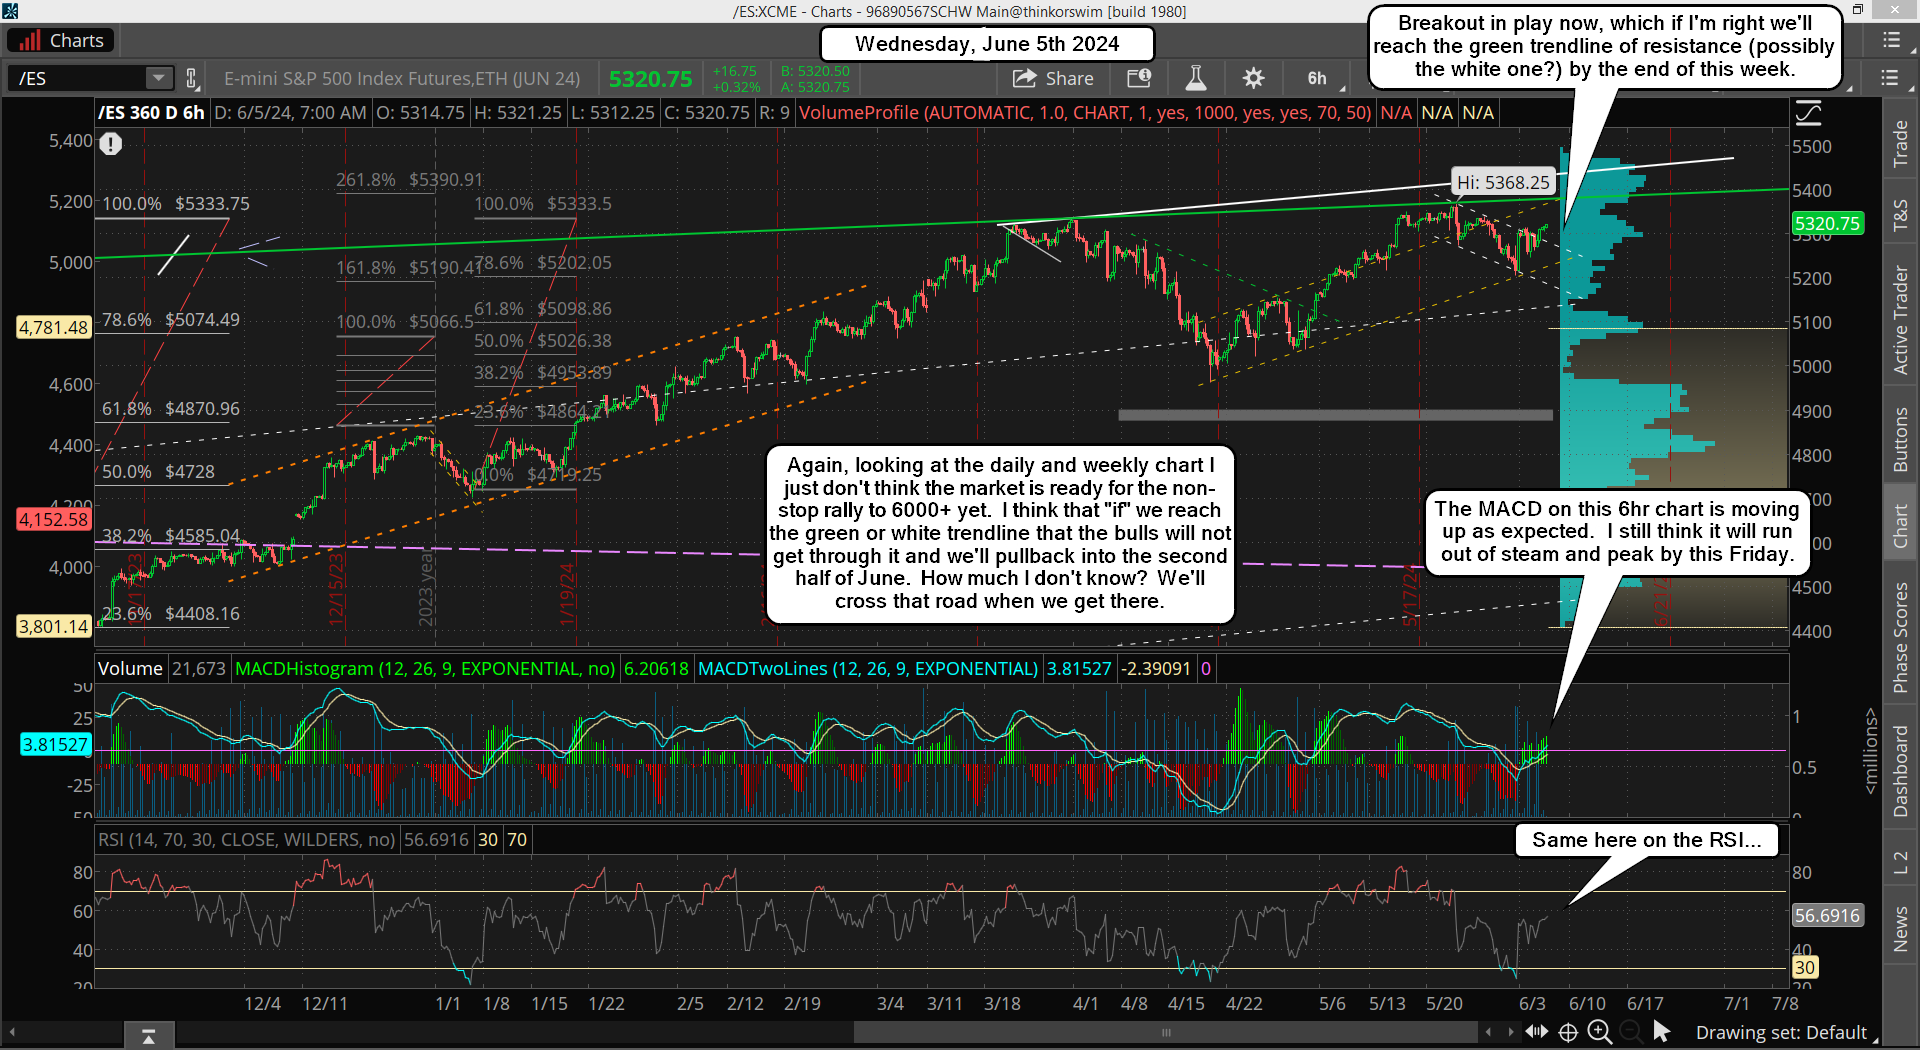
The market is getting ready to make a move higher it seems, which this time around I think it could get through the green trendline of resistance, but the white trendline should be a lot harder to get through. If we get a breakout soon then I think we'll reach that zone and stop there and go sideways more under it into this Friday to give the appearance of another breakout, but I think we will be overbought on the 6hr chart then and will pullback next week in front of the FOMC meeting.

After that I'm not sure but the second half of June is normally weak from the Seasonality Chart, so I don't think we'll go much higher but instead we will pullback. How much I just don't know, so we'll have to wait and see where we are at then and what the technicals look like. Right now they are looking bullish still, at least for the short term. I still don't think the market is ready to start the big leg up to 6000+, as I think we won't start that move until July.

Have a blessed day.

ES Morning Update June 4th 2024

0

A decent pullback yesterday, but it got bought back up as expected. Technicals are still bullish on the 6hr chart and the daily chart is mixed... meaning it could go either way. And the weekly is the same as yesterday... tired basically, with a slight downward bias.

It is still choppy essentially with nothing aligned all up together in sync to support a big breakout higher or a selloff lower. If we go up today and into tomorrow then we could get overbought on the RSI and MACD of the 6hr chart by Thursday, possibly as late as Friday.

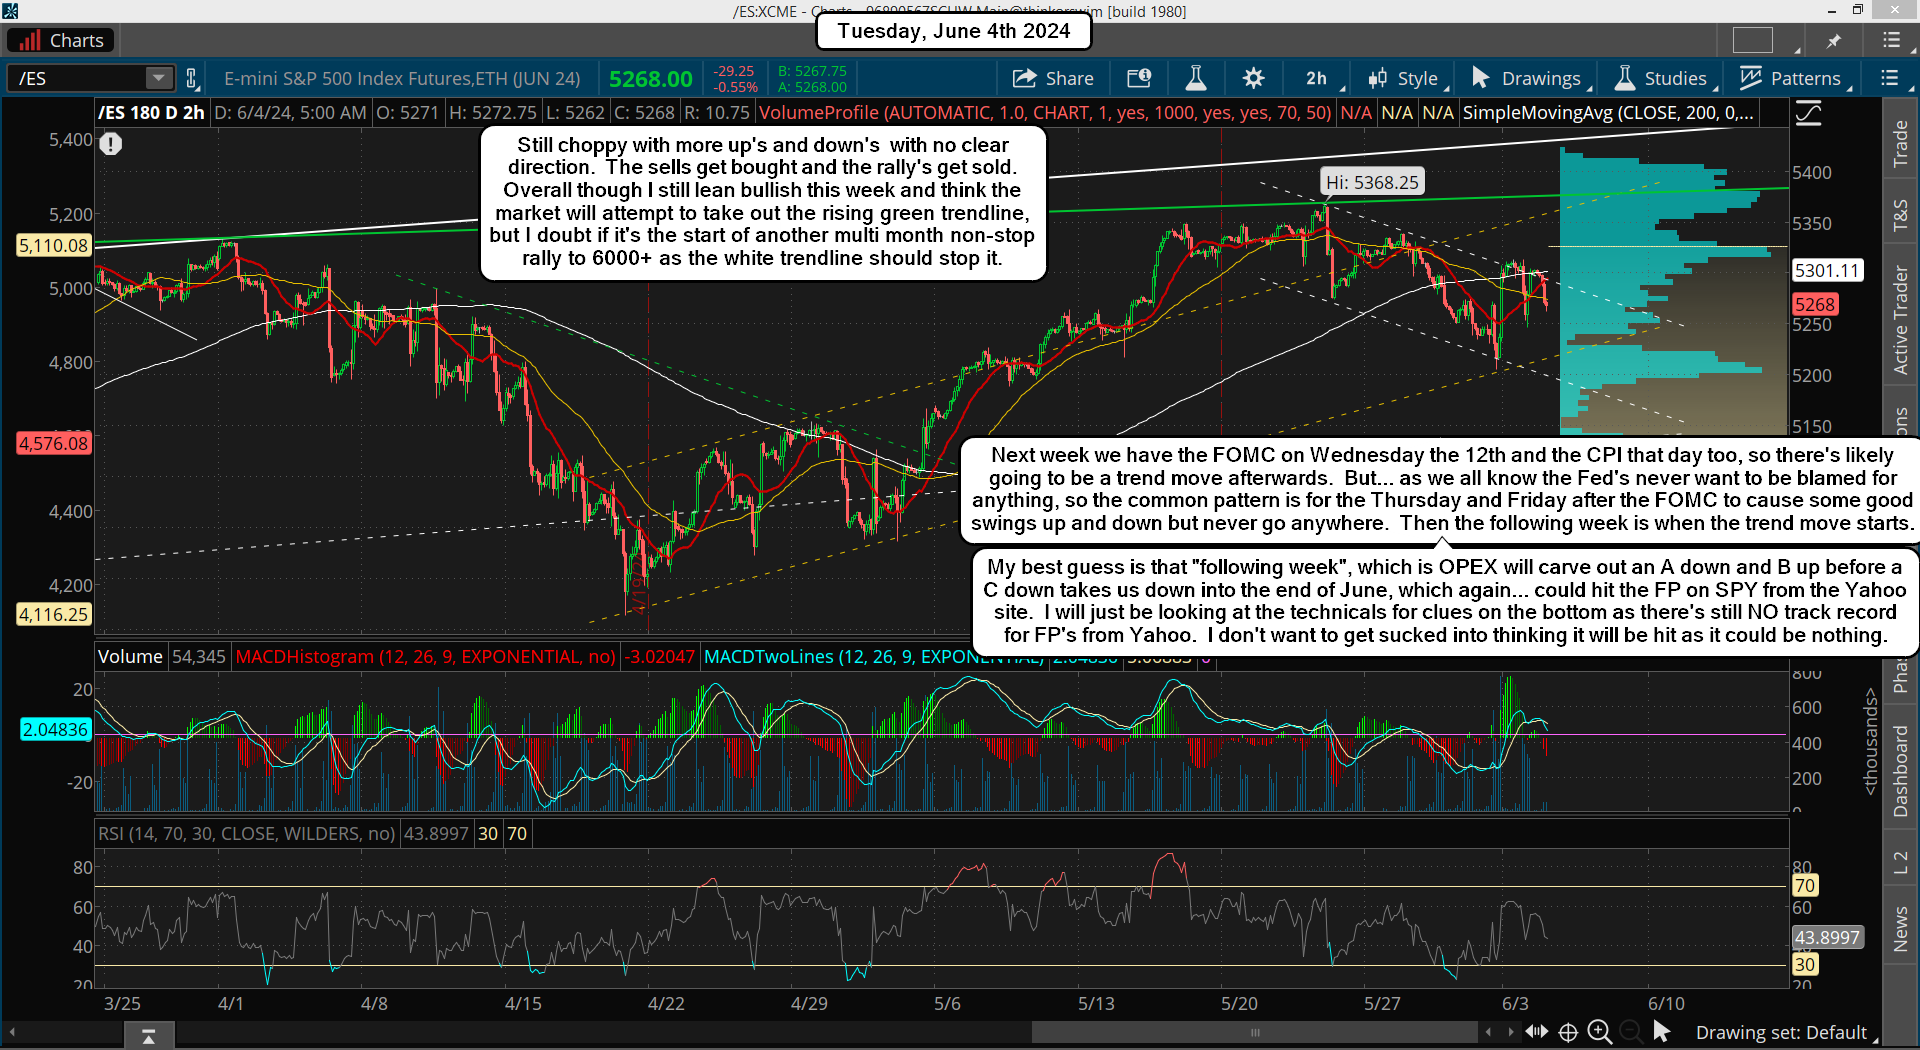
That doesn't mean we will just rollover and drop hard but if we are overbought when up into the green or white trendline of resistance I'd have to think it will hold and we'll pullback again... which should be to at least revisit yesterdays low, probably lower. This is again just "guessing" on where the RSI and MACD will top out at, and my best guess is Thursday. The pullback would be into the next FOMC on Wednesday the 12th, which we've seen many many times, so this is probably how the rest of the week will play out.

Have a blessed day.

s2Member®