Thursday, September 24, 2026
Home Blog Page 22

ES Morning Update May 9th 2024

0

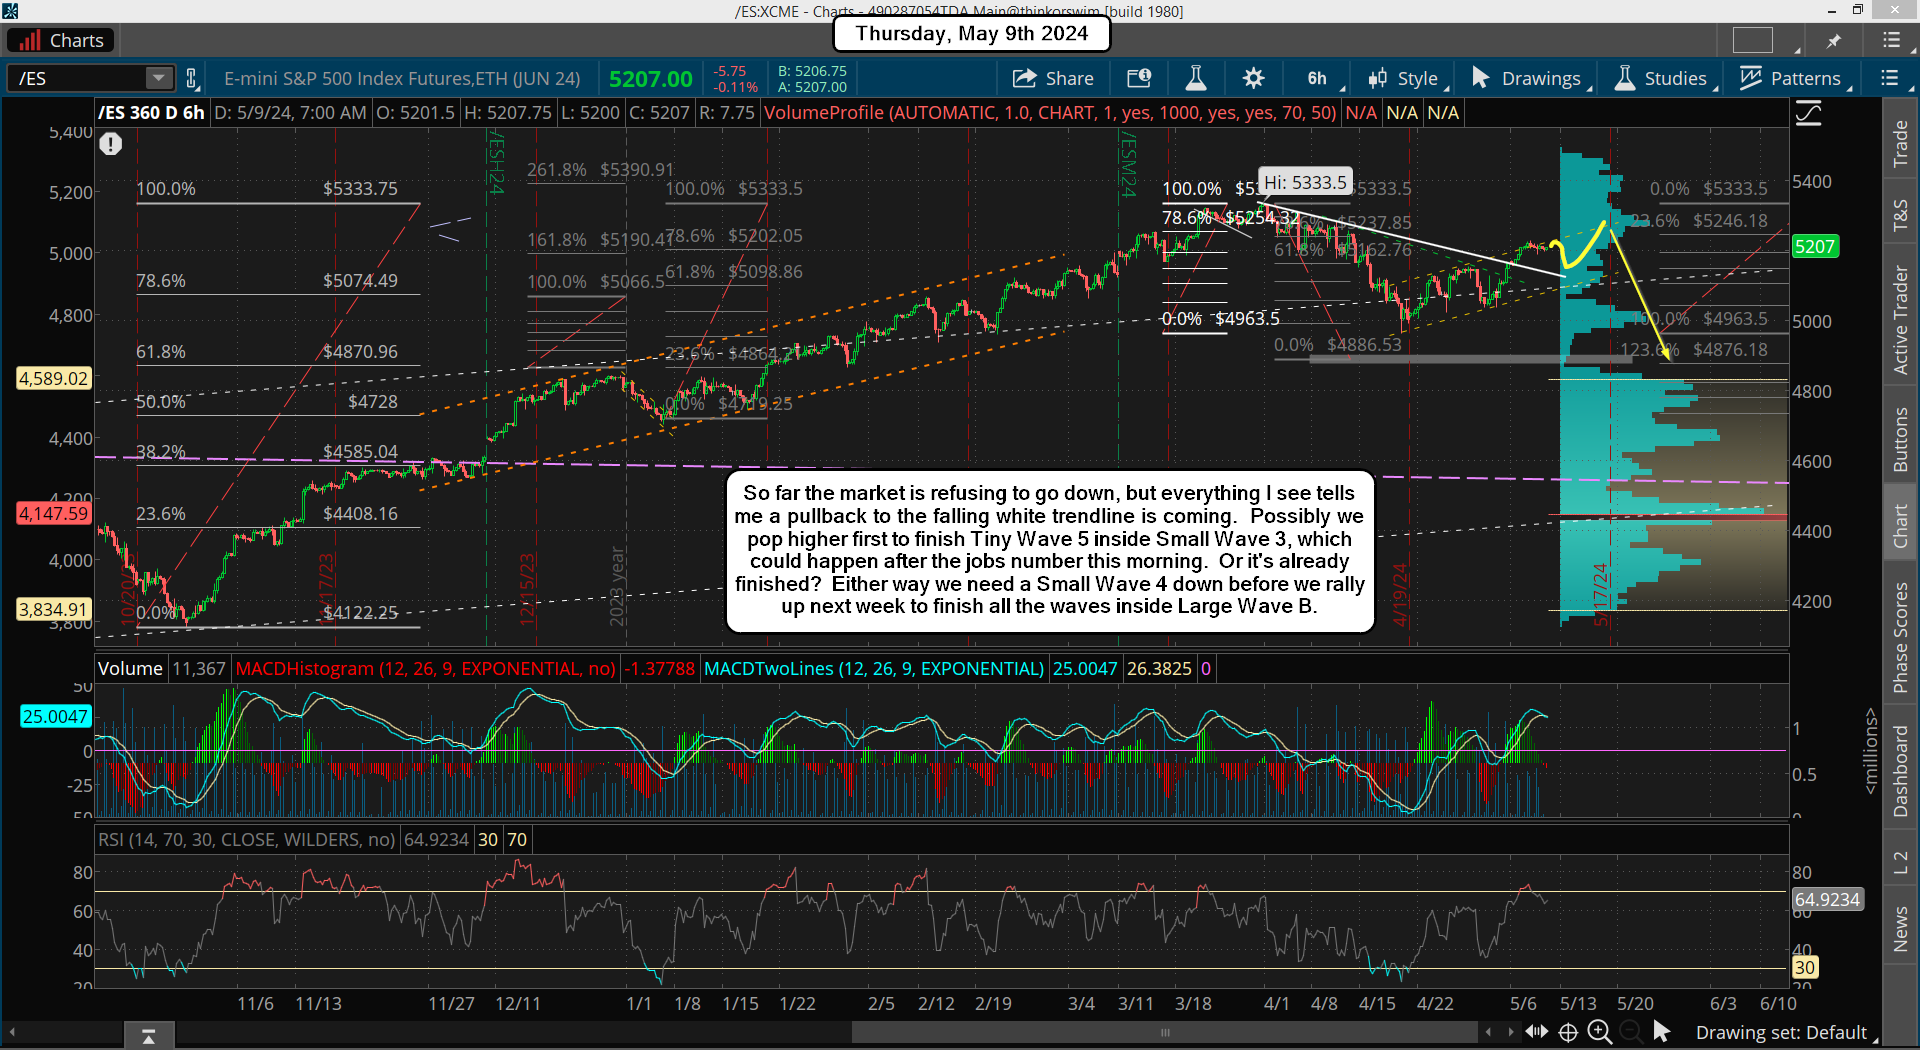
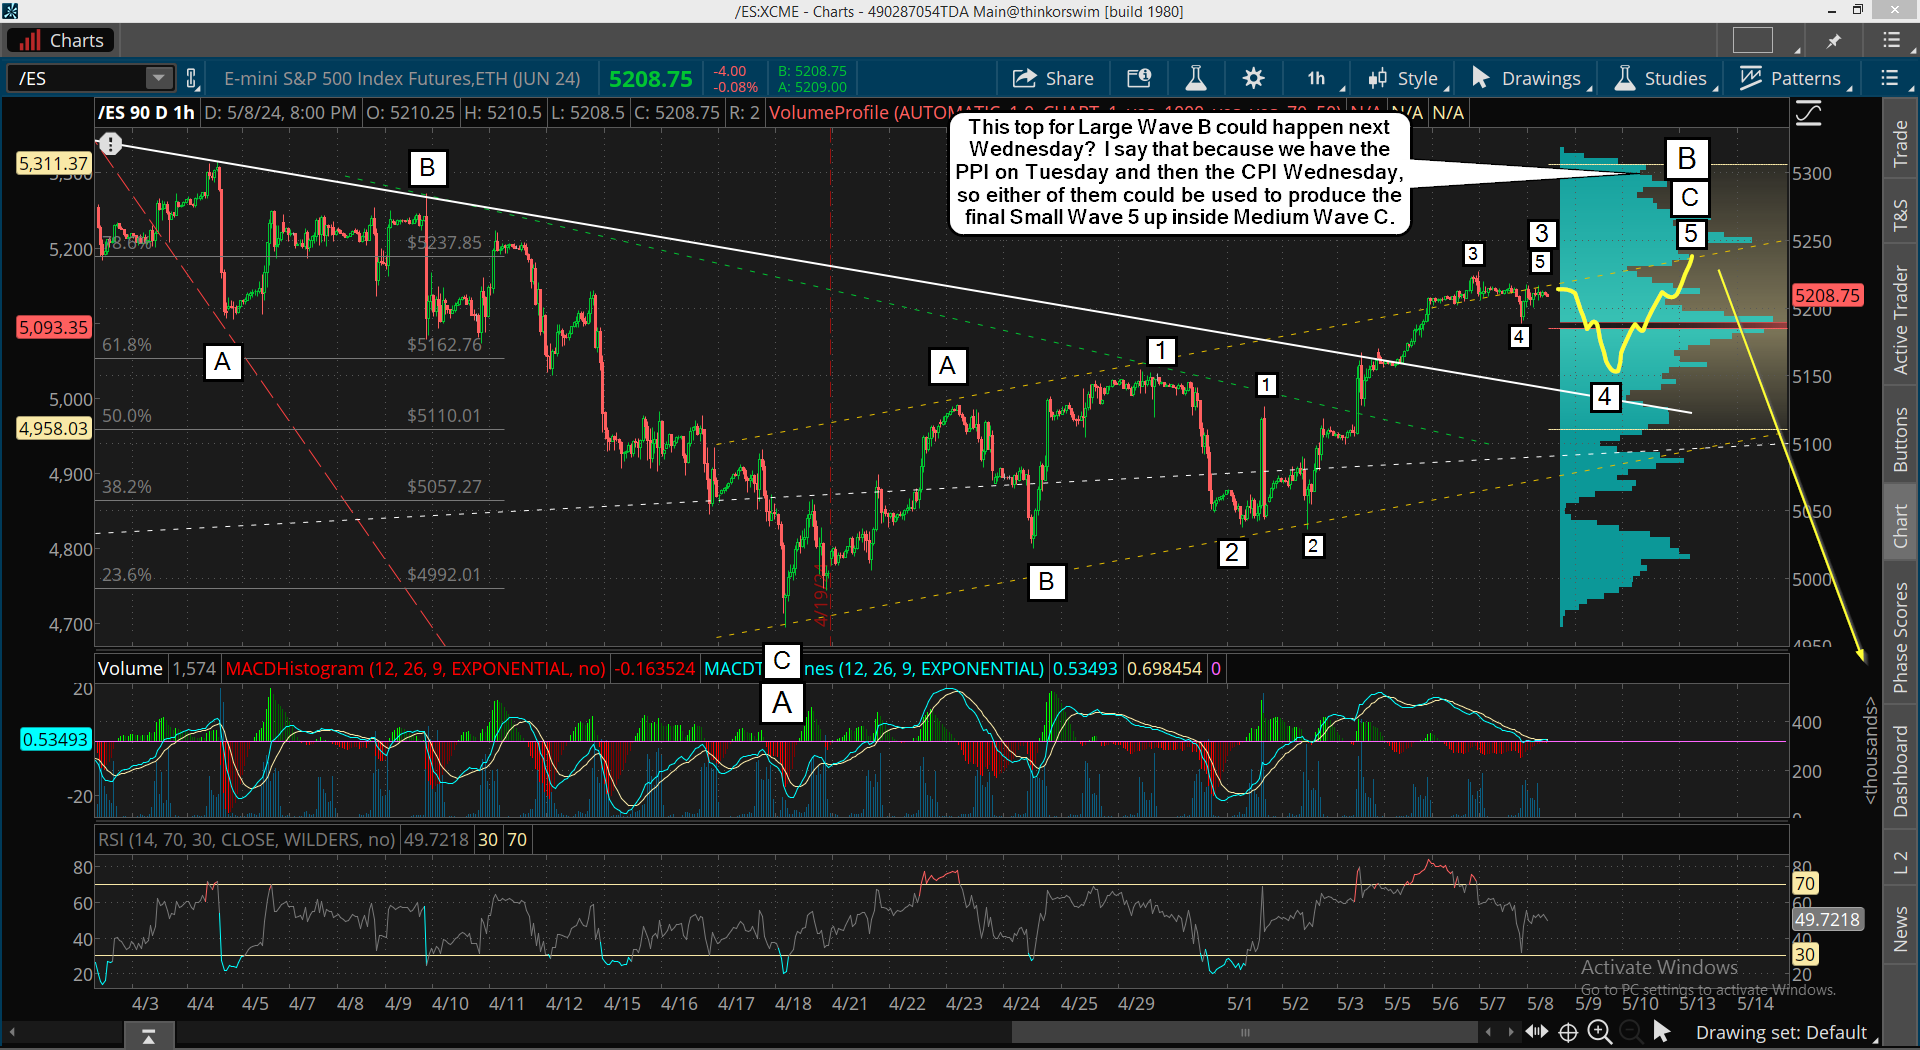
It looks to me that Tiny Wave 4 down finished early yesterday and Tiny Wave 5 followed the rest of the day. It's either finished or should finish today, and then Small Wave 4 down should follow, which might last in tomorrow or Monday? Target is still a test of the 5150 zone, which it might pierce and reach 5100, but that's not something I can predict for certain.

After that, which will be next week, we should see that last Small Wave 5 (possibly Wednesday?), which might make a slightly lower high (truncated 5th), or higher high. I lean toward the higher high as that will suck in the most bulls to finish Medium Wave C up inside Large Wave B up. That's the ideal move to trap the most traders on the wrong side before we get the drop for Large Wave C down. It might end before the end of the month and then we get a quick bounce up and back down for a double bottom around May 30th or 31st where "turns" commonly happen.

That's a tough call to figure out in advance, so I'll just have to keep adjusting as we go forward in time. If I can see 5 clean waves down for Large C into say the 24th (for example), and we hit the FP, then I'd look for for a bounce the following week that gets retested into the 30th or 31st as I don't think we are going up huge until the start of June.

Have a blessed day.

ES Morning Update May 8th 2024

2

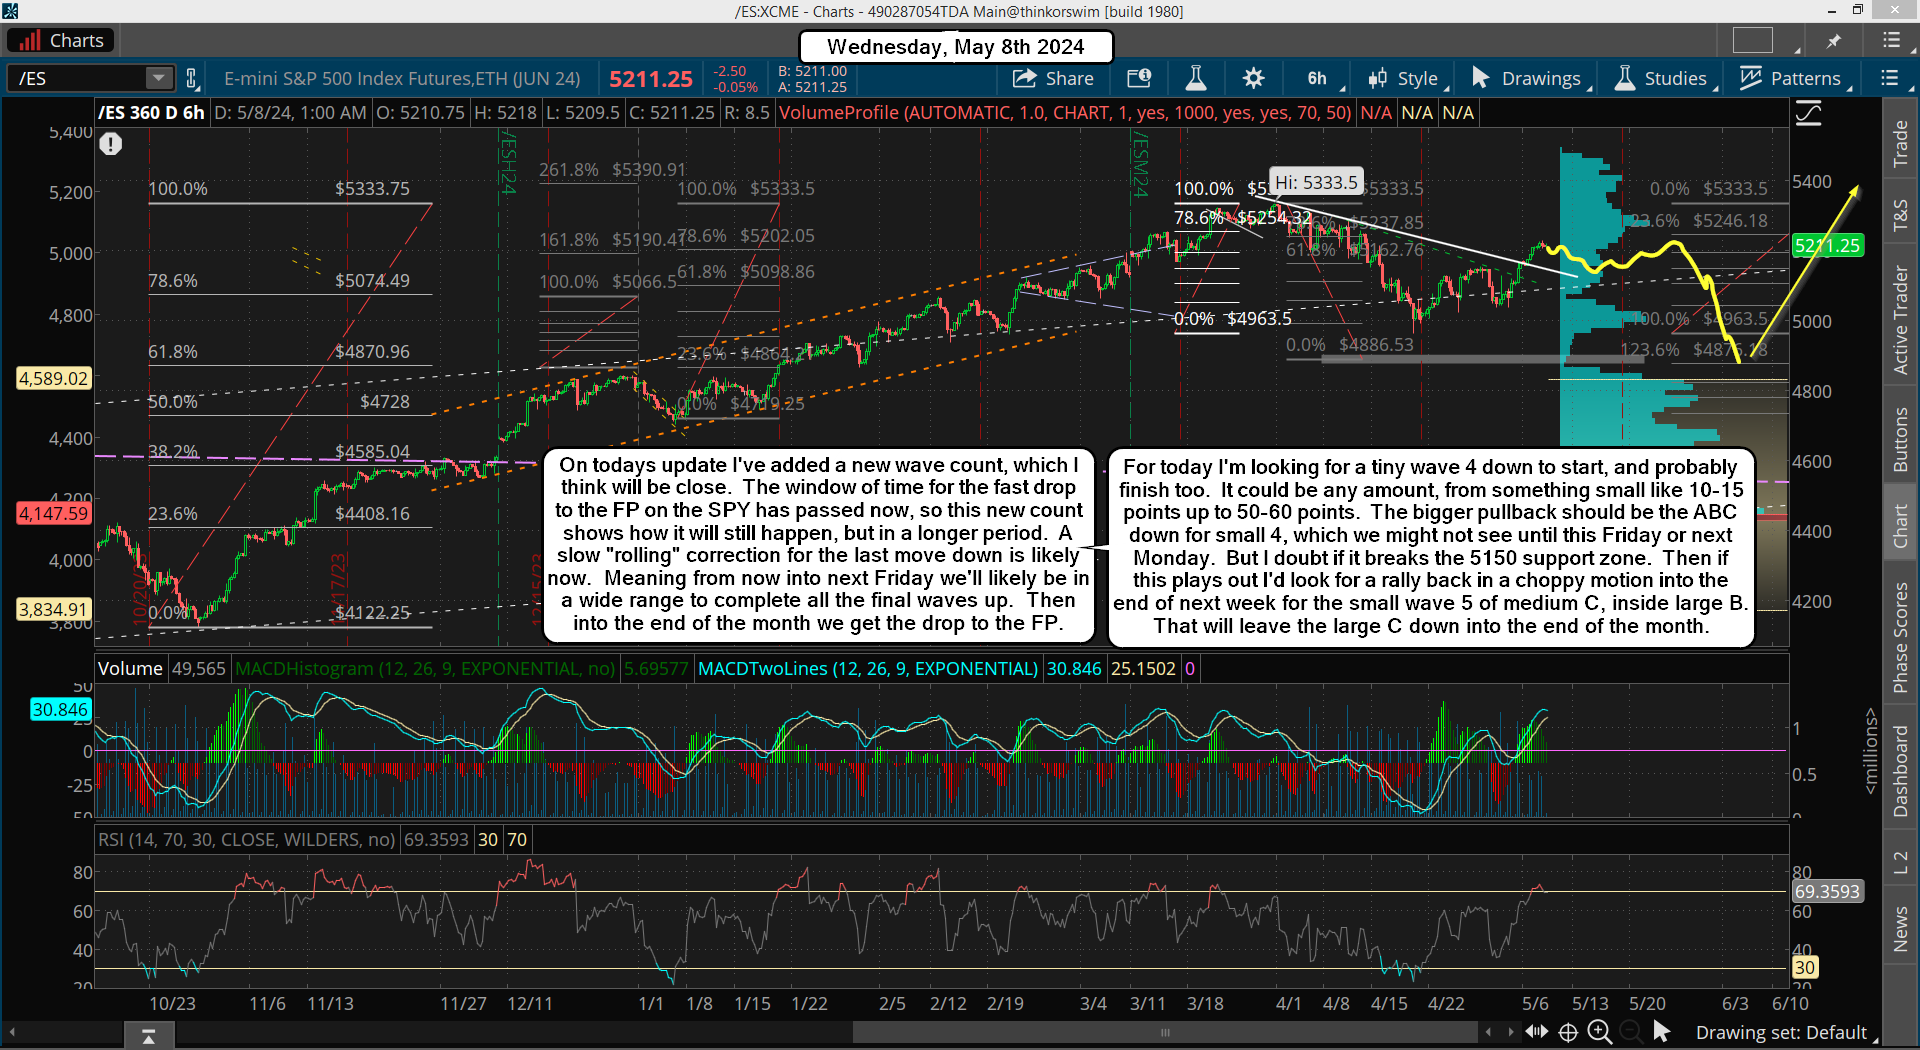
A pause day yesterday that closed a little positive but not much. Overall it just held the 5200 level as every attempt to breakout over 5230 failed. The market is basing for a big move, and most of last month I would say that the "basing" is bullish, but not this time around. If bulls can't get through the big resistance zone up to 5170 by the next day or so they will be forced to punt the ball to the bears.

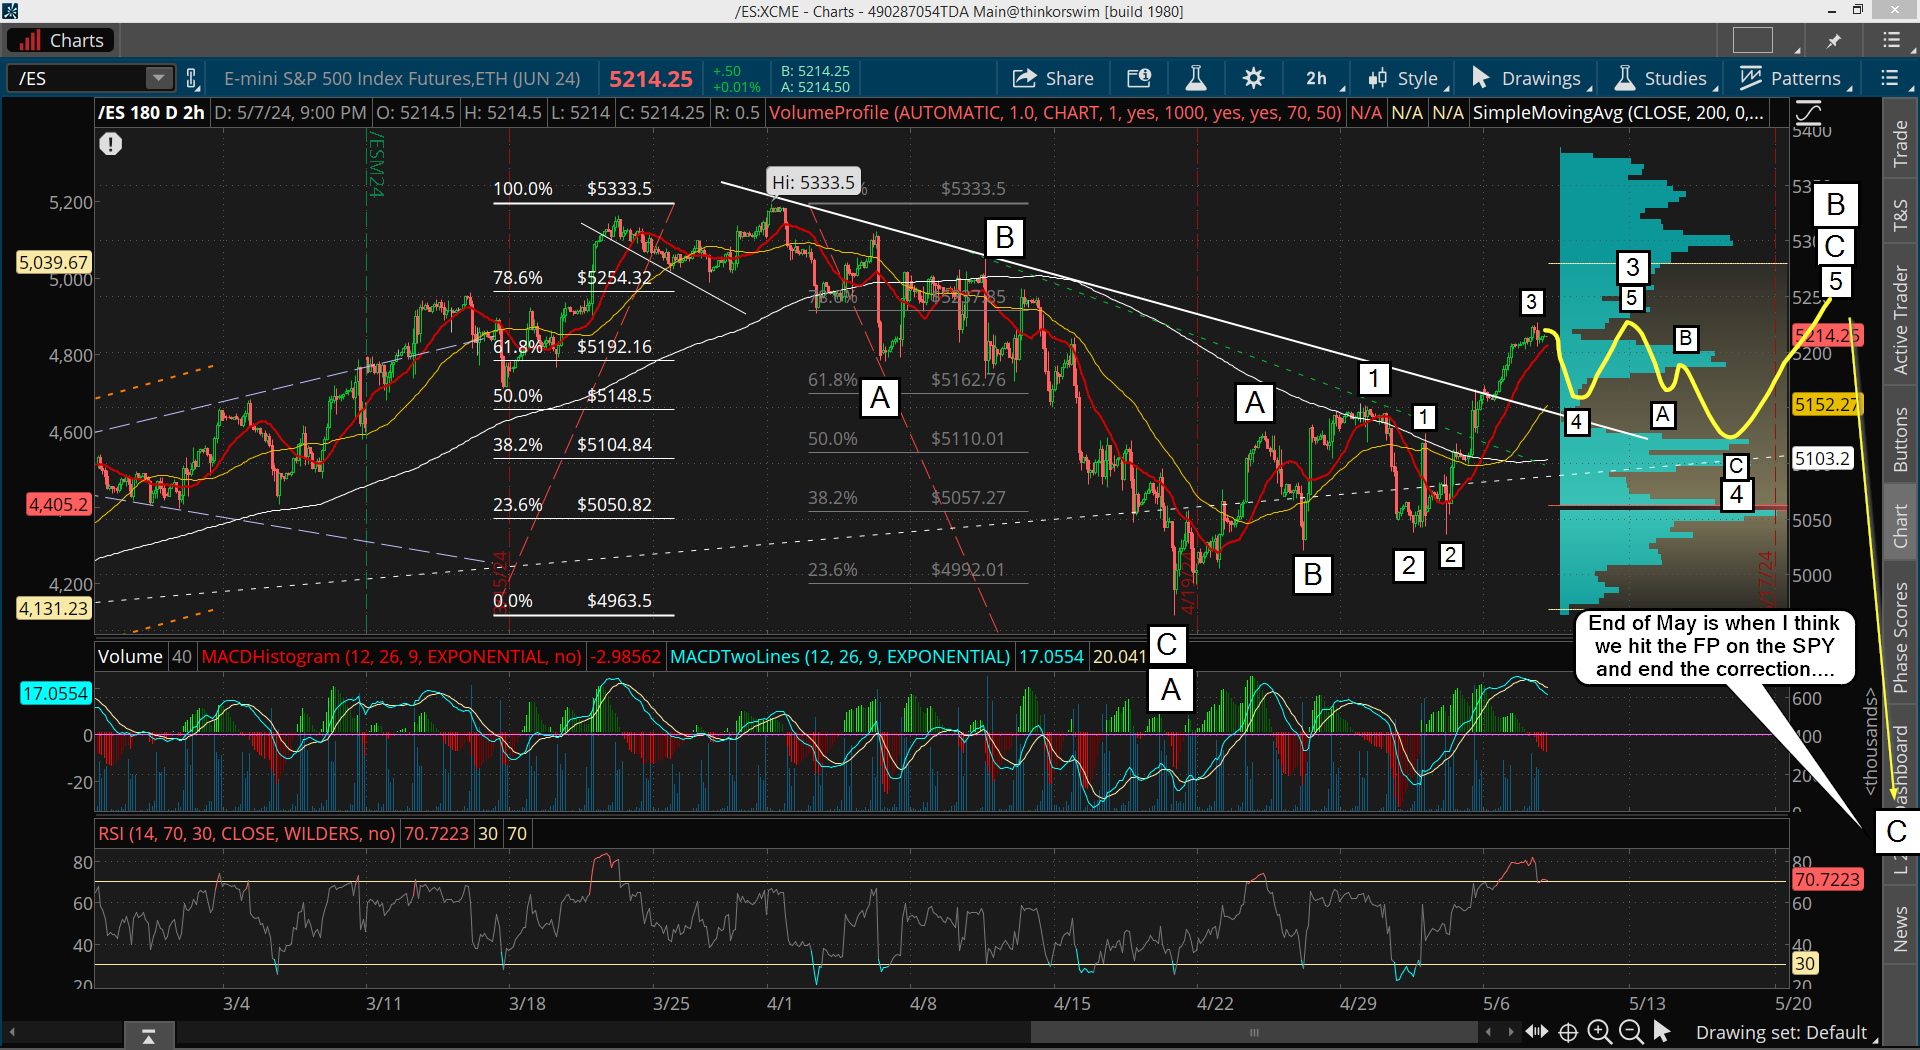
But... I don't think we are ready to start the drop to the FP yet.  The window of time has run out I believe.  Instead I think we will get a pullback to support from the falling white trendline around the 5150 zone.  From there we should go back up but it might take a week or more to take out yesterdays high.  Here's the possible wave count...

I discussed this as possible last week, and while I wanted to see the FP hit already it's just not looking good for that happening now.  This looks to me like it's going to drag out into the end of this month.  OPEX is typically a bullish week, or at least a choppy one that doesn't tank hard.  A rangebound trading zone is possible for that week, which is next week.

That would leave the last 2 weeks of this month for the large C wave down to play out and hit the FP, which should have 5 medium waves inside it and of course 5 small  waves inside the wave 3 of that large C wave.  But that's looking more and more like it's going to happen during the second half of this month.

This is needed I think for the weekly chart to have enough time to cool off from being so overbought into the April top.  If the whole month of May is used to reset it then June can be a strong rally month where a new all time high will likely happen from.  So for now, this wave count and forecast is what I think will play out.  No amount of rooting for, begging for or praying is going to make the market do what you want it to do.  You have to accept what it gives you and what it's telling you is most likely to happen in the future.  This is what I think it's telling me, and will happen.  Of course I'll adjust as we go forward.

Have a blessed day.

ES Morning Update May 7th 2024

0

Another nice up day yesterday. It's truly amazing to see it reach my 5192 target, and pierce through it. From everything I see there's really nothing left on the upside here as it will be like picking up pennies in front of a steamroller because the nickels, dimes, quarters and dollars have all been picked up already.

I took another short yesterday and will be adding my last one today so I can average into my position. We have a big drop coming and it should happen this week. My biggest worry is that they hold it up all week as then the drop could be much larger then just down to my 2 FP's on the SPY, which are new to me as they are from Yahoo and not Think or Swim. So I don't have a multi-year track record of them being accurate like all the FP's on Think or Swim.

But again, just what's the odds of 2 of them being put out pointing to the same area and disappearing the next day? I have to give them attention as they also align up as the expected target from prior declines in the past. Like for example, this decline looks similar to the 9/3/21 ABC correction into the 10/4/21 low, and for that low the first A wave drop was followed by a similar 61.85+ rally, which then was followed by a C wave down that equaled about 75% of the A wave.

I find it common that in many pullbacks inside a larger bull market, in where it's an ABC, the C wave is truncated short of the A wave. That was the case back then and could be the case now too? Ironically the 75% mark down for the C wave coming next is about where the FP will be at. The MACD's and RSI look similar to back then too, so there are many reasons to suggest we will have another leg down before this correction ends.

Nailing the exact day it turns down though isn't easy, but we should be finished now as the 61.8% retrace level has been hit and pierced. Nothing left but some chop I guess, or just rollover and start the decline.

Have a blessed day.

ES Morning Update May 6th 2024

5

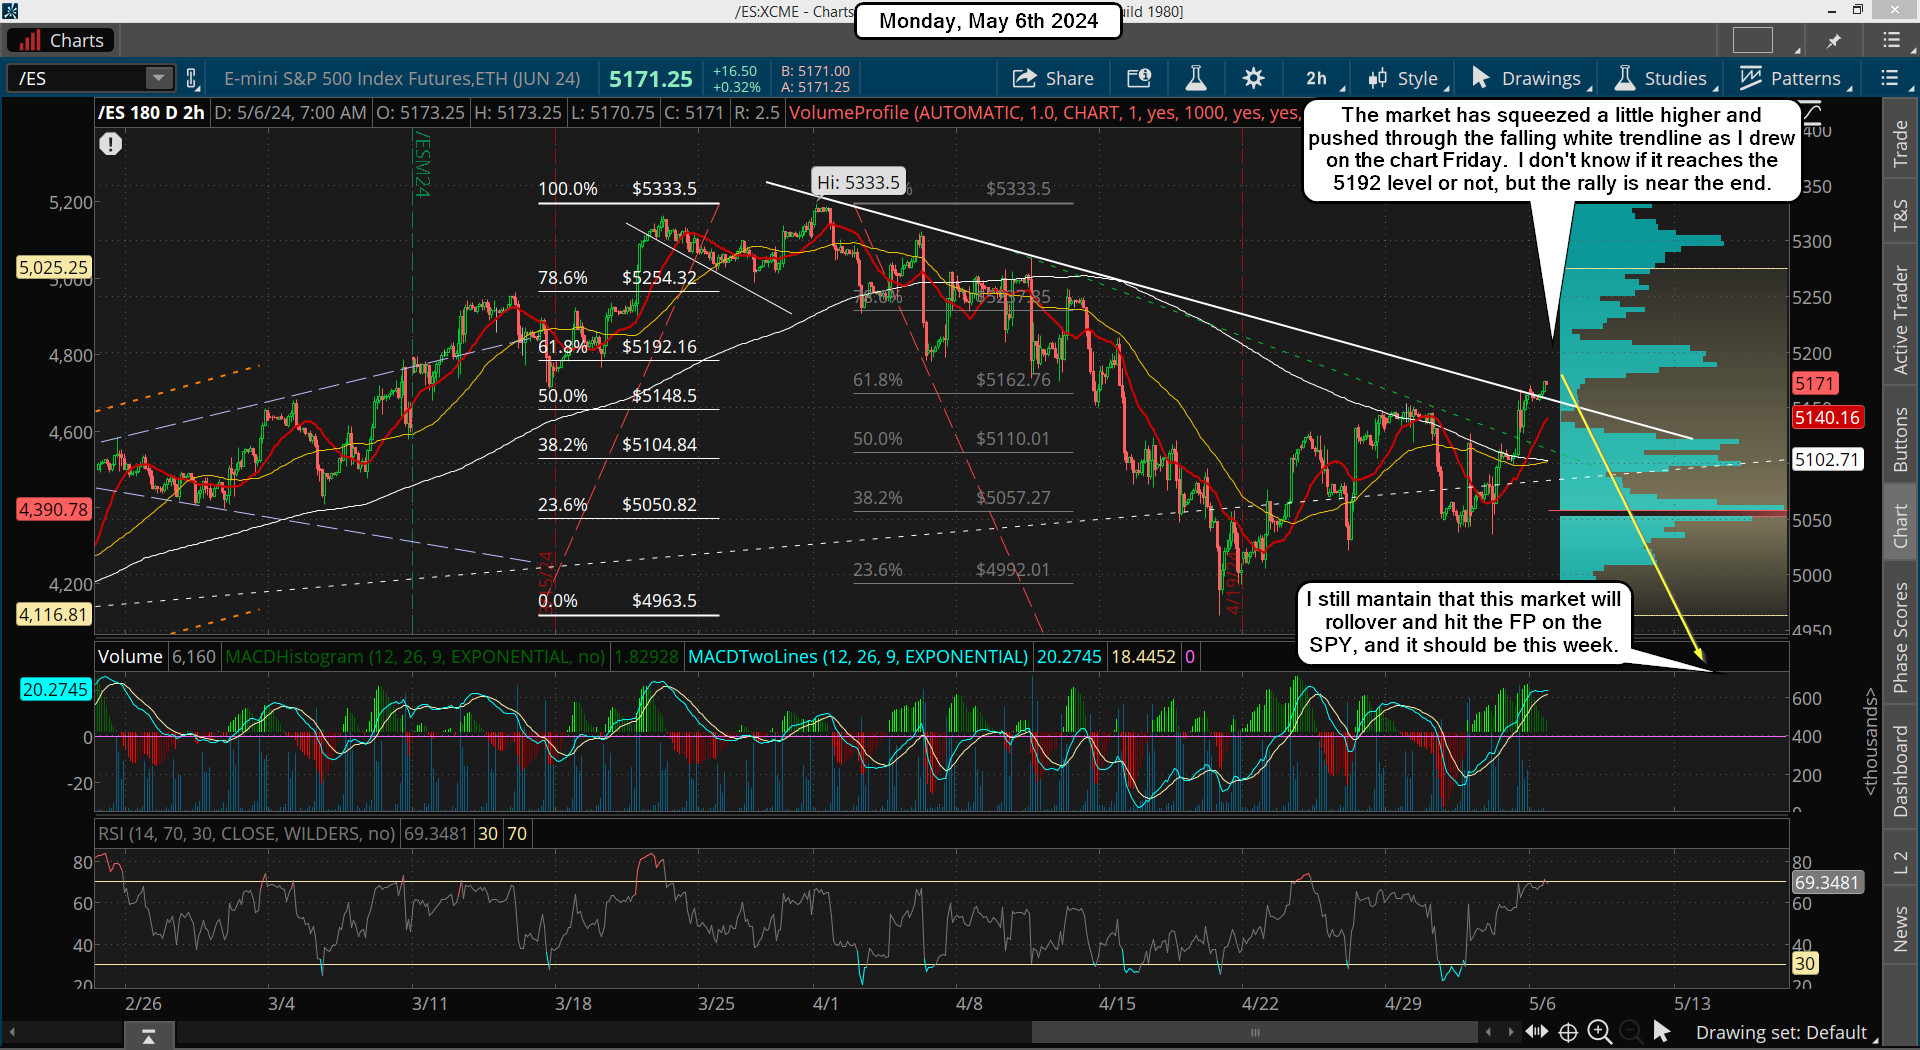
We got the rally I was expecting on Friday, and it stopped right at the falling white trendline of resistance, which is shy a little of the actual 61.8% retracement at 5192, but this isn't an exact science.

The market never makes it that easy, and will commonly either pierce that zone or fall short, so I took my short Friday and will ride out anymore upside if it happens. The last move down is still coming in my opinion and should happen this week. The double conformation from 2 fake prints of 483.07 and 483.62 on the SPY gives me high confidence that we will hit them.

Currently, as of the close Friday, the ratio between the SPY and the SPX would put the SPX at 4844.77 if the 483.07 FP on the SPY is hit. If it's just the 483.62 FP then the SPX should hit 4850.28, and with the the ES closing at 5161.50 on Friday, and the SPX at 5127.79, that's about a 33 point difference.

Now that could be off a little as the ES did trade a little longer afterhours, while the SPX closed at 4pm EST, so I'd lean closer to about 30 points higher on it as I think it went up a little higher. The close right at 4pm EST was 5156.50, so that's like 29 point difference to be precise. Anyway, you get the idea. We should hit the FP on the SPY and pierce it by some amount. That's the exit for my shorts and I'll look for a long right afterwards.

Have a blessed day.

ES Morning Update May 3rd 2024

0

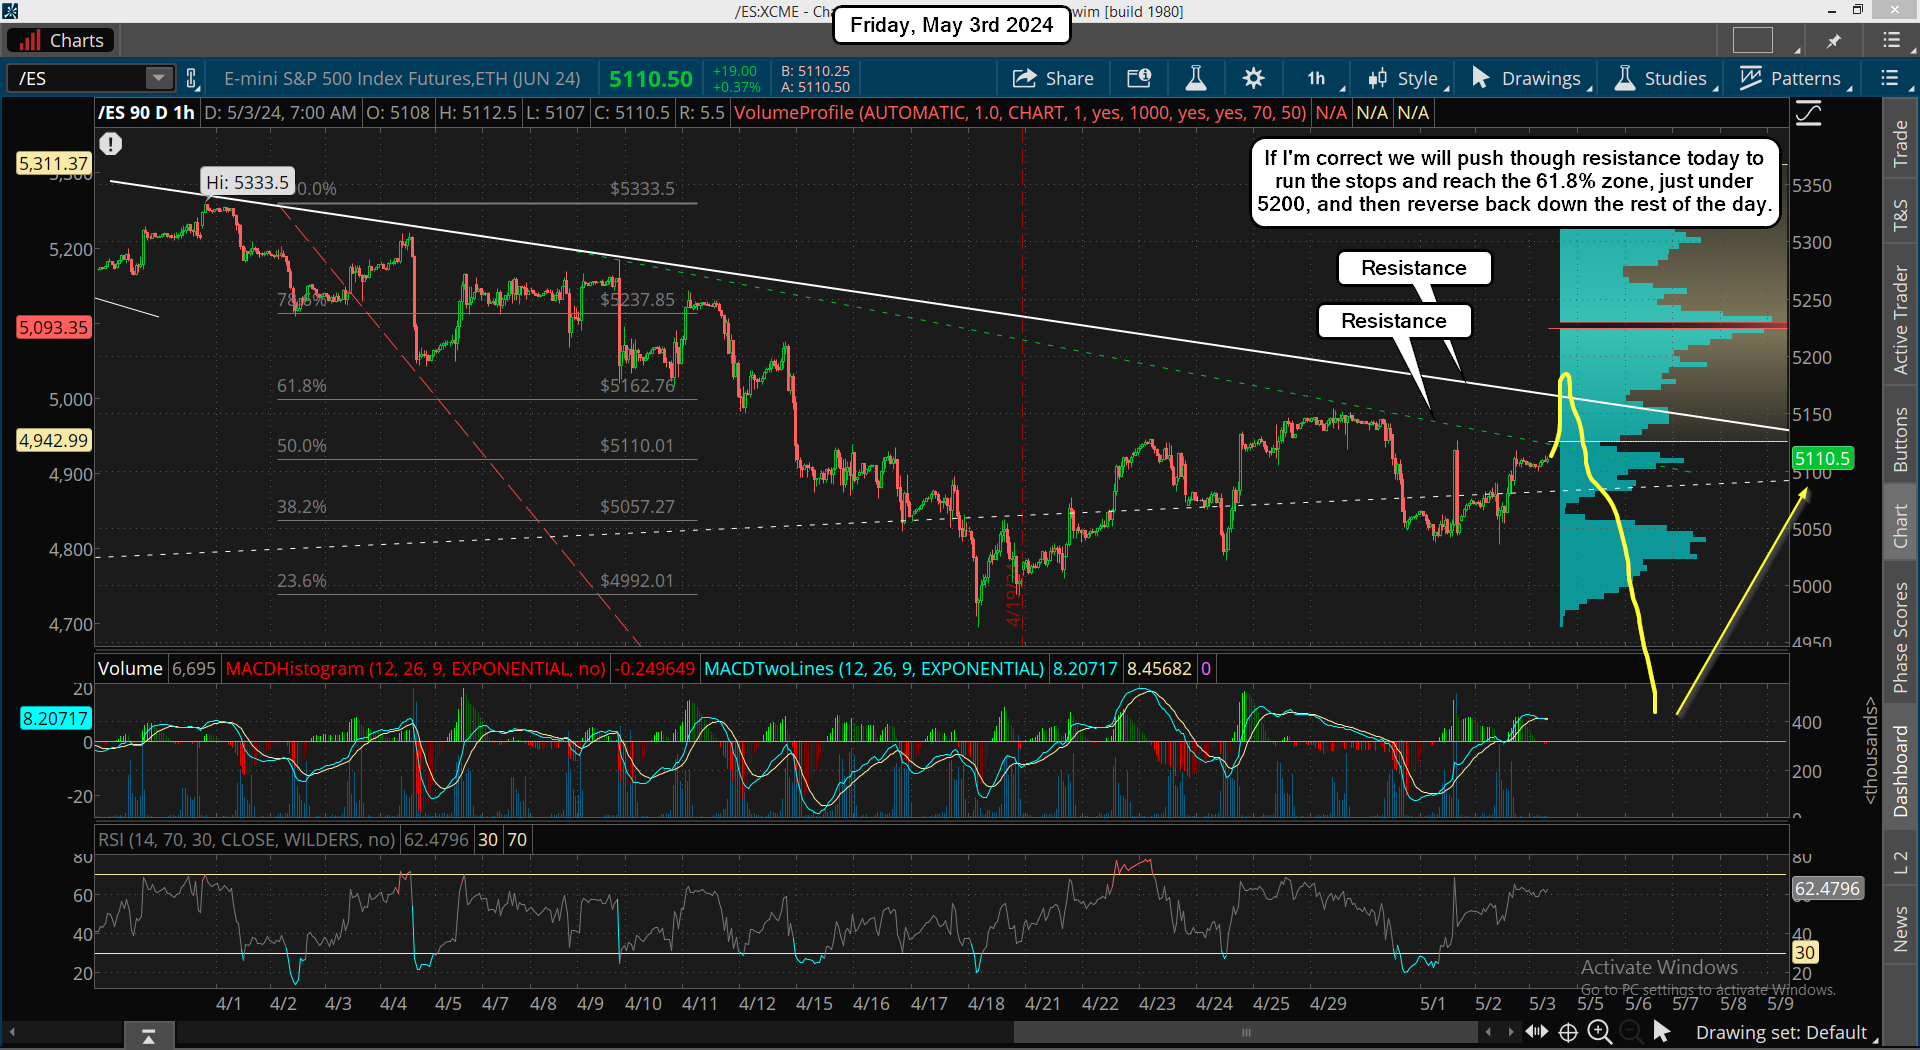
So far so good for my thoughts as discussed in yesterdays post. The market held support yesterday and went up nicely afterhours from the Apple earnings. This morning we have the jobs data coming out before the open and we've made a nice bull flag after the close just under resistance. If there's ever a time to push through and run the stops overhead it will be today.

Just rig the jobs number (they always do anyway) and we should push right through. I'd then look for my upside target zone (posted yesterday) to be hit, which will complete a 61.8% retrace. If that happens early today it's a short, and I think we could see complete reversal by the close as well. It should then start the drop to FP into early next week. Once it starts I don't expect too many bounces, if any?

The scarier it is the more powerful the squeeze back up from it... meaning we could see next week completely reverse the down move and put in a nice bottoming tail candle on the weekly chart. They should let anyone catch the coming down move to the FP after it starts. So I'll be looking to short it today if we reach the upside target zone, which is just a littel under 5200 on the ES basically.

Have a great weekend.

ES Morning Update May 2nd 2024

0

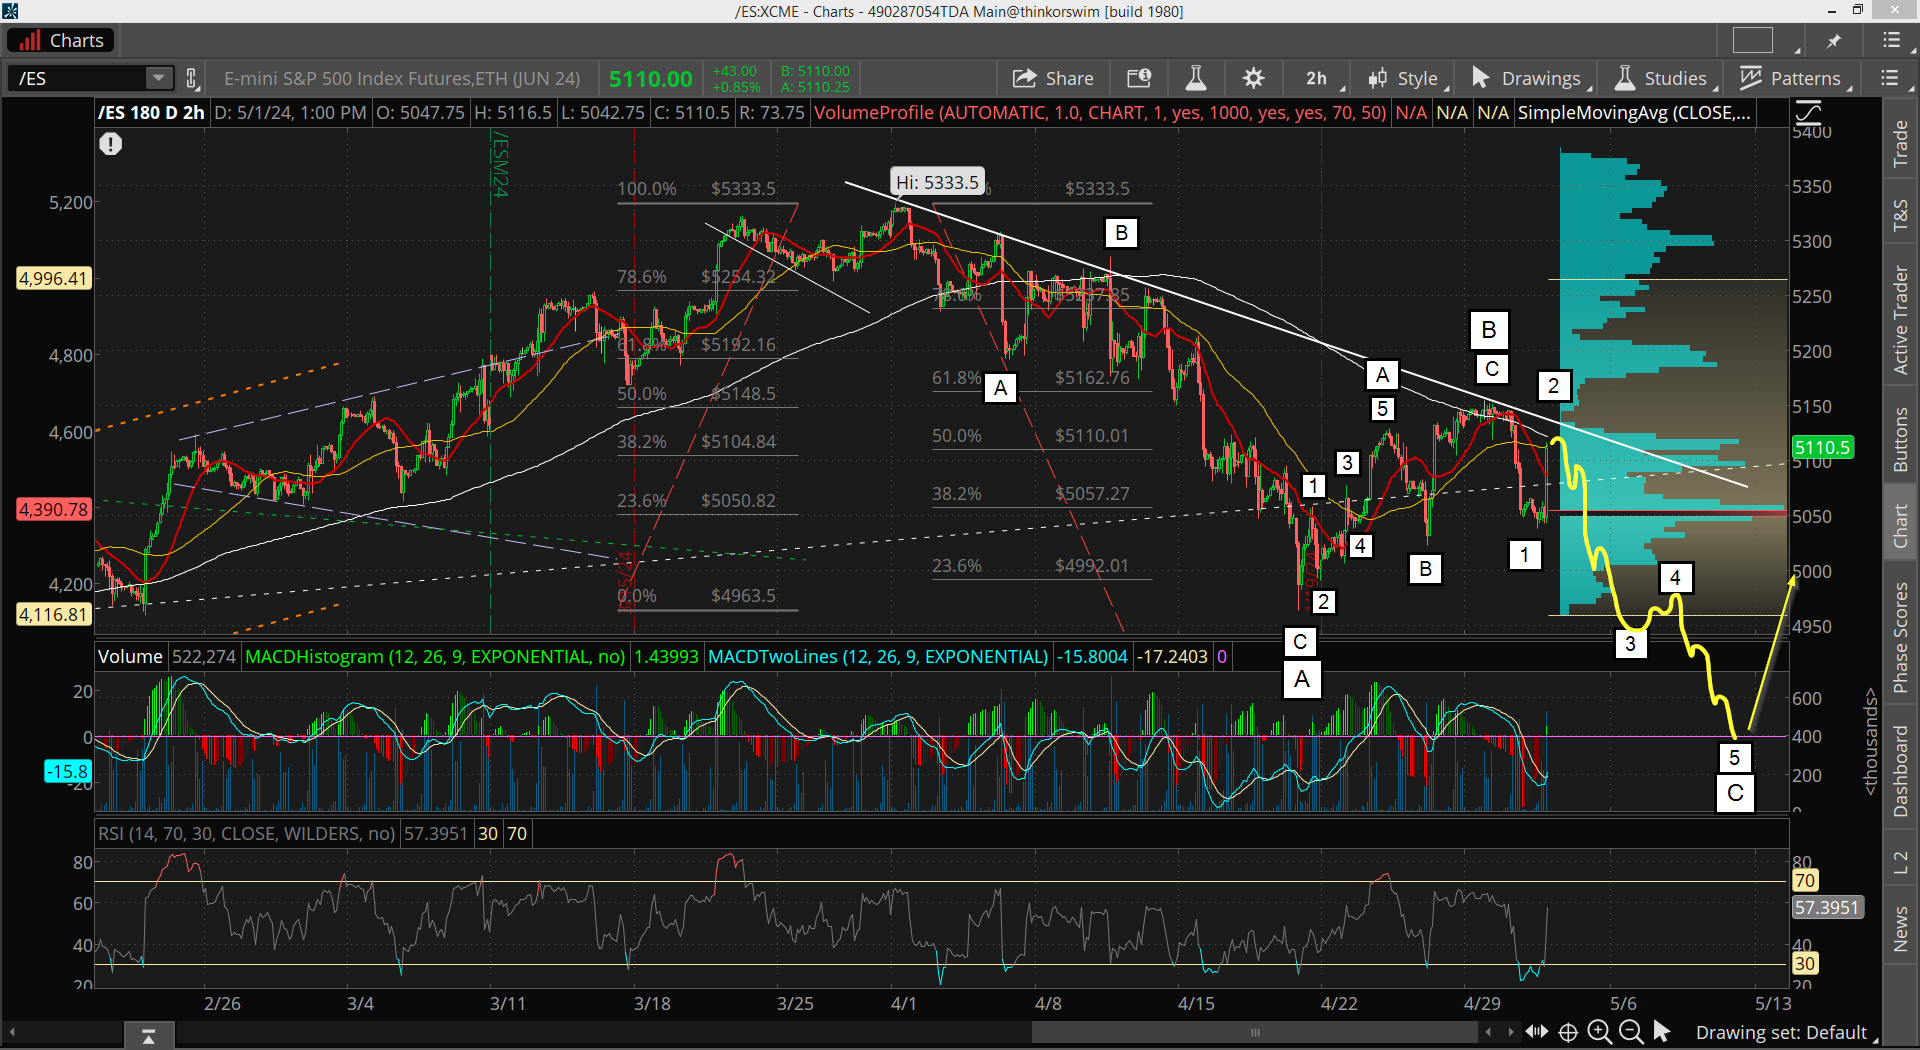
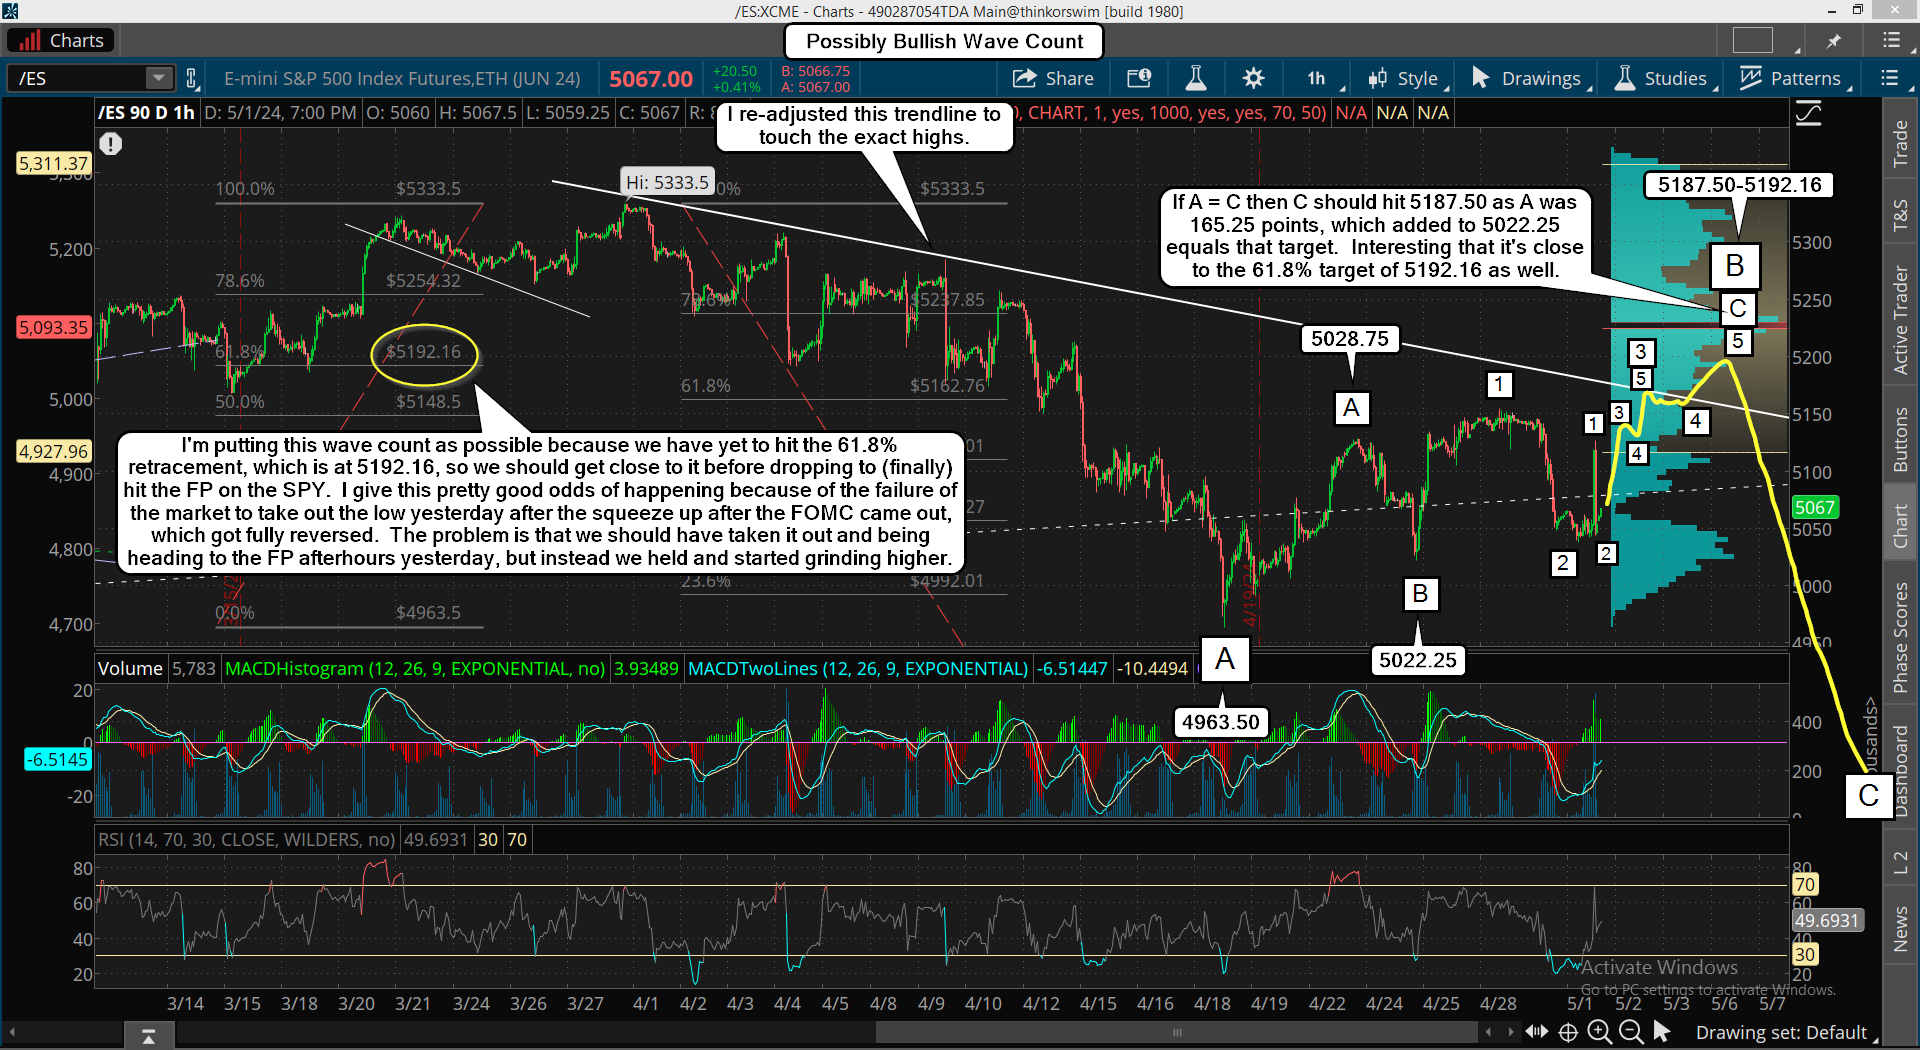
Sheesh... what a curve ball yesterday with that fast squeeze up after the FOMC that got fully reversed by the close. Insane move, and one I did not see coming. But after it rallied I thought to myself that it had to be a wave 2 up in the C down that should hit the FP in the next day or so. I then drew up a wave count and posted in the chatroom, which is below.

The market rolled over after I did that chart and I thought I was a genius as we were starting a wave 3 down inside a C wave, and the FP was within spitting distance now. WRONG! The market stopped right back into the breakout zone around 5050 and just refused to breakdown after the close.

I mean, if I was right we should have dropped 20+ points after the bell rang and should be opening up the next morning with a nice gap down. But instead we started grinding higher afterwards and continued all night, so I that point I knew I was wrong and something else is in play. Back to the drawing board I went and below is what I discovered.

One of the big things I covered earlier this week (and last week) was that the market should reach the 61.8% retracement level before another big leg down. And when we were going down in the large A wave I thought it would bottom at the FP on the SPY (around 4880 ES) and then we would rally up to that 61.8% retracement level (about 5162 roughly... if it was going to play out, but it didn't).

Instead we bottomed early at 4963 and then ran up about 50% and stopped. From there we started down, which was that big drop on Tuesday (my small wave 1 to 2 move), and I thought that we would be continuing lower after the FOMC meeting yesterday to hit the FP and then we'd rally up to the 61.8% level.

But you see if it happened like that then we should go down lower again to 4600, 4400 or even 4000 as the large A down would have been just one big move straight to the FP, but that didn't happen. Instead we are going to get a complete ABC down to the FP, and that large C will end the entire correction and we will not go to any of those lower targets. Instead we'll start the multi-month rally up to 6000+ into the summer. This playing out like this make me confident that the FP is "the low" for the entire correction.

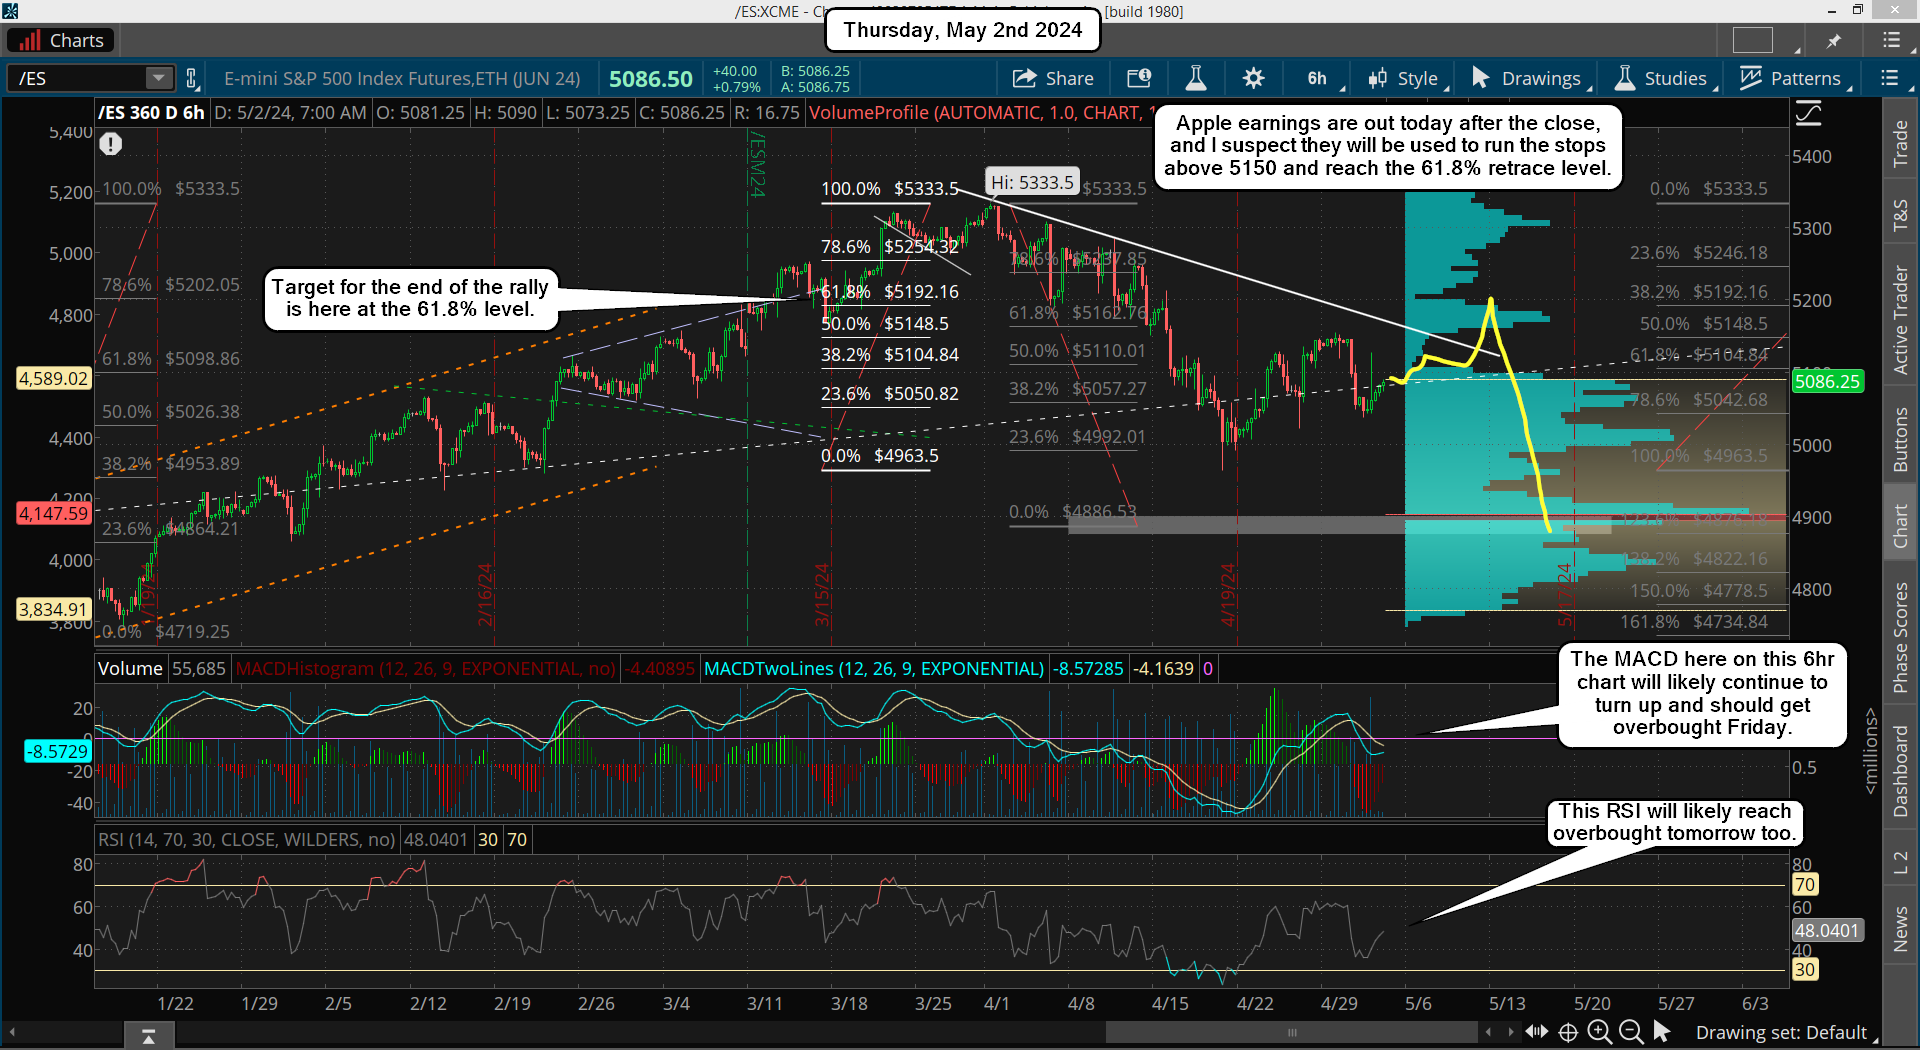
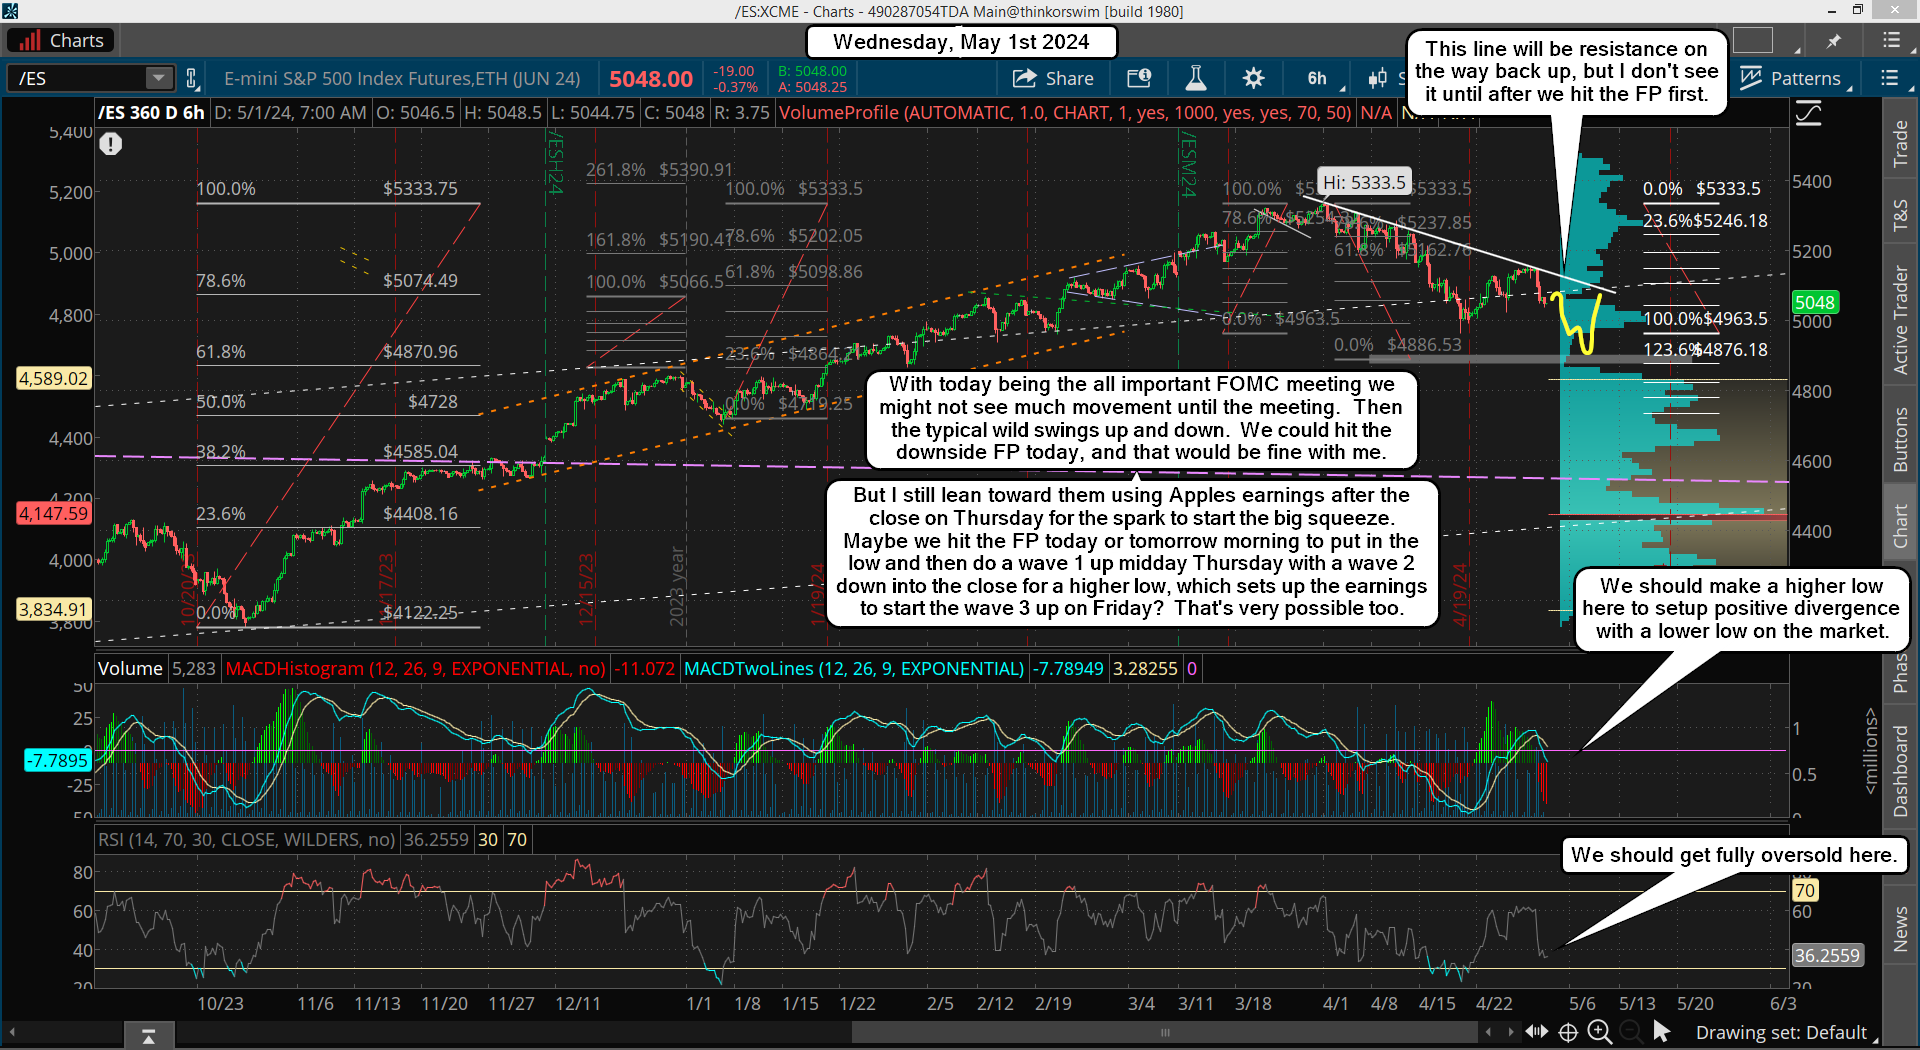
The only thing needed to confirm it is for the large B wave up to rally up to the 61.8% level, and I think that's going to happen into Friday. I think afterhours yesterday started a tiny Wave 3 up, inside small wave 3, inside medium wave C of large B. The upside target of 5187.50-5192.16 should be hit Friday, and I say that because I think they will use the earnings for Apple after the close today (4:30pm EST) to push through that falling white trendline and squeeze all the shorts out that have stops above the 5150 zone.

This will look super bullish to most but to me it's going to be the ideal short for the large C wave down that should end sometime next week. In fact, it could start on Friday and everyone will try to buy the pullback but it will likely keep dropping all day if it does start then. This is a super sneaky move, and one that I would not have figured out if I didn't go back to the drawing board and ask myself "what is missing"? The answer is the 61.8% retrace and the C=A point match... and the running of the stops over 5150. Get all of that done by Friday morning and this market is toast I think.

Have a blessed day.

ES Morning Update May 1st 2024

0

WOW! What a nice drop yesterday. As of the close we are only about 150 points away from the FP on the SPY now, so it could hit today after the FOMC meeting, who knows for sure? I'll be ready to go long after it's hit, whether that's today or tomorrow or Friday. Ideally we hit it today as then everyone will be super bearish calling for much lower prices, but since I have the FP I know it's a low and I'll be going long. The SPX target is 4851.50 for the 483.62 FP and 4845.99 for the 483.07 FP, so 30 points higher on the ES would be its target now it's that's the current spread between them.

It was about 36 points last week but it's getting closer as time goes forward and should be close to equal when the June contract for the ES expires and we roll into the September one. Anyway, my focus will be on the hitting and piercing of the FP on the SPY as that's when I'll look to exit my short and go long.

I suspect that Apples earnings at 4:30pm EST on Thursday will be used to turn the market back up and start the big rally. That's after the 4pm close, so I'm hoping that we will see the FP on the SPY hit right before so that bears will be trapped short at the close Thursday. Then Friday they can gap it up and squeeze them all day to recover a lot of the move down, which should continue into next week as well. The FP could be hit afterhours Thursday as well (this assumes it's not hit today), but that wouldn't make sense with my thoughts of them using Apples earnings to start a short squeeze as they will want to hit the FP prior to that coming out.

So that suggests they will hit it beforehand, as with only 30 minutes from the 4pm close to the 4:30pm earnings announcement that's not much time to hit it. Maybe it happens though, who knows for sure? If we are close to the FP going into the close Thursday then I'll look to exit my shorts and get long. I'd love to see it hit today though, but that might not happen. Anyway, that's my thoughts for what could play out. We'll see.

Have a blessed day.

ES Morning Update April 30th 2024

2

A nothing day yesterday as the market is in a "wait and see" mode it seems. Really not much to add here as the 50% retracement level has been hit and pierced so there's nothing left for upside in my opinion. Yes, there could be another squeeze to hit the 61.8% level, which would probably reach 65-70% before it finishes.

I say "could be" because of the FOMC meeting should have some wild swings from it, which is common really with most meetings. And we have Amazon earnings today as well as Apple on Thursday, so there's lots of "events" that could cause another squeeze. There is also the common pattern of a "turn" happening around the end of the month, which could happen at the end of any month or the start of the next month.

We are right in that window now of time, so even if we get another pop higher this market should rollover and start a pullback that should last into next Monday at least. Last Thursday I posted this chart, and it could still play out.

But... if we reach 61.8%+ (5192+) before we make that turn then I have to think the top is in for this rally and that we'll be going down to the FP on the SPY next. That means we should not go back up into OPEX for a higher high, but a lower one. That's if they don't just just flush it down for 3-4 days quickly to end it this week or by early next week, which is very possible as we are only around 260 points or so from the FP, and that could easily be hit in just a few days.

Yes, they can just do a small dip for a wave 1 as shown on that chart and then chop into OPEX and finally drop for the last move. And that kind of move would suck as it will be so hard to trade and very boring. We have already had a choppy move down for the A wave shown so it doesn't normally repeat the same pattern. Typically near the end of a move there is a final capitulation drop, so I'm still leaning toward that happening. They certainly don't make it easy, that's for sure. That's all I have for now. We'll see how it plays out.

Have a blessed day.

ES Morning Update April 29th 2024

0

We got the rally to the 50% retracement that I was looking for on Friday by coming just 2 points shy of 5148, so that's a hit in my book. This week tells all for the bull or bear case I think as we are still in a bigger term bull market but the correction should not be over with just yet.

At least that's "if" the FP on the SPY of 483 is a real one and I think it is. In fact it was put out twice, once on March 1st for 483.07 and again on April 11th showing 483.62, so I have to think they are real and will be hit before the bull market resumes it's next big leg up. This week is when that FP should be hit as we have the FOMC meeting that can be used as an "event" to blame it on. We all know that the market loves to use "events" to trigger big moves, of which many are traps. I tend to think this one will be a trap as well.

I don't think we are going to rally up into the meeting but instead I think we pullback into it but save the hitting of the FP until right after the meeting. It will be a great way to scare the bulls out and trap the bears with a fast drop to the FP, which then bottoms and turns back up just as fast.

There won't be any bulls on board and bears will be shorting the crap out of it, which will be the fuel needed for a big squeeze to start from. I would not be shocked to see us pullback to around 5000 on the ES going into the meeting, and then flush down 100+ point to hit the FP (around 4880 on the ES roughly).

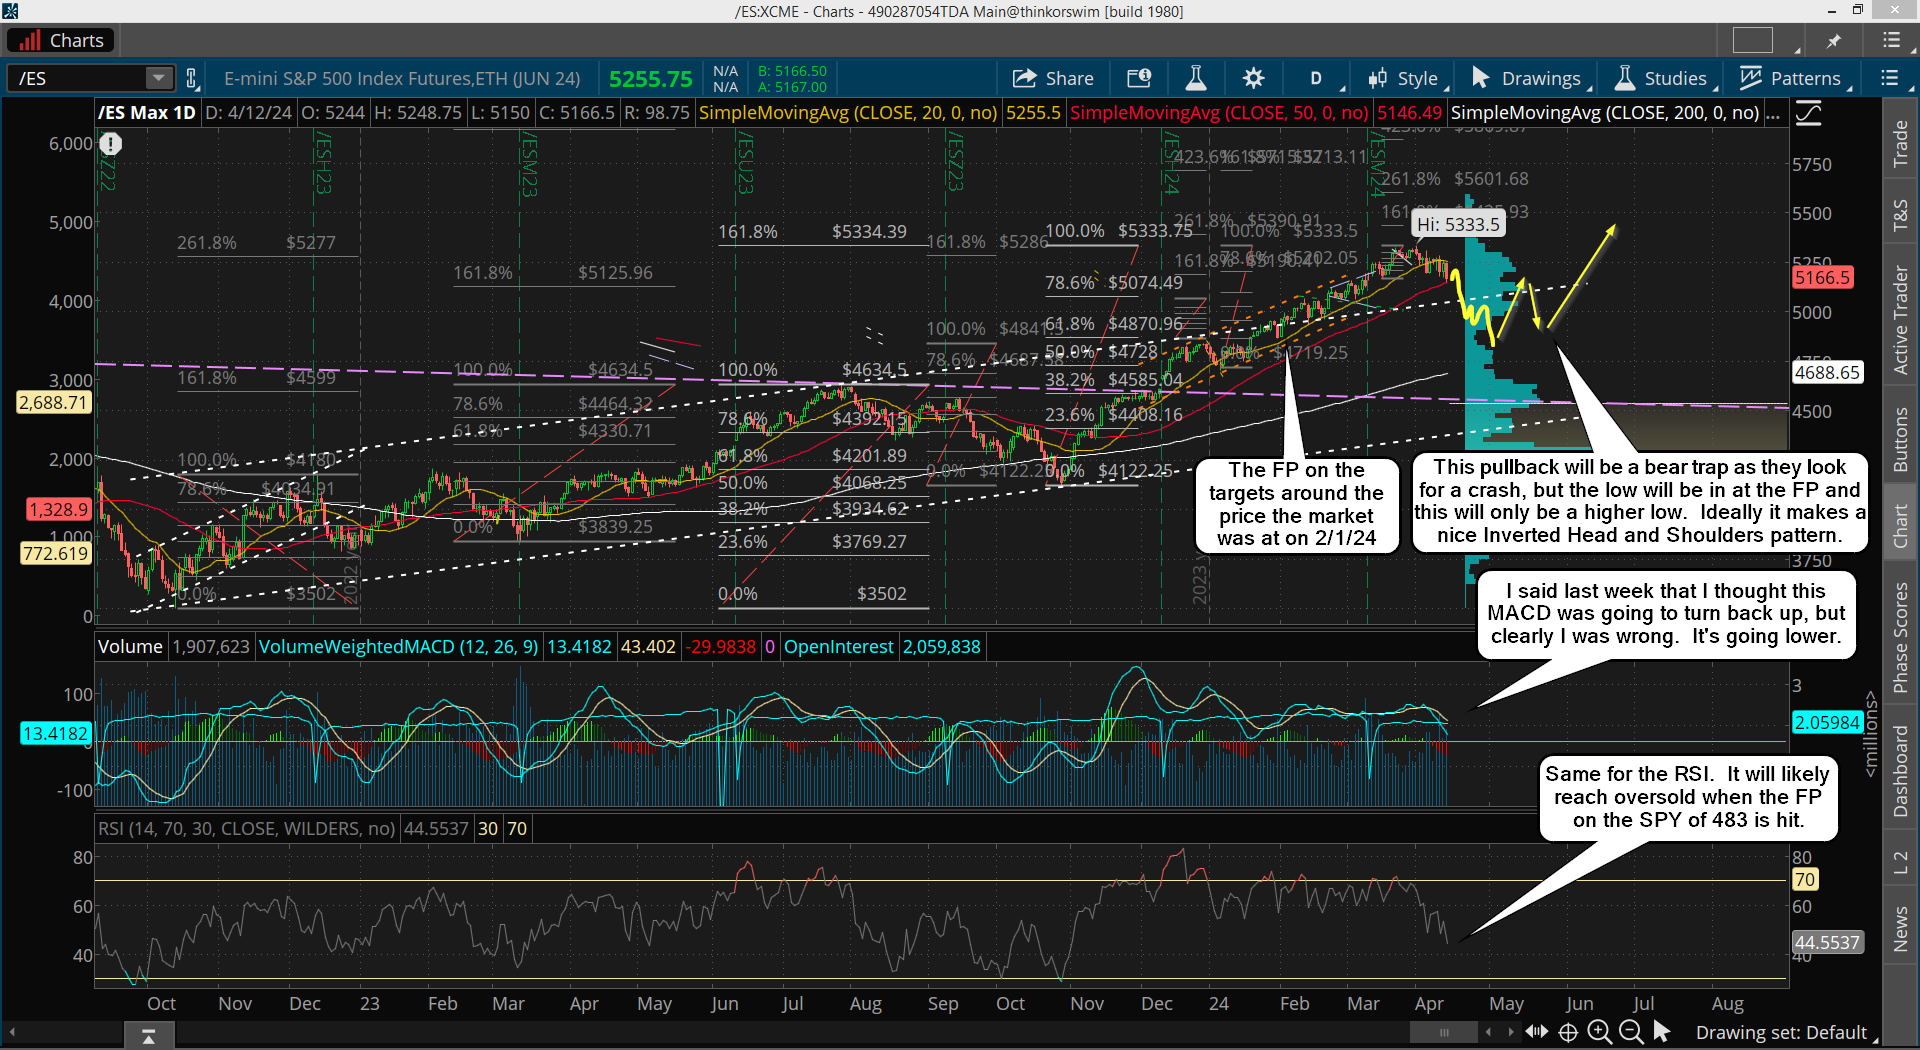
And then a full reversal back up to above 5000 by the close, with 5100+ possible by the end of the week. This is my dream scenario and one that would trick the most traders I think. The FP low would be the Head in a likely "Inverted Head and Shoulders" pattern that I still think will form. After the squeeze is finish, which could last for a week plus, there should be a pullback for a higher low to make the right shoulder as the left shoulder is the current low from 4/19 at 4963.50, and might take all of May to unfold.

The correction in December of last year to January formed a nice inverted head and shoulders, and I think this current correction can form another one. All just speculation at this point, but certainly possible. Now if a new FP comes out, which shows a lower low then the current 483 ones, then that right shoulder won't be accurate and we'll just drop to the new FP I guess. But right now I'm only looking for a higher low on that last pullback, and then the bull market to resume.

For the short term, pretty simple really, I'm looking for a pullback into the FOMC starting today, and that's even if we go a little higher first. It changes nothing as this rally up from the bottom is still just a bounce in a correction that isn't over with in my opinion, and won't be until the downside FP on the SPY is hit. If for any reason it is not hit this week then I don't think we'll see it hit until the last week of May.

Have a blessed day.

ES Morning Update April 26th 2024

3

The Typical Scenario...

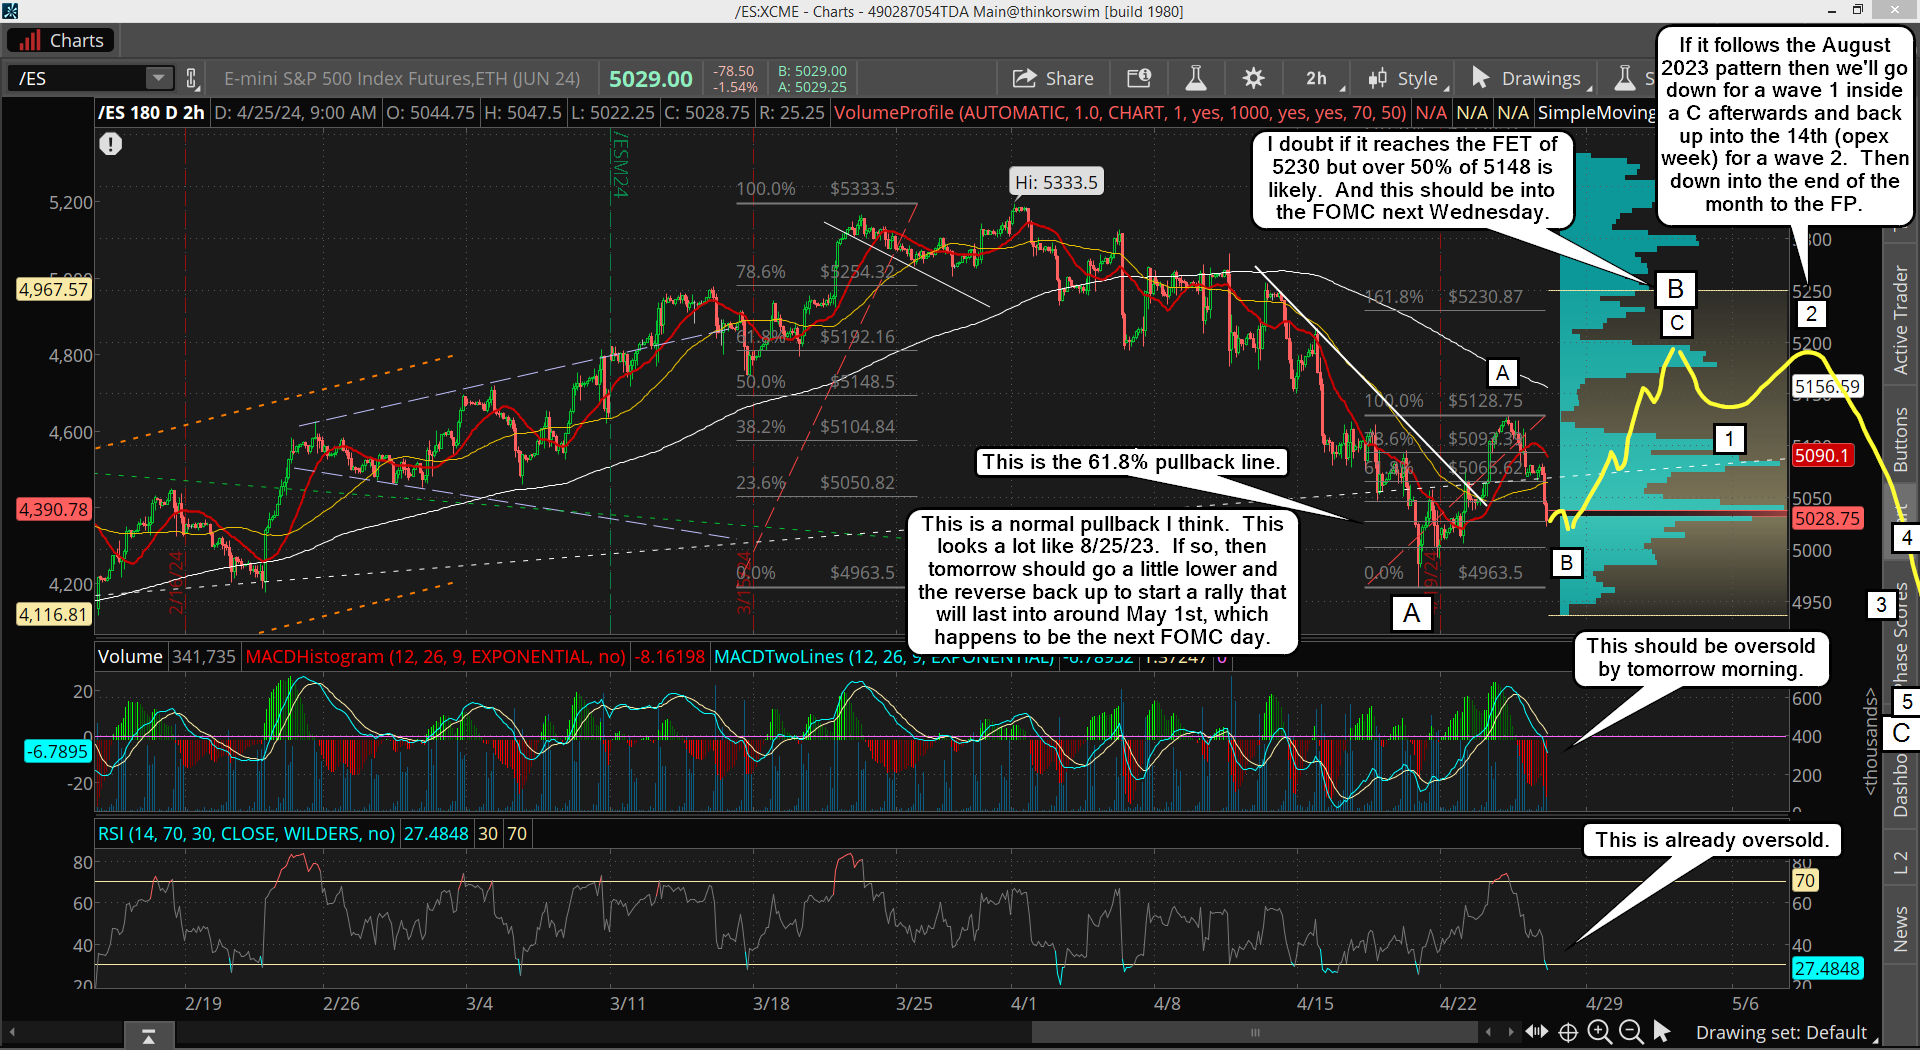
No time was wasted yesterday as it put in the bottom for my smaller B wave, which I thought might carry into today where the final low would be but it didn't take that long and just turned back up and grinded higher the rest of the day with a big squeeze after the close. We are clearly in the C wave up now, inside a bigger B wave. The chart below was posted in the chatroom yesterday and it's playing out nicely.

I thought we would only go up about half of the down move and then pull back one last time today for a higher lower (or slightly lower low) but that part was completely wrong as we just took out the 5128 high of the smaller A wave in the afterhours session.

I'm sure that the smaller C wave will unfold in 5 waves but I'm not sure where we are in it right now. The afterhours squeeze sure felt like a wave 3 of some degree, and there was a pullback around 2:00-2:30 pm EST yesterday, which could have been a wave 2? It's hard to figure out the smaller waves but it's clear that we are inside the smaller C wave up in the bigger B wave.

I think it will end between 5192.16 to 5230.87 going into next Wednesdays FOMC meeting. Then I think we drop for the bigger C wave over the following several weeks. It could end up being a fast drop, but it could also drag out in time and last into the end of the month. Yes, that would stink as it's very hard to trade when it has so many up's and down's, which is exactly what the bigger A wave had. It drove me nuts in the beginning with all the fast one day drops that got reversed back up hard the next day. Hopefully the bigger C wave won't do that and will just drop non-stop with next to nothing for bounces and hit the FP on the SPY within the typical 8-10 days that these patterns commonly play out with.

As for today, it's a Friday so I'd expect it to close green. There could be some kind of pullback today but usually they hold the market up and go sideways after doing powerful squeeze like they did after the close yesterday. Then Monday and Tuesday should be choppy too as the market waits on the FOMC. Somewhere in there we'll see the wave 4 down and then the wave 5 up into Wednesday ideally.


The Wild Card Scenario...

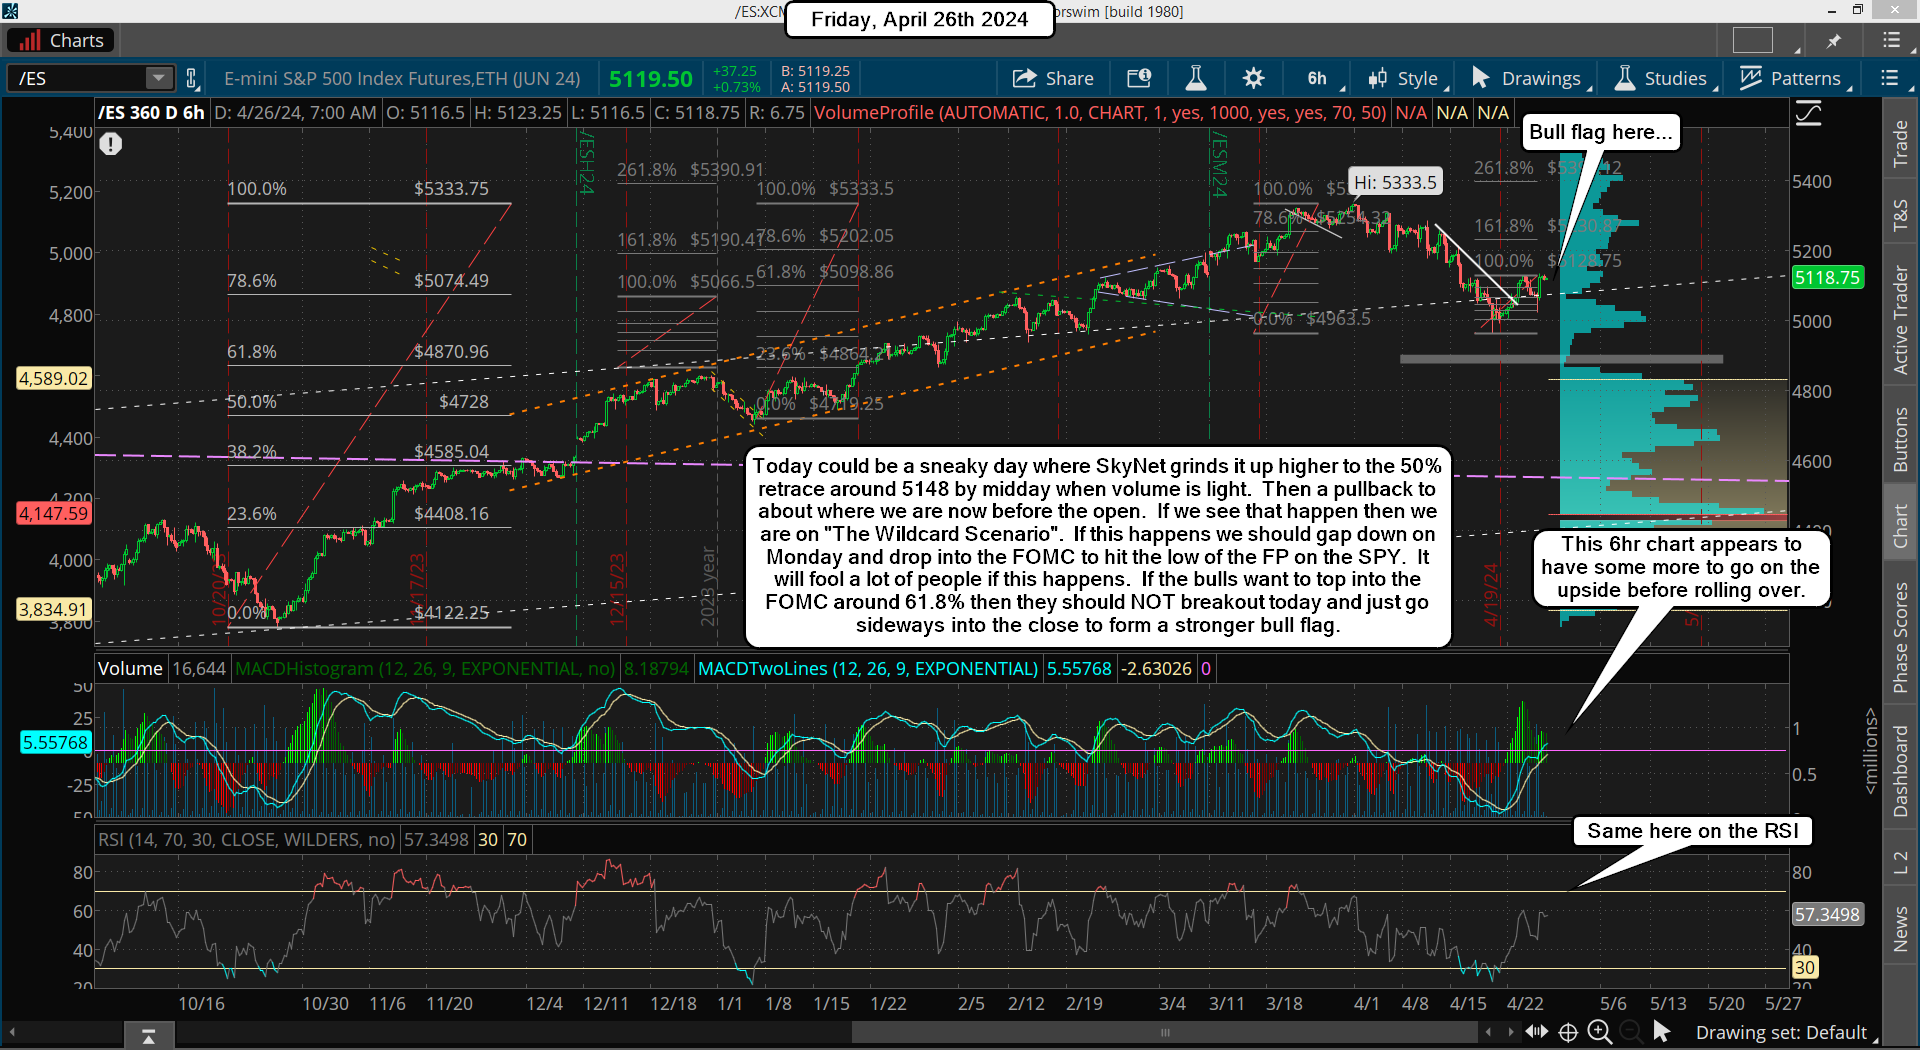
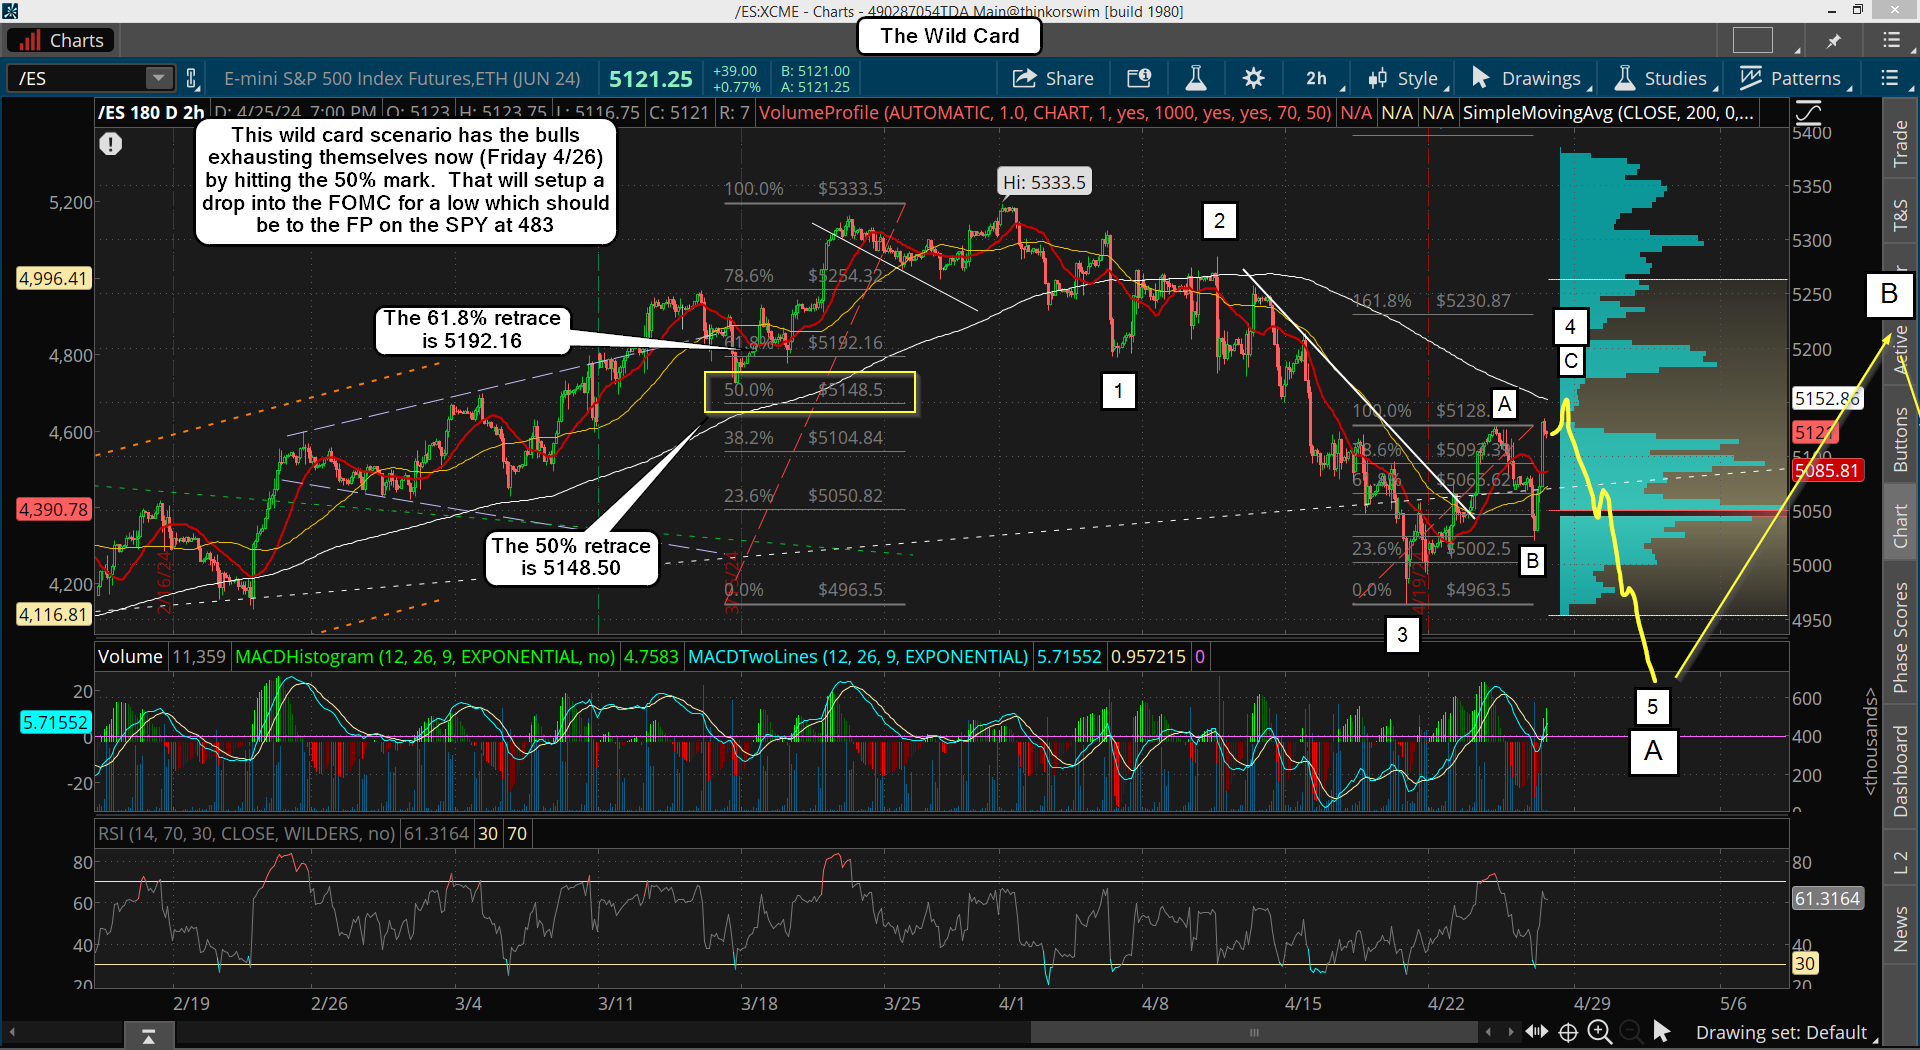
I give this equal odds of playing out.  We have got really close to the 50% retrace from the bottom compared to the all time high, which is 5148.50, and we are super close to it now.  If it's hit today I will have to short it and look for the drop the FP to happen into the FOMC next week to put in a low, not a high.

Bulls do NOT want to see this happen if they plan on going up to 61.8%+ into next week.  Bulls will want to go sideways to build a base after such a strong move up.  That means they will want to just hold this zone today and NOT rally up to the 50% retrace zone today, as if they do that then the 61.8%+ is likely off the table.

It means the entire rally up from the 4963.50 low is just a wave 4 and that we'll have that last move down to the FP on the SPY afterwards, which will be the 5th wave of course, and should bottom into the FOMC next week.

If we see a rally up to the 5148.50 level I will get bearish and will short it looking again for my FP on the SPY of 483 to be hit next week, and likely right into the FOMC meeting.

In conclusion...

The market is either going up to 61.8%+ into the FOMC, which would require today to be a "rest day" where the market does NOT go up much higher, and stays under the 50% retrace level... or the market will exhaust itself with a last squeeze up to the 50% retrace level today, which will kill the 61.8% target and result in a drop to the FP into the FOMC instead of a high.

Have a great weekend.

ES Morning Update April 25th 2024

0

As expected we had a pause day yesterday being up part of the day and down part of the day, but closing about flat. Then afterhours we dropped more, which is making a nice inverted head and shoulders pattern as shown below on the 2hr chart.

Using my FET system it projects a high of 5230.57, which is higher then the 50% retrace I was looking for, but it's something to keep in the back of my mind as possible. It would be around a 70% retrace of the down move from the top if it happens. I'll just be looking at the technicals and the typical turn zones, which is around the end of this month.

We have the GDP numbers and Jobless Claims out this morning, so a nice move up or down should happen.  From a technical point of view we should go up, but we could drop hard too.  I don't think it's going to happen anything is possible.  I know at some point we are going down to hit the FP on the SPY, but I lean toward more upside first.

Next Wednesday is May the 1st and we have another FOMC meeting, so if we can rally up into it then I think we could top out and drop hard after it.  Most of the time FOMC meetings are non-events that commonly have the following Thursday and Friday going up some.  Then the following week the market can pullback if the technicals are overbought, or rally if still bullish.

My point is that they are usually bullish when all the dust settles.  It's about time for a shock I think.  The weekly chart is still putting downward pressure on the market and a rally up into the meeting will get all the short term charts overbought, and the daily will have come back up from oversold, so it can roll back down again.

These technicals suggest another move down is coming, and I have the FP too.  Seasonality is usually weak in May as well, so there's lots of reasons to think that this coming meeting could shock the market.

Have a blessed day.

ES Morning Update April 24th 2024

2

Yesterday rally has likely killed my wave count. The resistance was busted through, and now we appear to be getting the 50% rally up that I thought we wouldn't see until after we hit the FP on the SPY. This changes everything I think as now we will likely put in a low at the FP into early May and that will be "the low" for this correction.

I had previously thought that we would rally up 50% from the FP and then go back down to 4600, 4400, or even 4000, but those odds are super low now. We would have to rollover today and drop hard to the FP into this Friday, which then could bring those lower targets back in play, but that's the only way I see it possible. I posted the chart below yesterday in the chatroom, and it's what I think will play out now.

The top for this rally could end by next Monday or Tuesday, and then the drop to the FP should follow and bottom within 7-9 days (love to see it happen in 5-7 though). For the short term we are getting extended, so a pullback of 30-40 points could come at anytime. Here's a chart I posted yesterday showing it.

This is disappointing but we must remember that we are still in a bull market, so I really shouldn't be surprised. This will end up being about an 8% pullback from the top in an ABC pattern if my thoughts on the charts on this post are accurate. We shall see.

Have a blessed day.

ES Morning Update April 23rd 2024

2

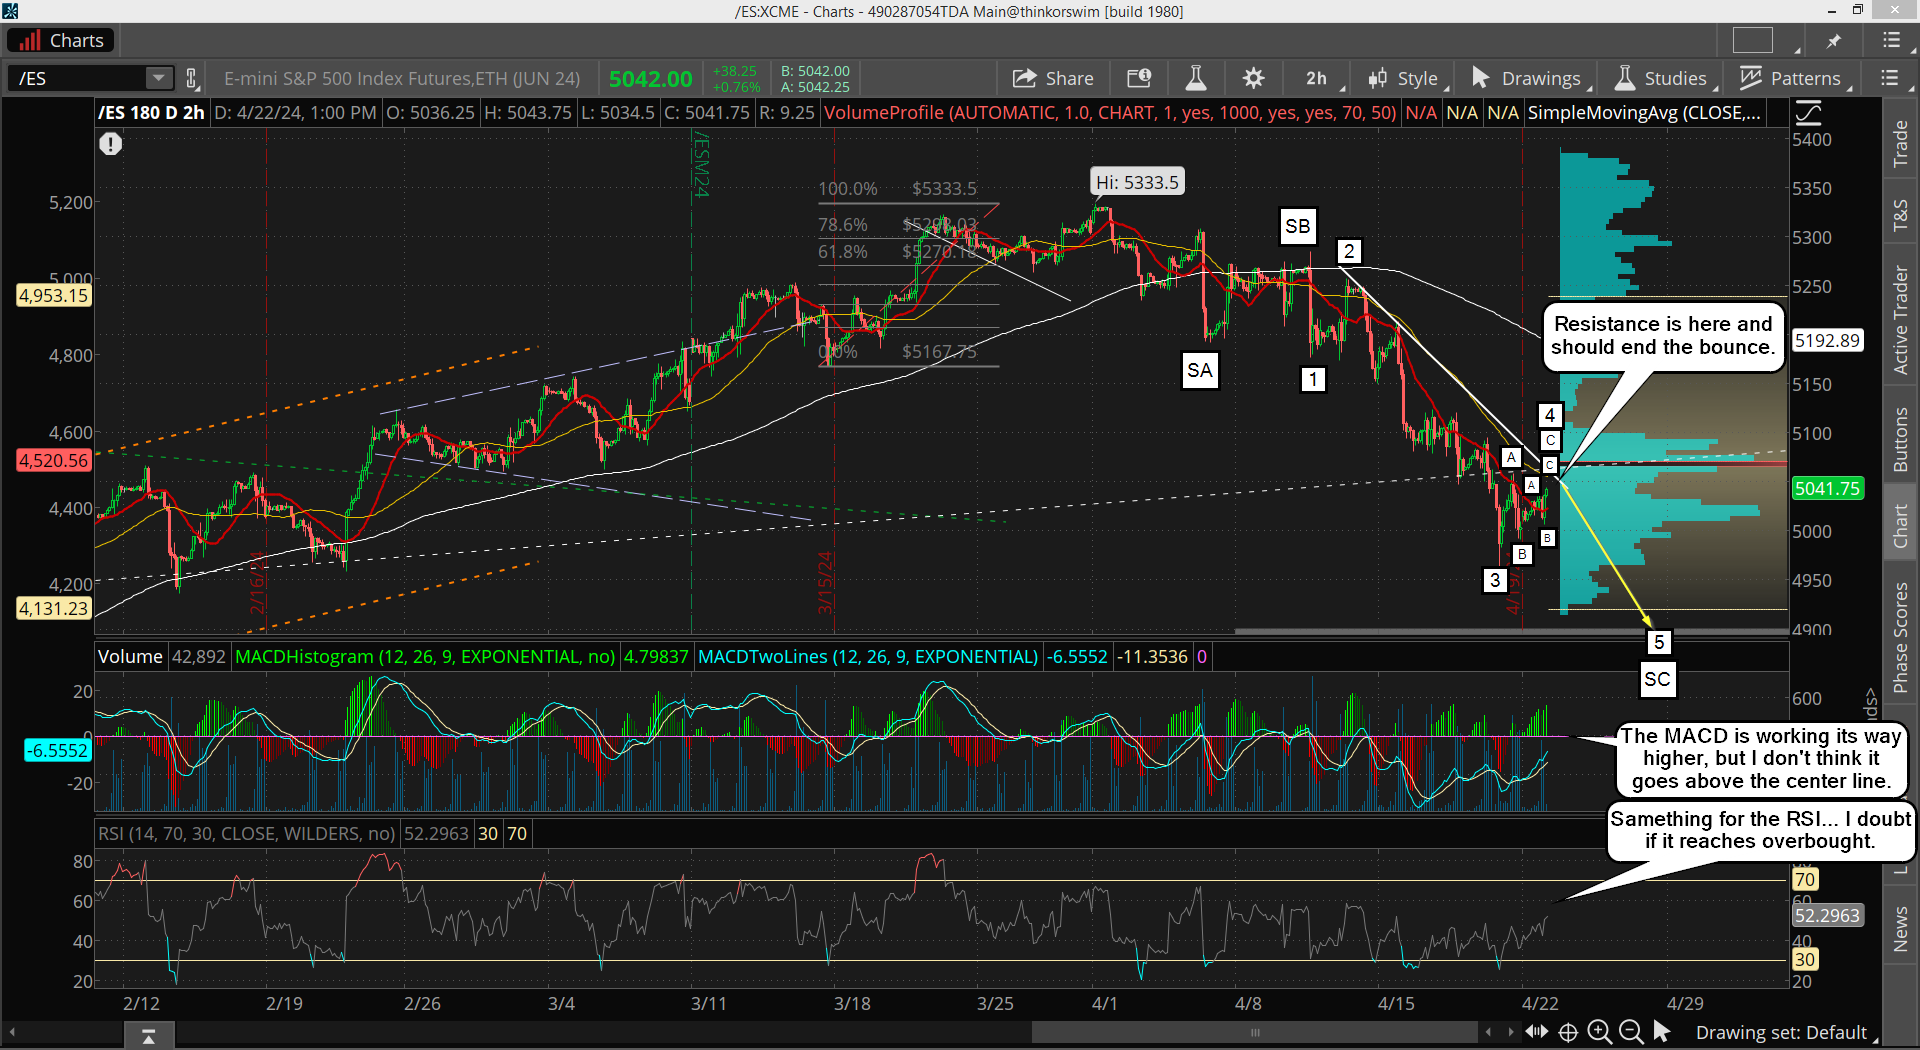
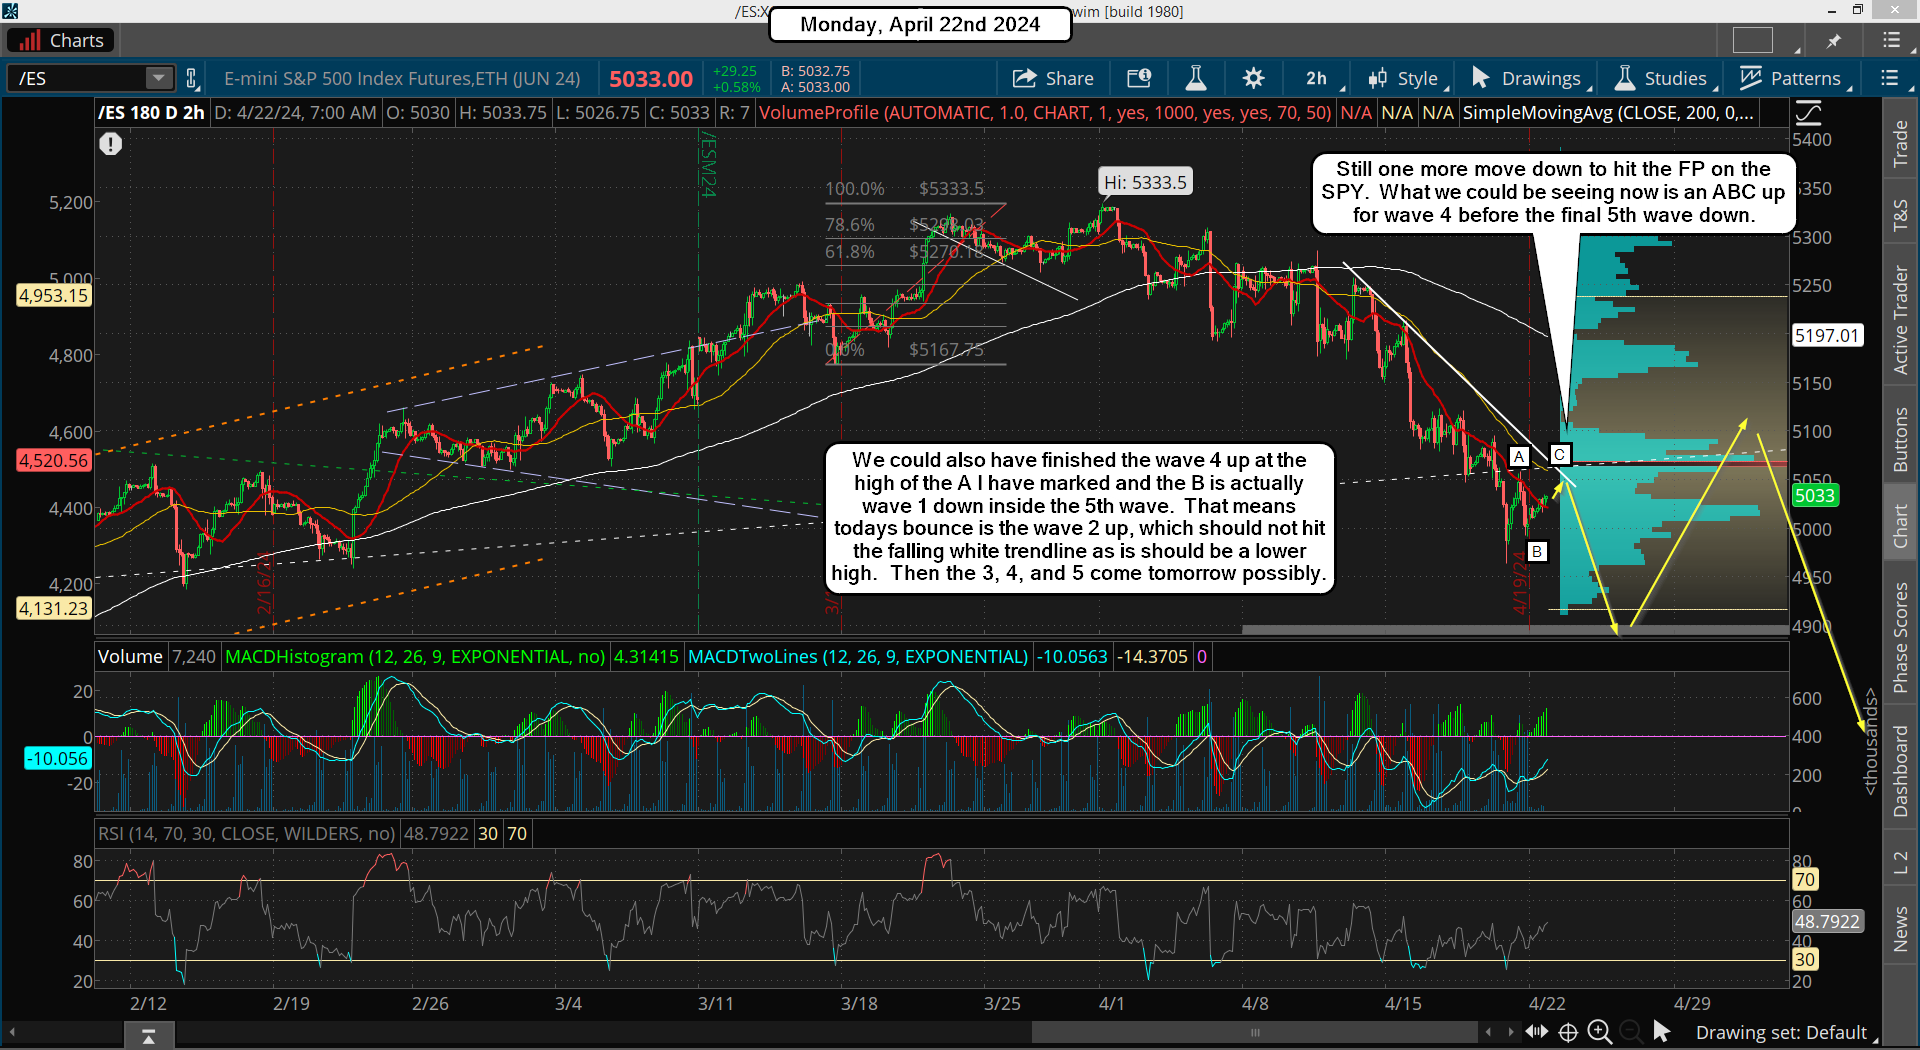
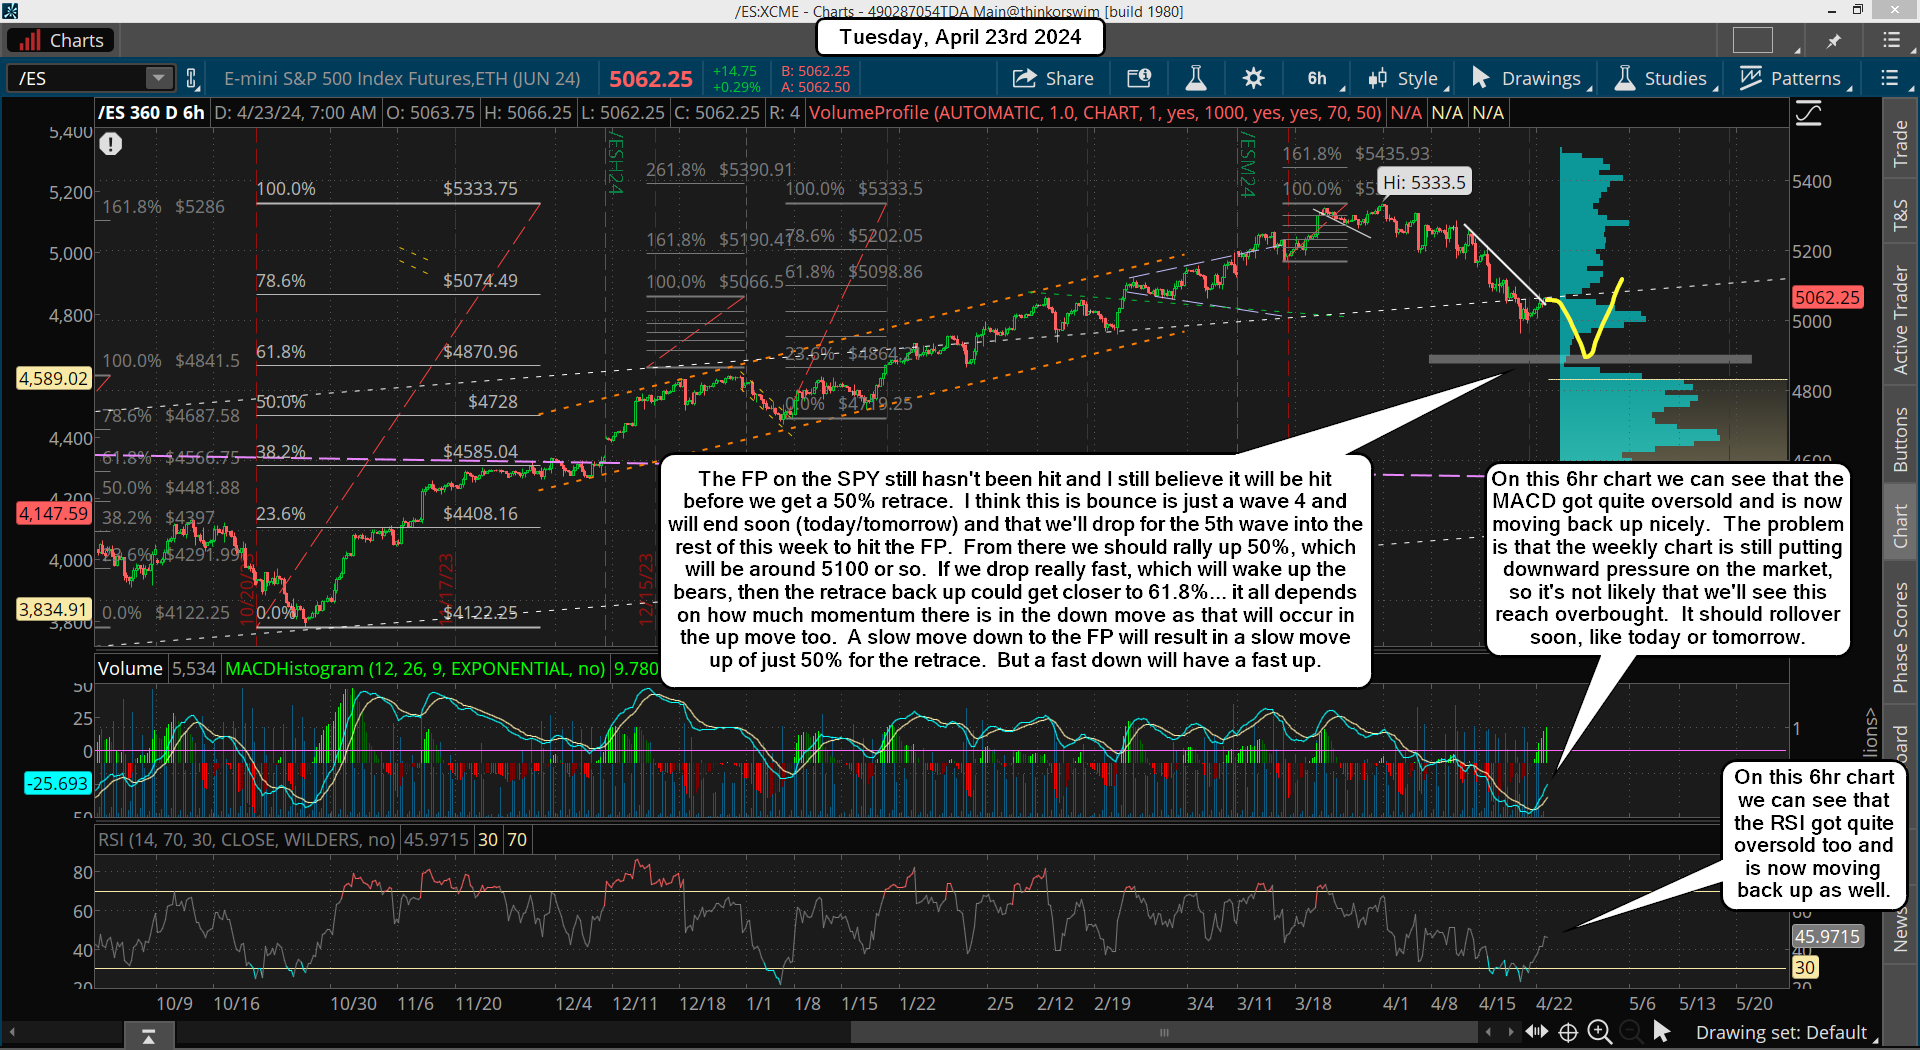
We didn't get that last drop yesterday as the market was too oversold short term it seems. A nice bounce happened instead, which could last one more day I think, but it's close to over with. It's a wave 4 up I believe, and here's a chart I posted in the chatroom yesterday showing it. Afterwards we did go up and pierce through the falling white trendline but the market couldn't hold it and closed below it yesterday.

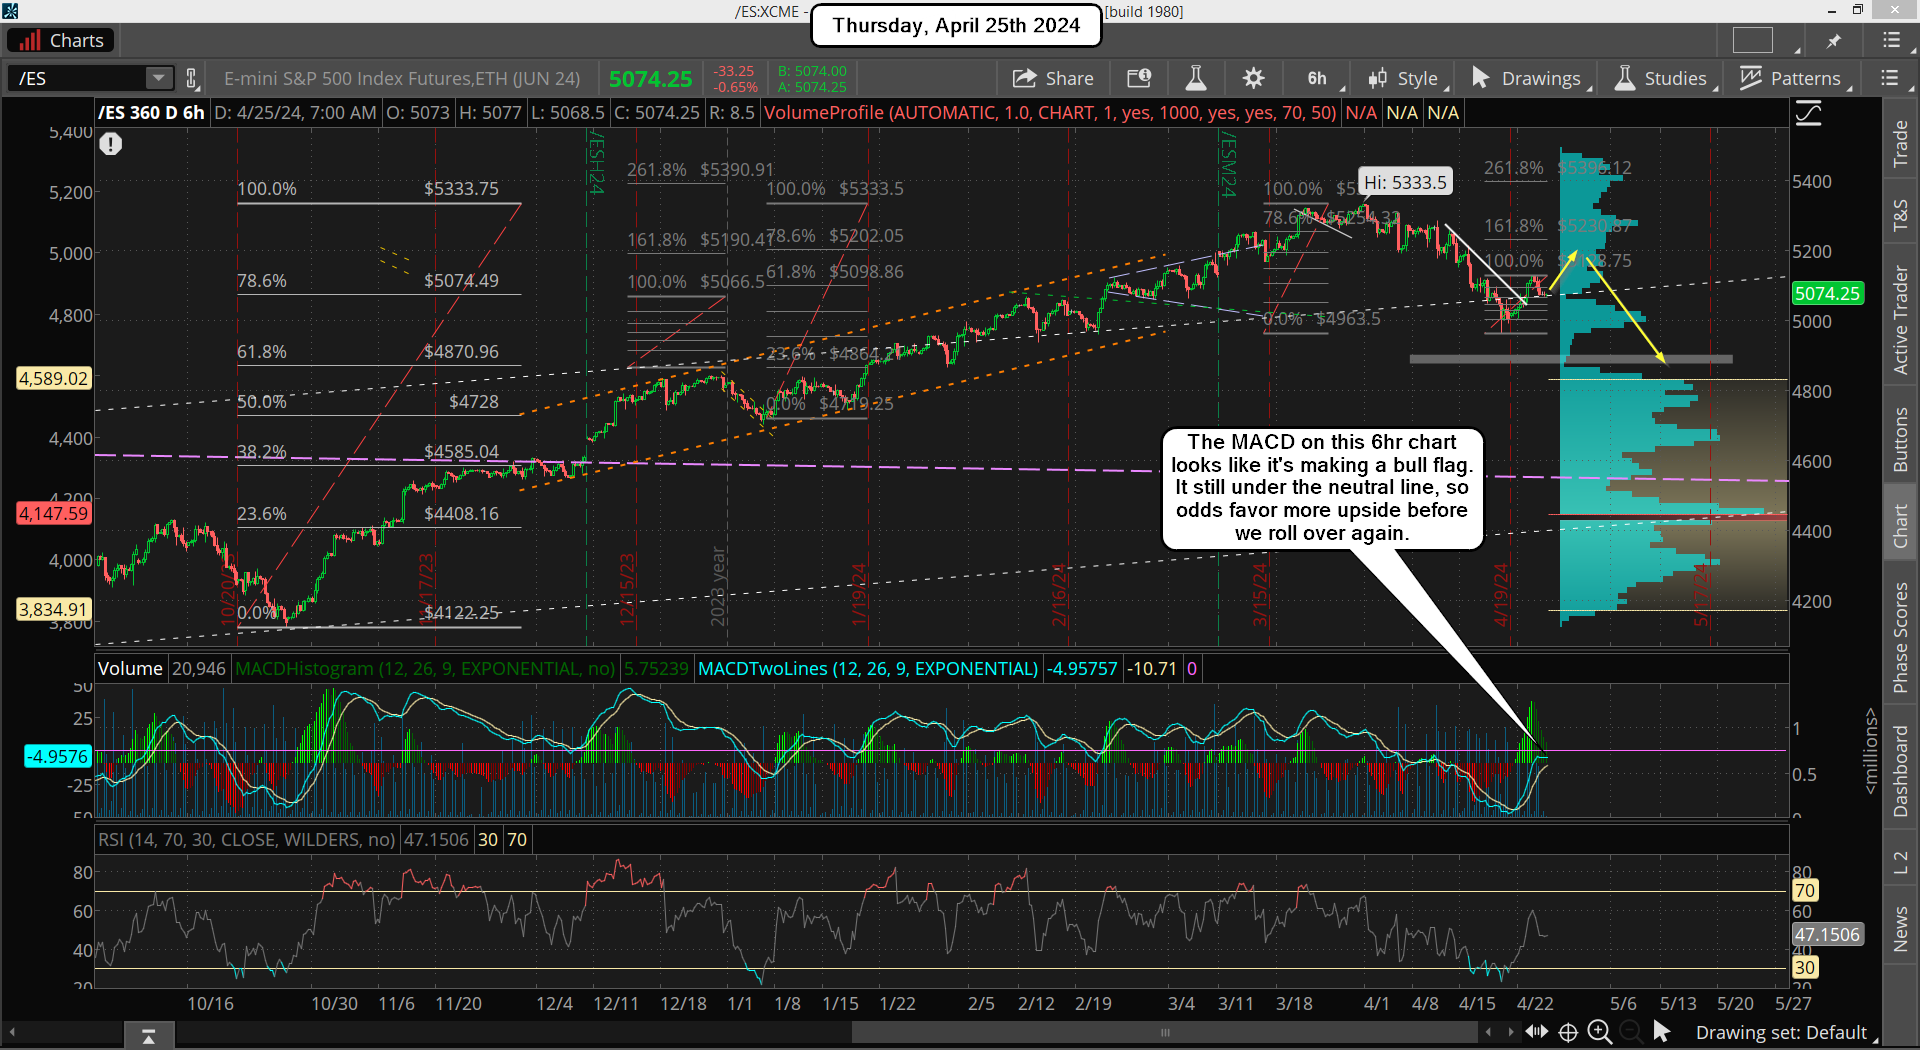
Now that was the 2hr chart, which was getting extending yesterday for sure, so there's limited upside on it. But the 6hr chart says we can go a little higher on it before we top out for the wave 4 up. Whether that happens or not the market is still missing the last move down to hit the FP on the SPY, and I'll be looking to exit my short there and go long. Nothing more to really add. I'm just being patience.

Have a blessed day.

ES Morning Update April 22nd 2024

1

The market continues lower as we get closer and closer to the FP on the SPY. Last Thursday had a nice drop in the futures but was fully recovered by the open on Friday. However, it never held as as the market rolled back over the rest of the day. This week (possibly today or Tuesday) we should see the FP hit, and that's where I think we get a 50% retrace back up, and should complete by the end of this week or early next week.

From there is where it gets tricky as while I do think we will roll back over and go down again I just don't know how much. Will be be a higher low, meaning the move up from the FP is a wave 1 of some degree and the pullback is a wave 2?

Or will it be a lower low, meaning the drop from the all time high to the FP is just an A wave and the bounce of 50% is a B wave, so the drop after that would be a C wave. I don't know the answer but looking at the technicals on the weekly chart I'd have to lean toward the ABC as it's quite bearish, so I don't see the market just resuming the non-stop rally yet.
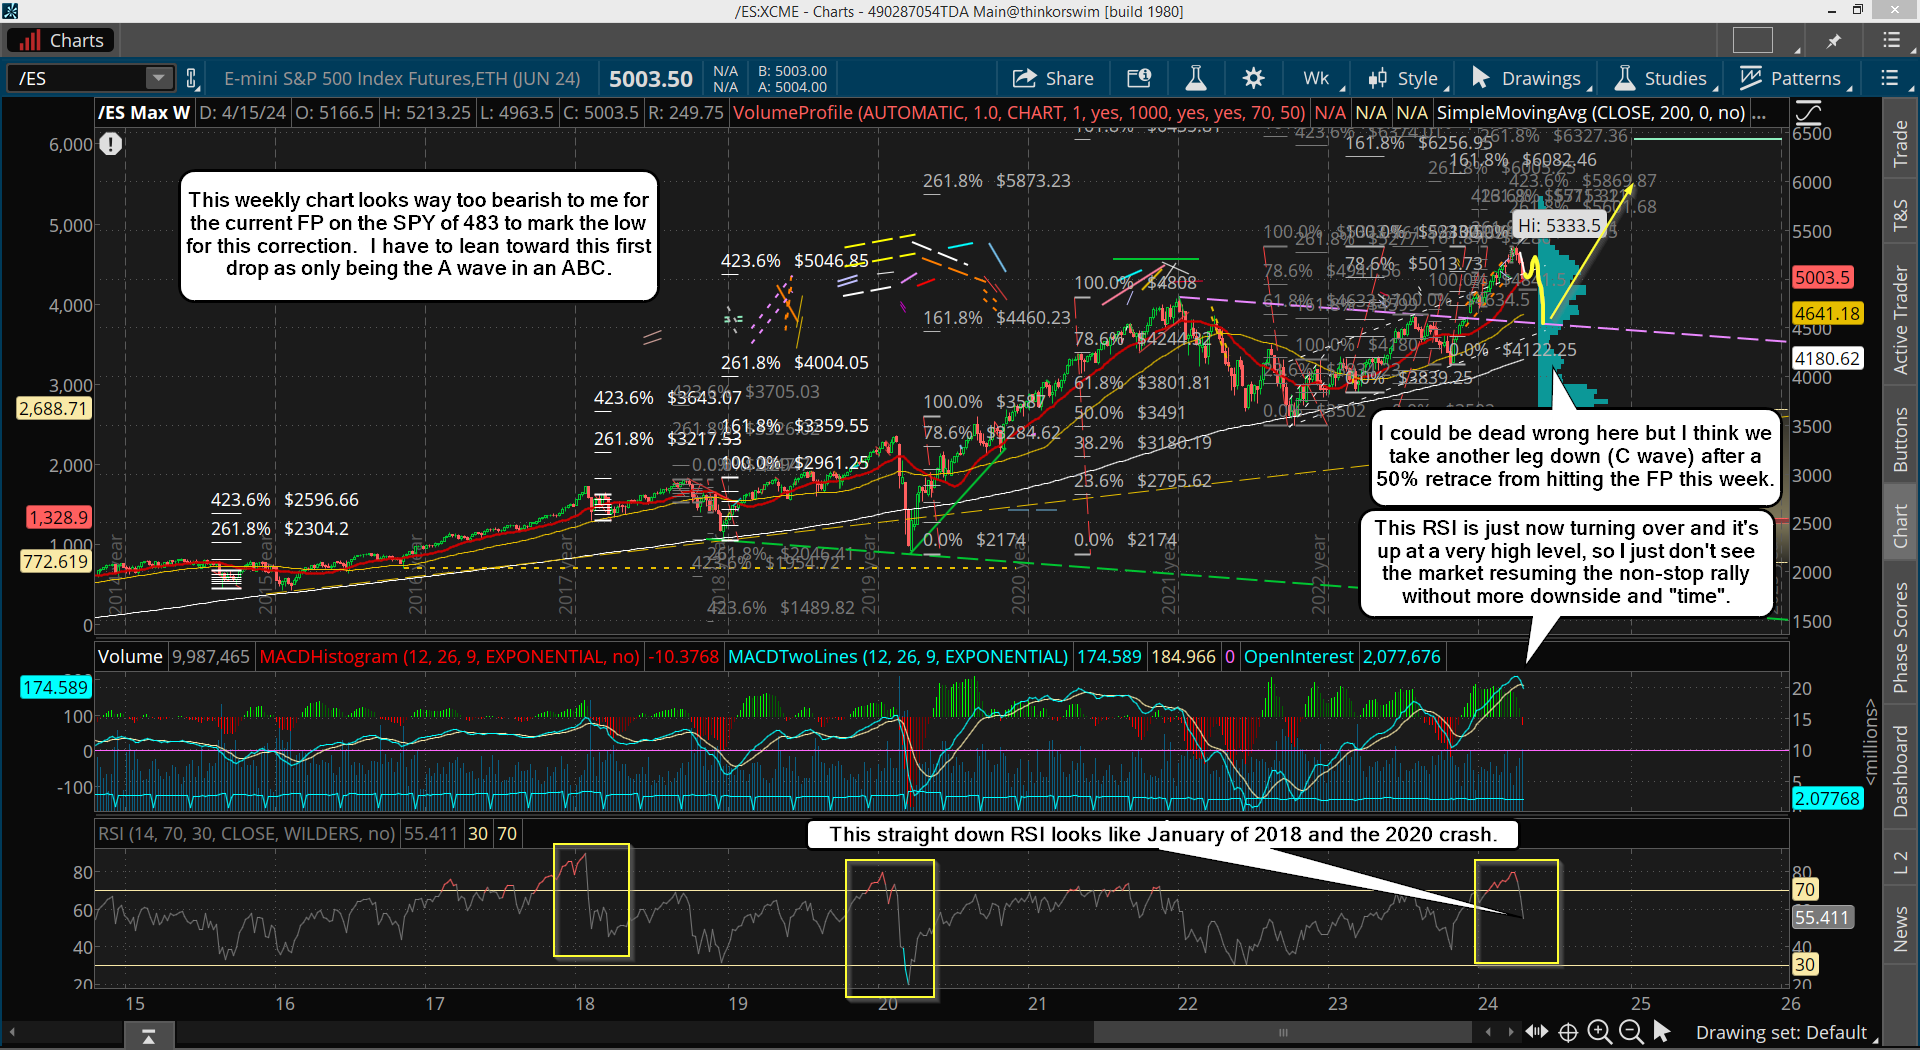
More time is needed to allow the weekly chart to reset as it will need to turn back up and support the daily chart to get that day after day grind going again. Yes, the daily is almost oversold and will turn back up after the FP on the SPY is hit, but the weekly is more powerful and will keep downward pressure on the daily, so rallies will not "stick" in my opinion.

My best guess is that the weekly chart will need 3-4 more weeks of "time" to get it deep enough to bottom and turn back up. Basically the first, second, or possibly the third week of May should about finish it. Of course if the price is deep enough then we could be finished in the first week, but if price isn't that deep then it might last into the third week.

For example, if we dropped to 4000 then it should finish in the first week, but if we only drop to 4800 then I'd say the third week would be needed. This is on the second leg down of course, which will be the C wave. The 4800 zone will be support as the high in 2022 was 4808 on the ES (4818 SPX), so if the market wants to stop there then I'd have to think there will be a lot of up's and down's from that zone before we get going back up strongly in a real rally... meaning late May to early June before it starts.

But if we drop to the 200 week moving average at just under 4200 then the weekly chart will be quite oversold and the correction will end sooner, as well as the rally back up from it will be faster and more powerful. Again, I don't know the target low but when I reverse my Fibonacci Extension Target system to forecast a downside projection it points to roughly the 4600 zone on the ES and SPX, but I've not used it for downside targets so I don't know if that will be accurate or not?

Another important support will be from a rising trendline that connects the 2020 low, with the 2022 low, and the 2023 low, which is in the 4370-4400 zone (depends on when it's hit). This all assumes of course that we will decline in a C wave after the bounce back up from hitting the FP on the SPY. If that low turns out to be the bottom then these targets are worthless as then we'll be off to the races again to 6000+ in the coming many months.

But let's assume I'm right and we do get another drop lower in a C wave, and let's look as something else that is interesting. The low of 2174 (ES) in 2020 to the high of 4808 in 2022 was followed by a pullback into late 2022 that bottomed at 3502. Now, from the 4808 to the 2174 low the 50% retrace level was 3491, so that 3502 level was basically a 50% retrace of the entire rally up from 2020 to early 2022.
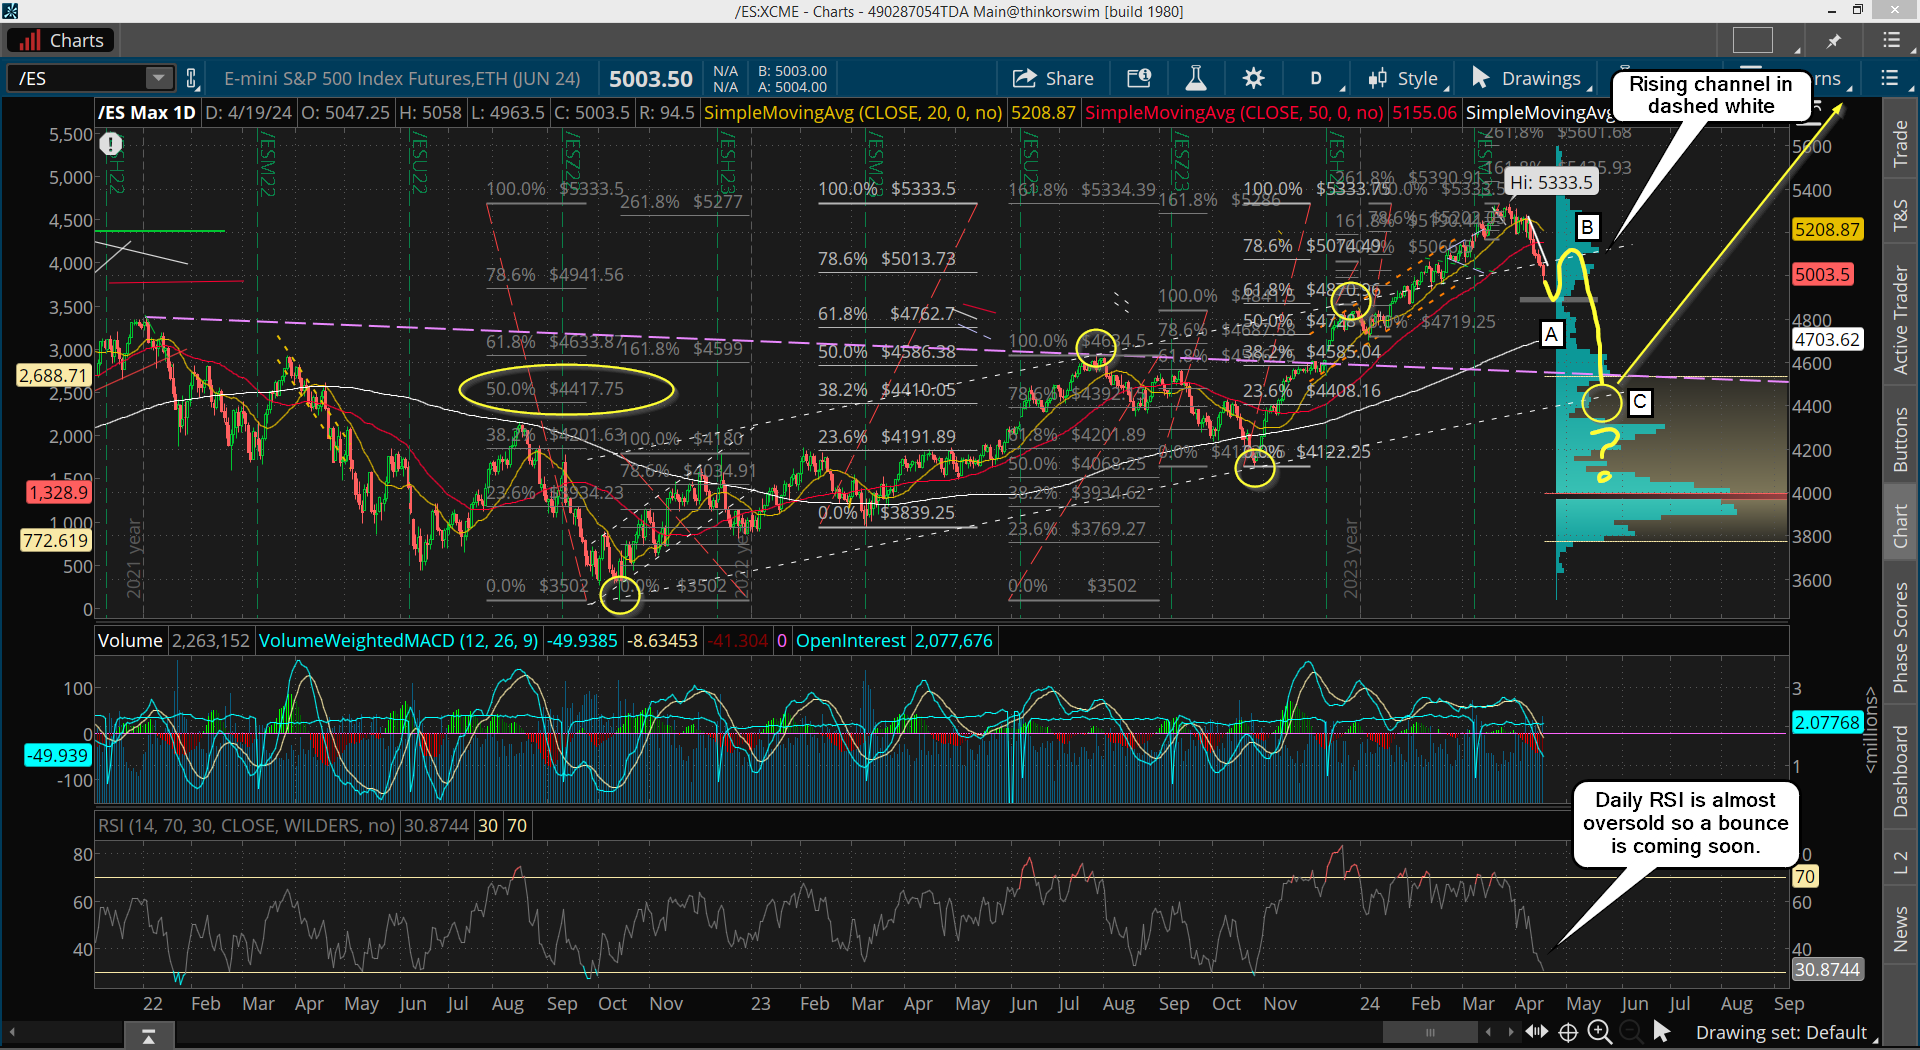
Well, if we take the 3502 low up to the current 5333 high, and do a retrace of 50%, where does that point too? It points to 4417 (ES), so if we repeat the past that could be our downside target. It would also hit (and pierce) a rising trendline that forms a channel.

It's created from the 3502 low and the 10/26/23 low of 4122 and shown on my charts in dashed white. So that is certainly an important level to pay attention to. As far as "time" I have to think that if we start dropping hard and fast for the coming C wave the low could be in by the first week of May, or into part of the second week.

It's just something that will have to be monitored along the way and adapted to.  The strength or weakness of the next drop will determine the "time" part, and possibly the price target to?

For now though let's just see the FP on the SPY hit first so I can exit my short and go long for the 50% bounce.  After that I'll just re-evaluate and adjust to whatever the market throws at me.

Have a blessed day.

ES Morning Update April 19th 2024

4

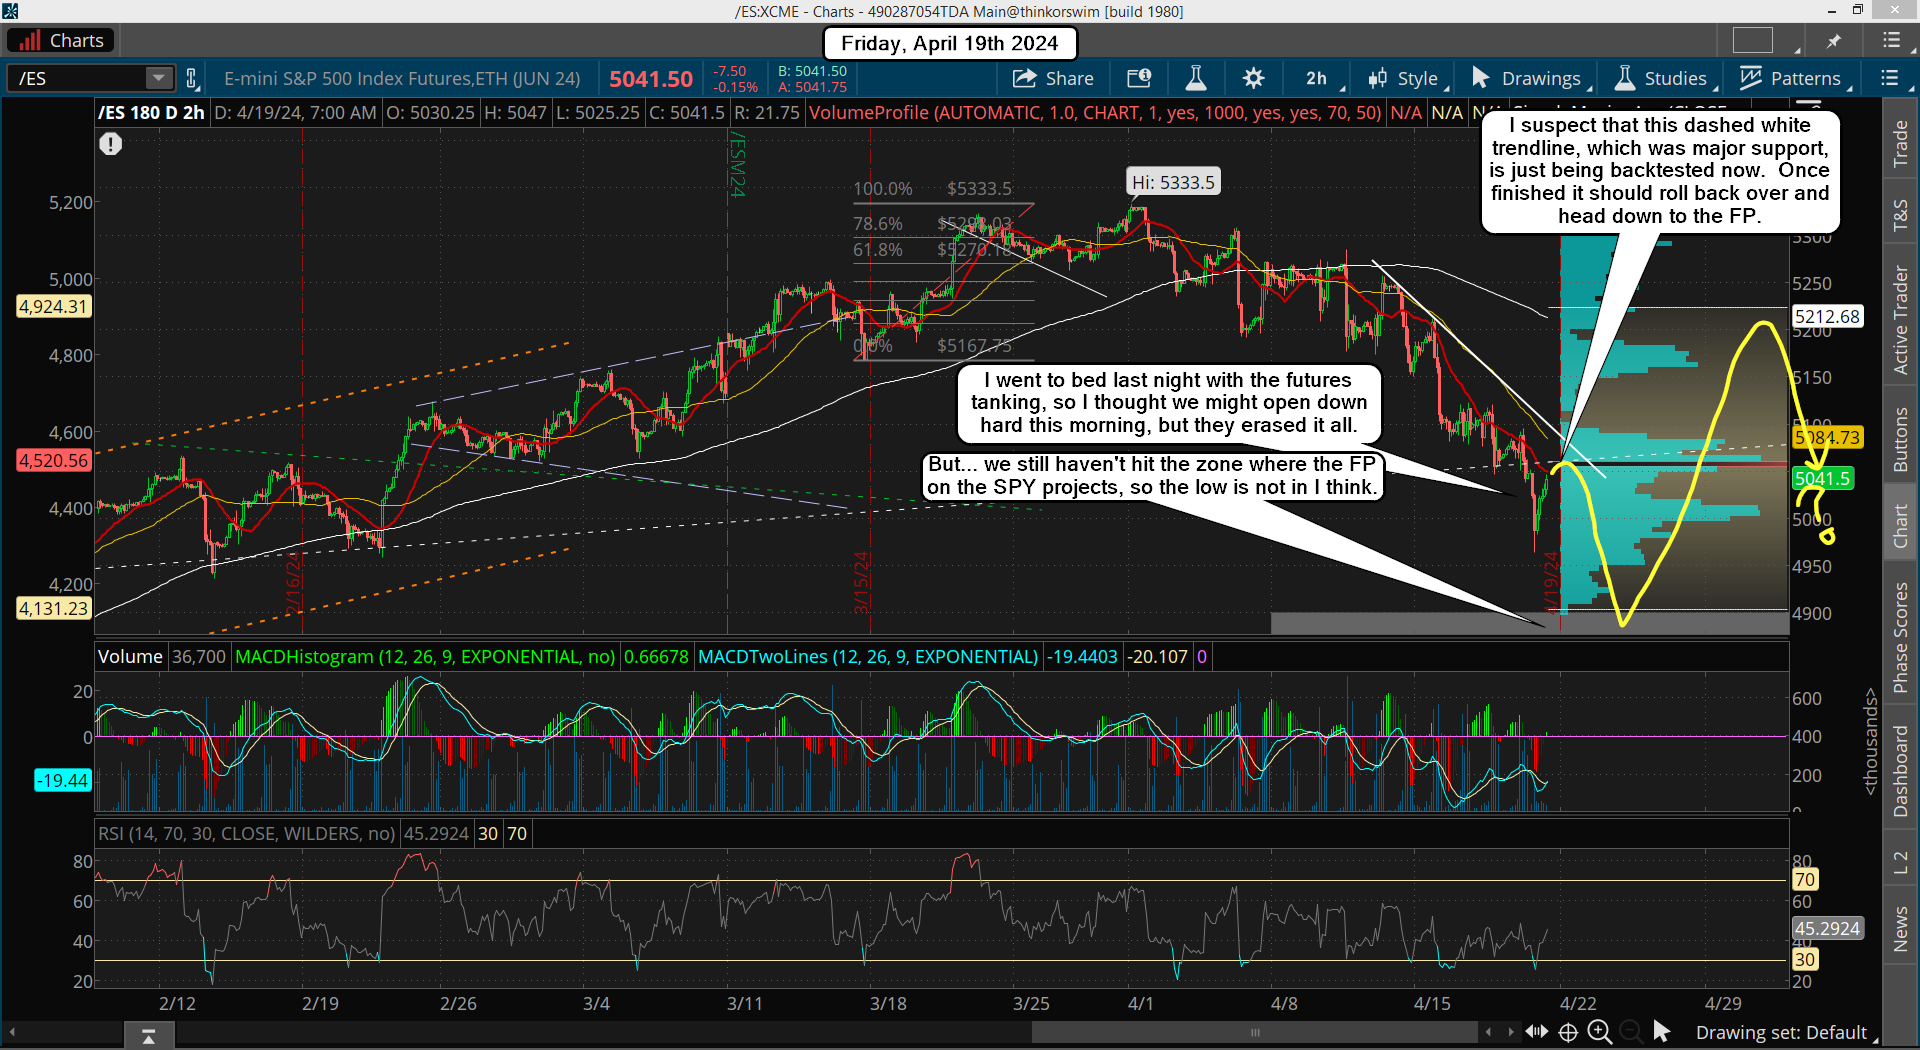
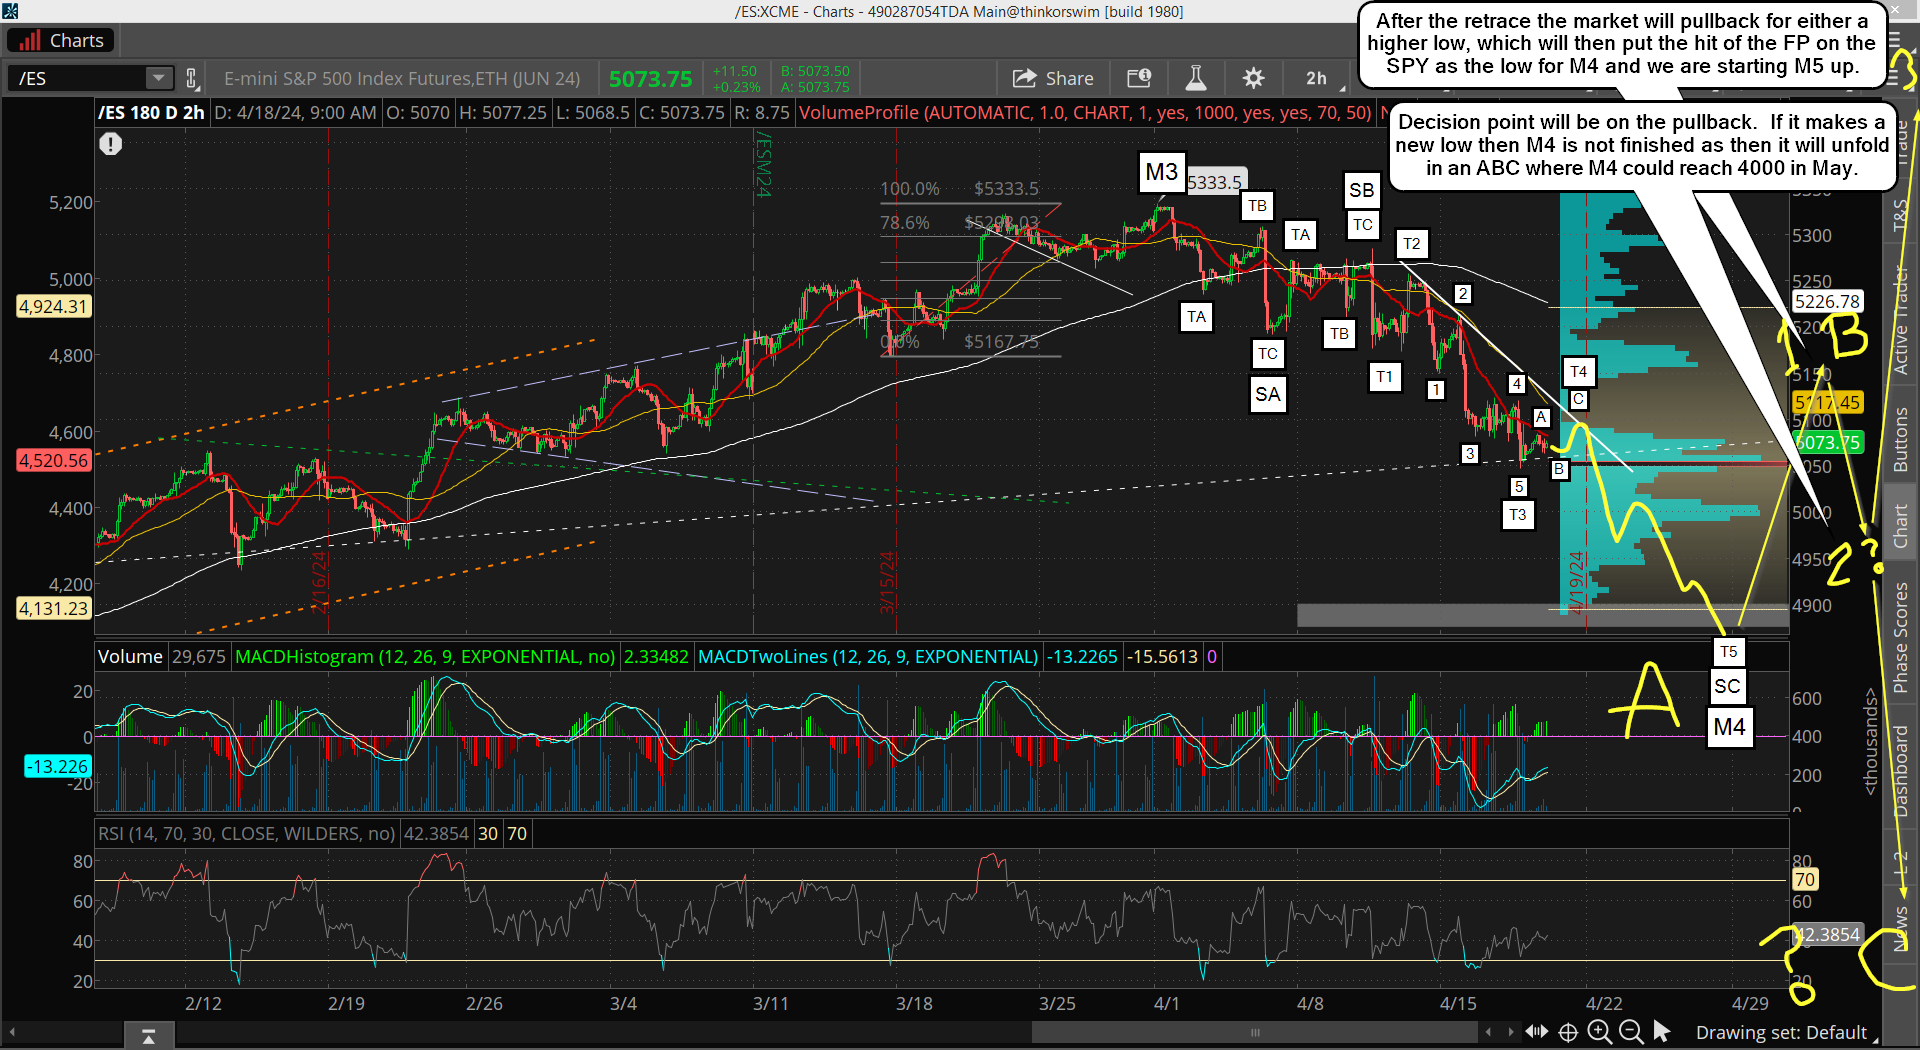
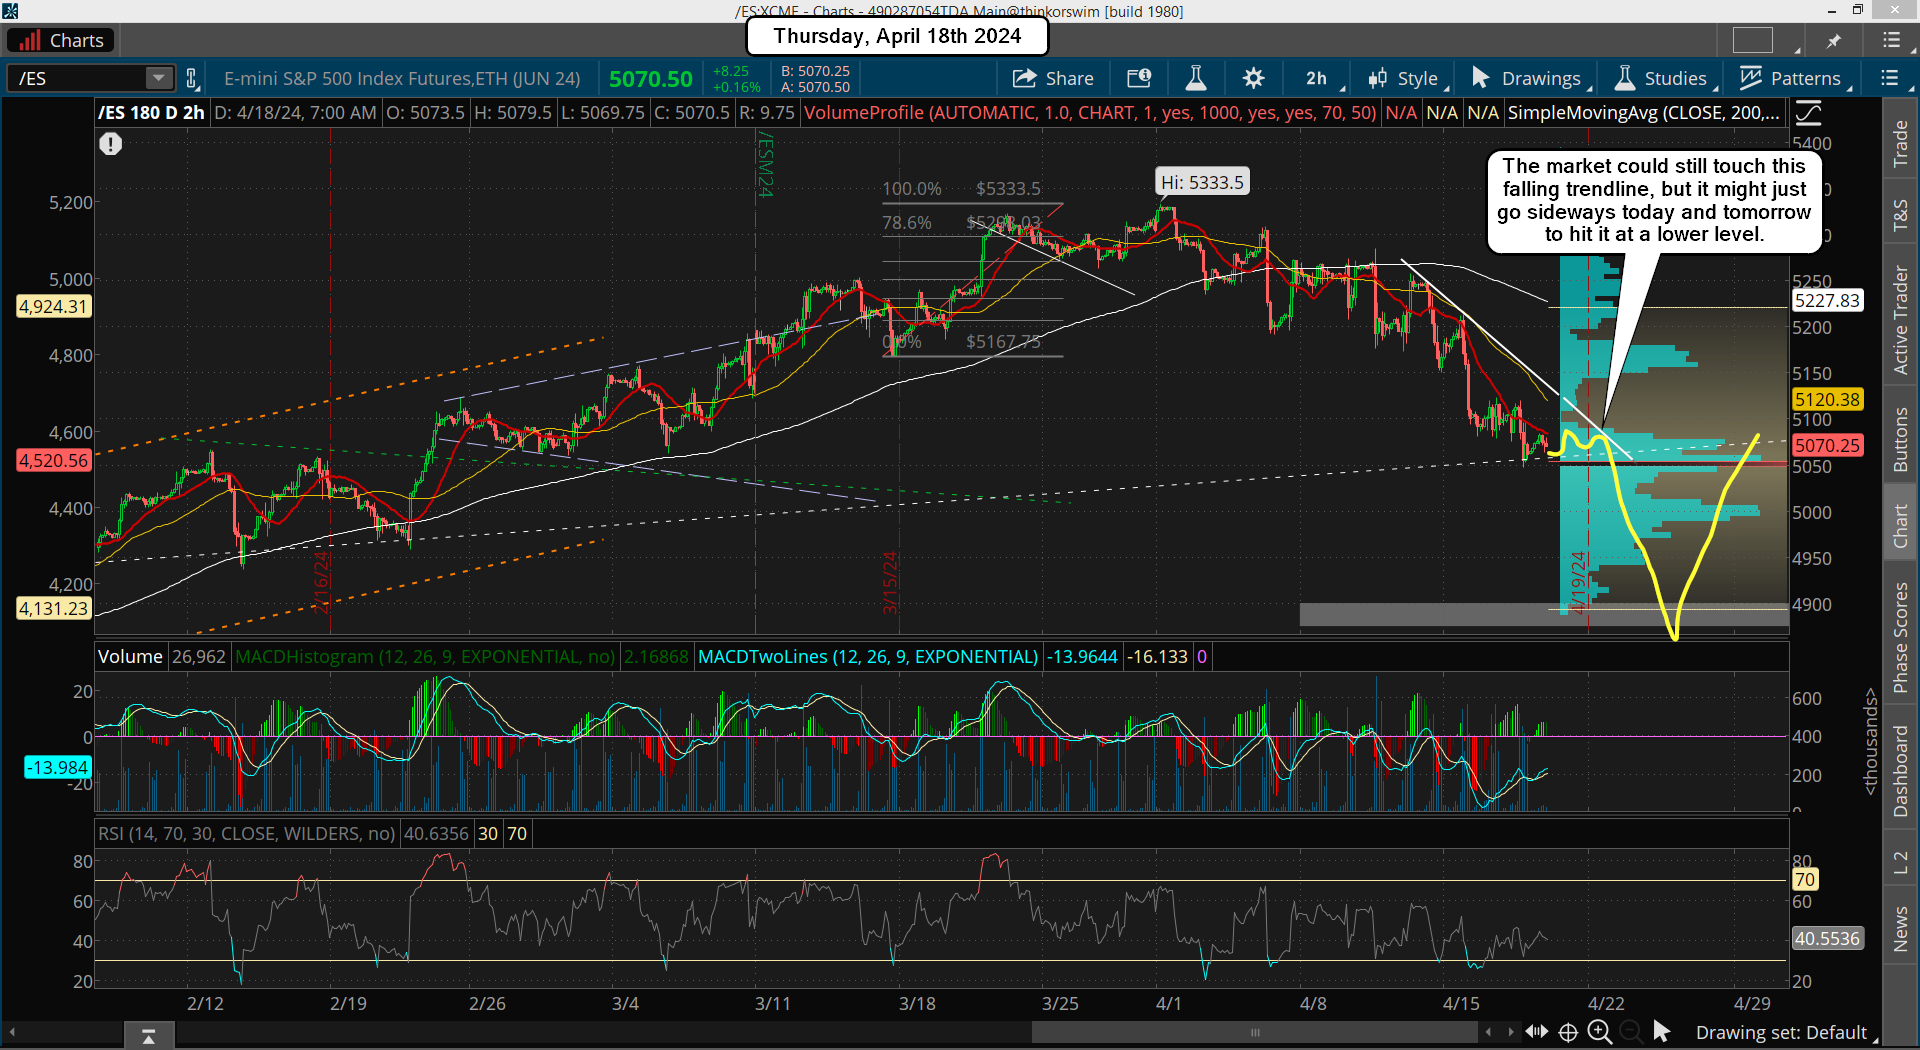
A nothing day yesterday as the chop continued. This 5050 area on the ES is critical support for the bulls, which is why it's been such a battleground. To me it's just delaying the move down to the FP, which is coming one way or the other. At this point it's looking like it will be next week, which is fine with me. Possibly next Monday or Tuesday as we are only about 150 points or so away from it.

On the ES it should be around 4880-4890 and on the SPX around 4850 or so. That could hit even today, but with it being OPEX I have to think they will hold it up to pin it at wherever max pain is for options. That's all I have for now. Here's yesterday wave count I posted in the chatroom.

Keep in mind that if we hit the FP today that means they plan on gaping it up on Monday to do the 50% retrace with everyone trapped short over the weekend expecting a crash.  It won't happen.  Once the FP is hit the market will reverse.  With two FP's in the 483 zone on the SPY that's double conformation that it's real and that we will turn back up from it.

I would fully expect a gap up Monday (big one) and a squeeze all week.  I guess it could be over with by Wednesday but it should last the whole week I think.  I'll just be looking for a 50% move up (probably a hair more as it rarely stops right at 50), which is where I'll exit the long I plan on taking at the FP... if hit today. I'm still short and will exit it when the FP is hit, whether that's today or Monday.  But I get the feeling we will hit it today to get all the bears to stay short over the weekend.

I've been down this road many times thinking a crash would happen the following Monday, and it never did.  And now I have two FP's around the same area as well, so I know that once they are hit this market will squeeze back up the next day.  It's the perfect trap to do it over a weekend, so I promise you I will be exiting my short at the FP today and going long.

Have a great weekend.

ES Morning Update April 18th 2024

2

The market finally broke down yesterday but then recovered a lot of it before the close. Nothing really to do right now but wait as I know we will be hitting the FP on the SPY soon. It could happened today or tomorrow? I don't know the when part but I'm just holding my shorts and will only exit once it's hit.

Then I'll go long for a 50% retrace, which should be back to around 5100 or so. Time wise I'd say that will happen within 2 weeks... probably faster, like 1 week. After that happens I don't know? I'll have let it all play out and see what the charts look like at that point. The weekly chart is quite bearish looking so the move down after the retrace could be lower then the coming low at the FP, but it's not something I can forecast right now. One trade at a time and for me it's just to stay short until 483 on the SPY is reached and then get long.

Have a blessed day.
ES Morning Update April 17th 2024

0

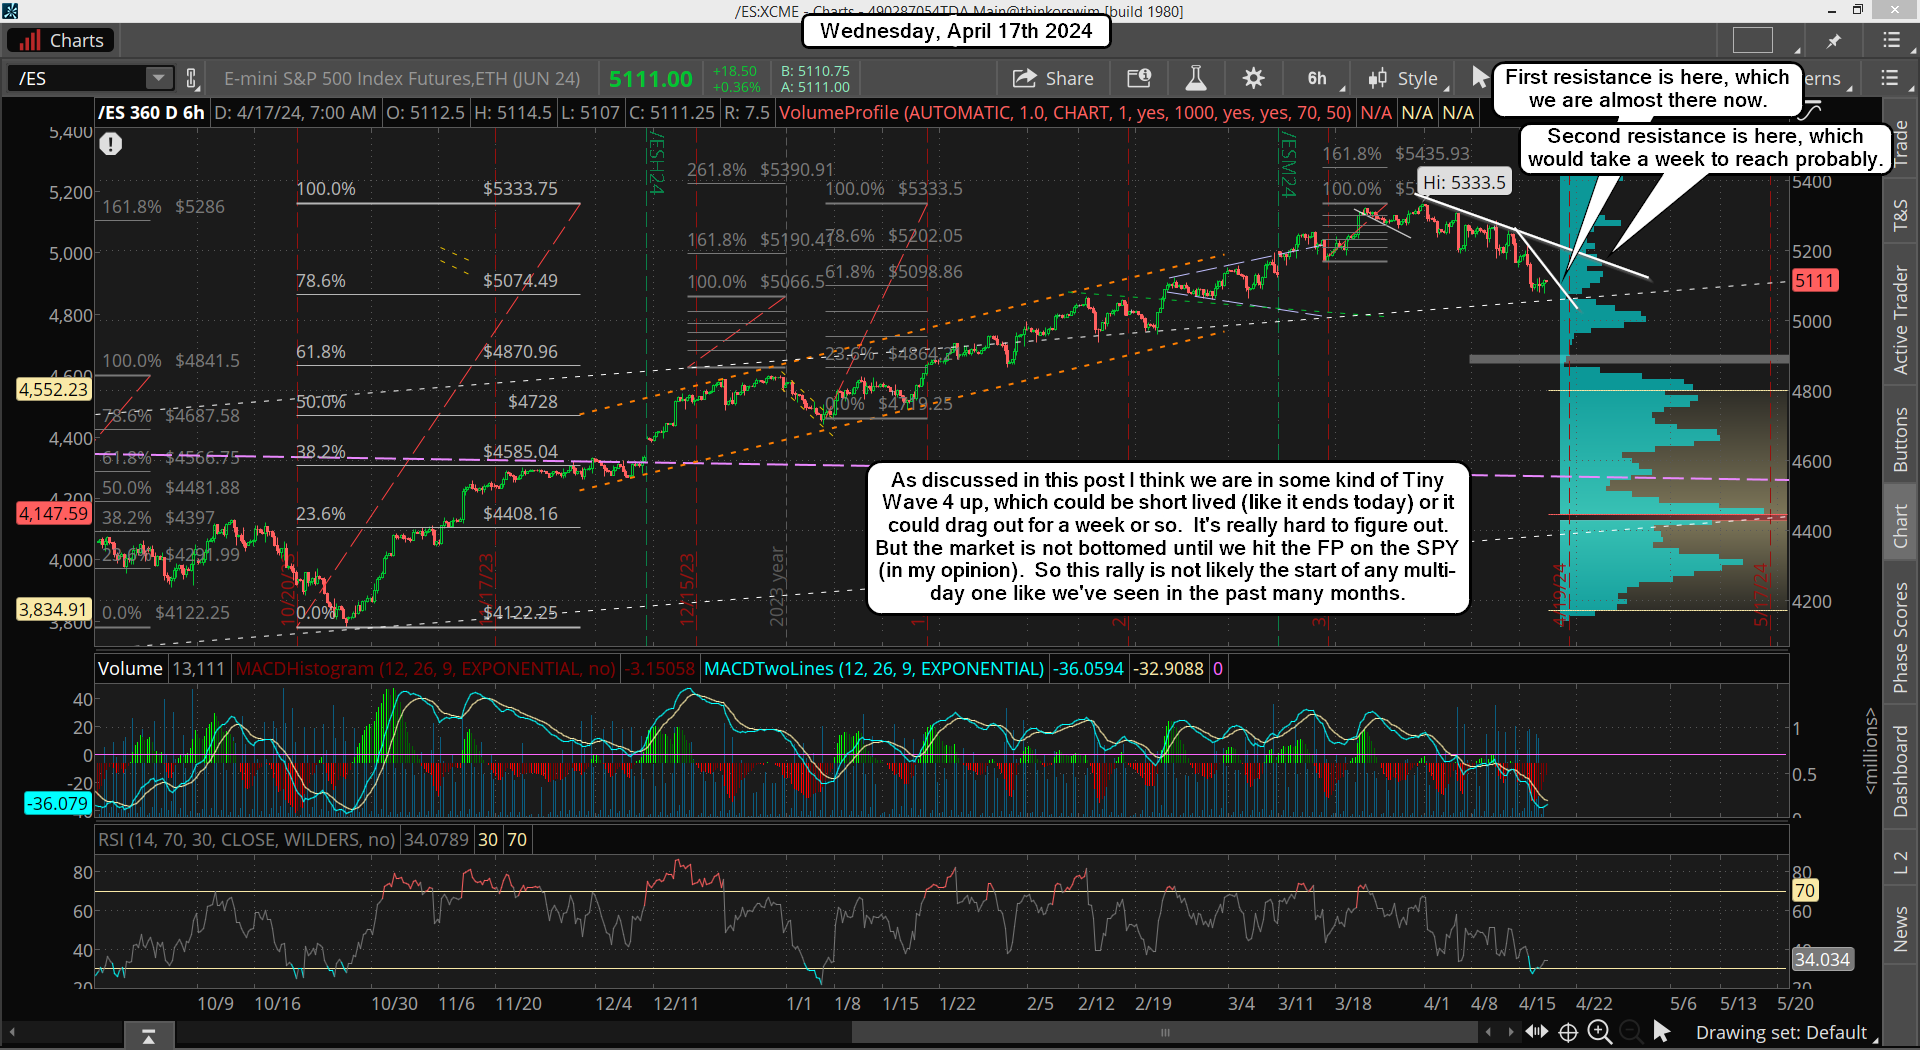
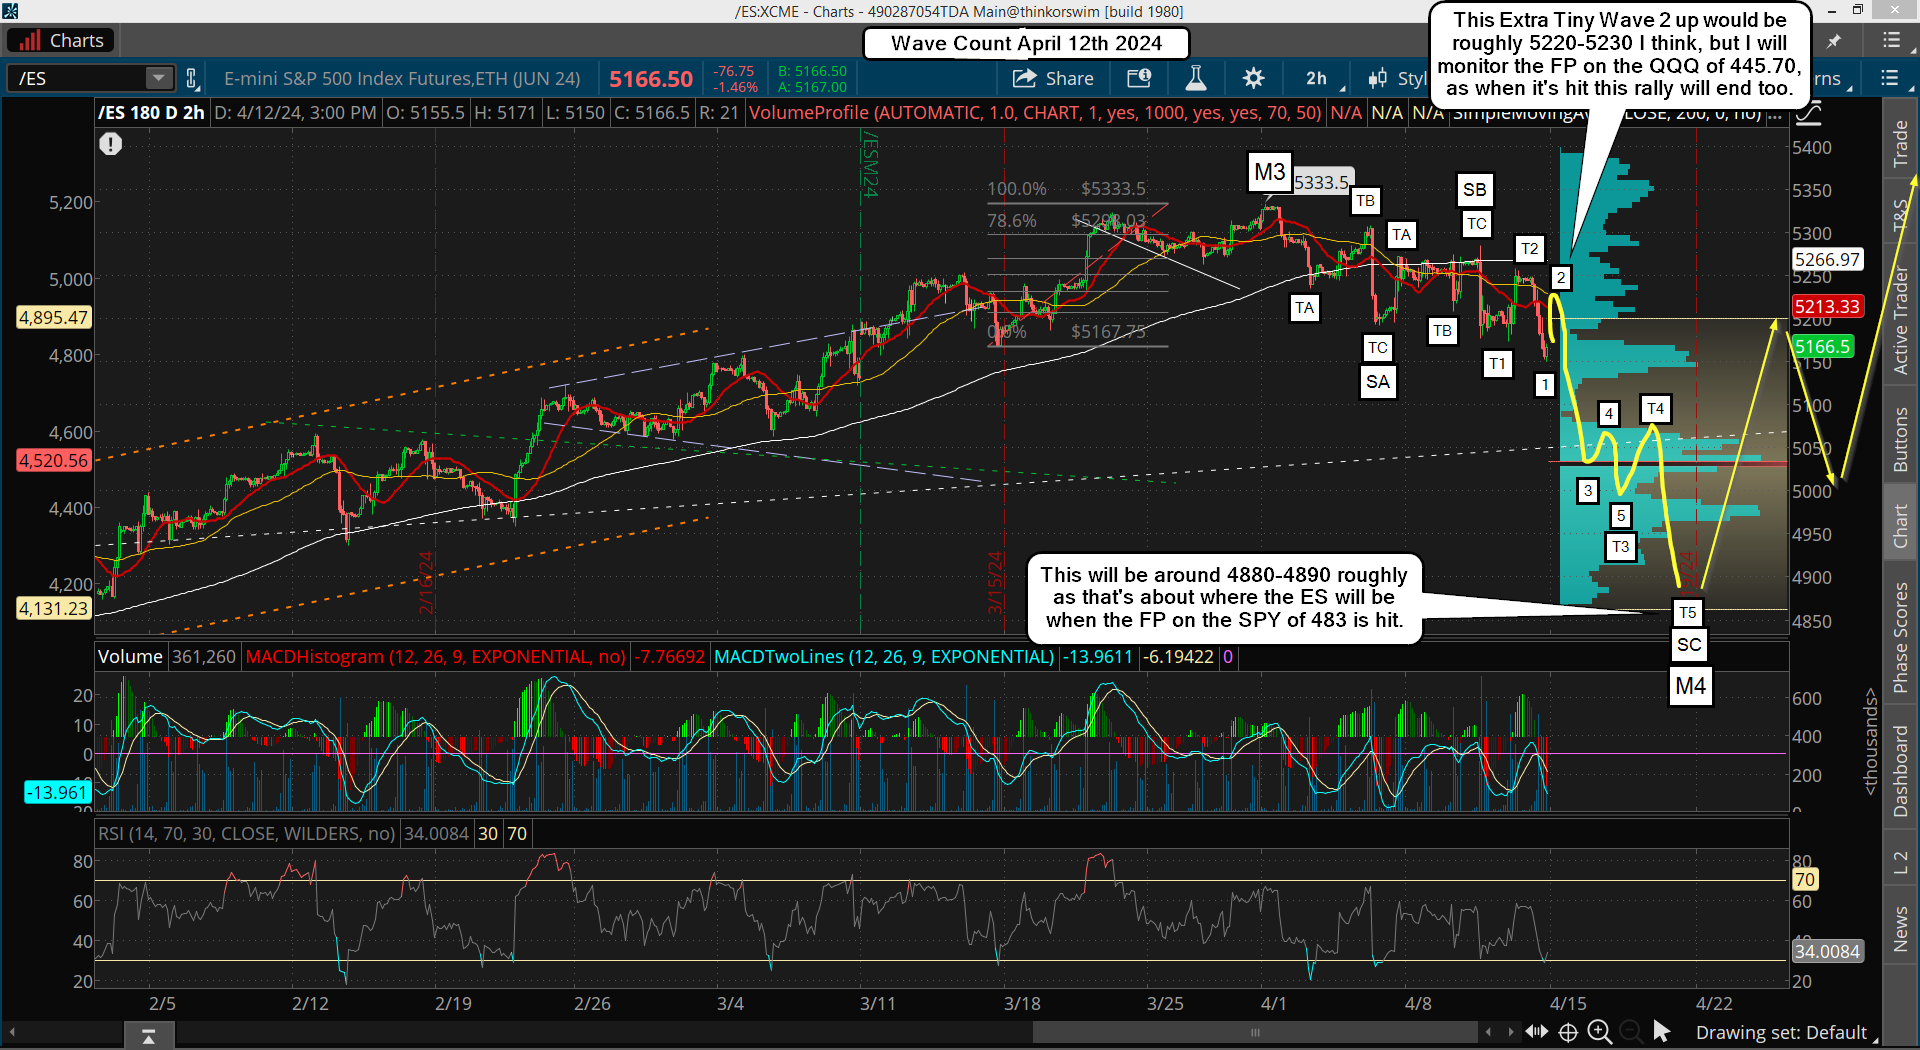
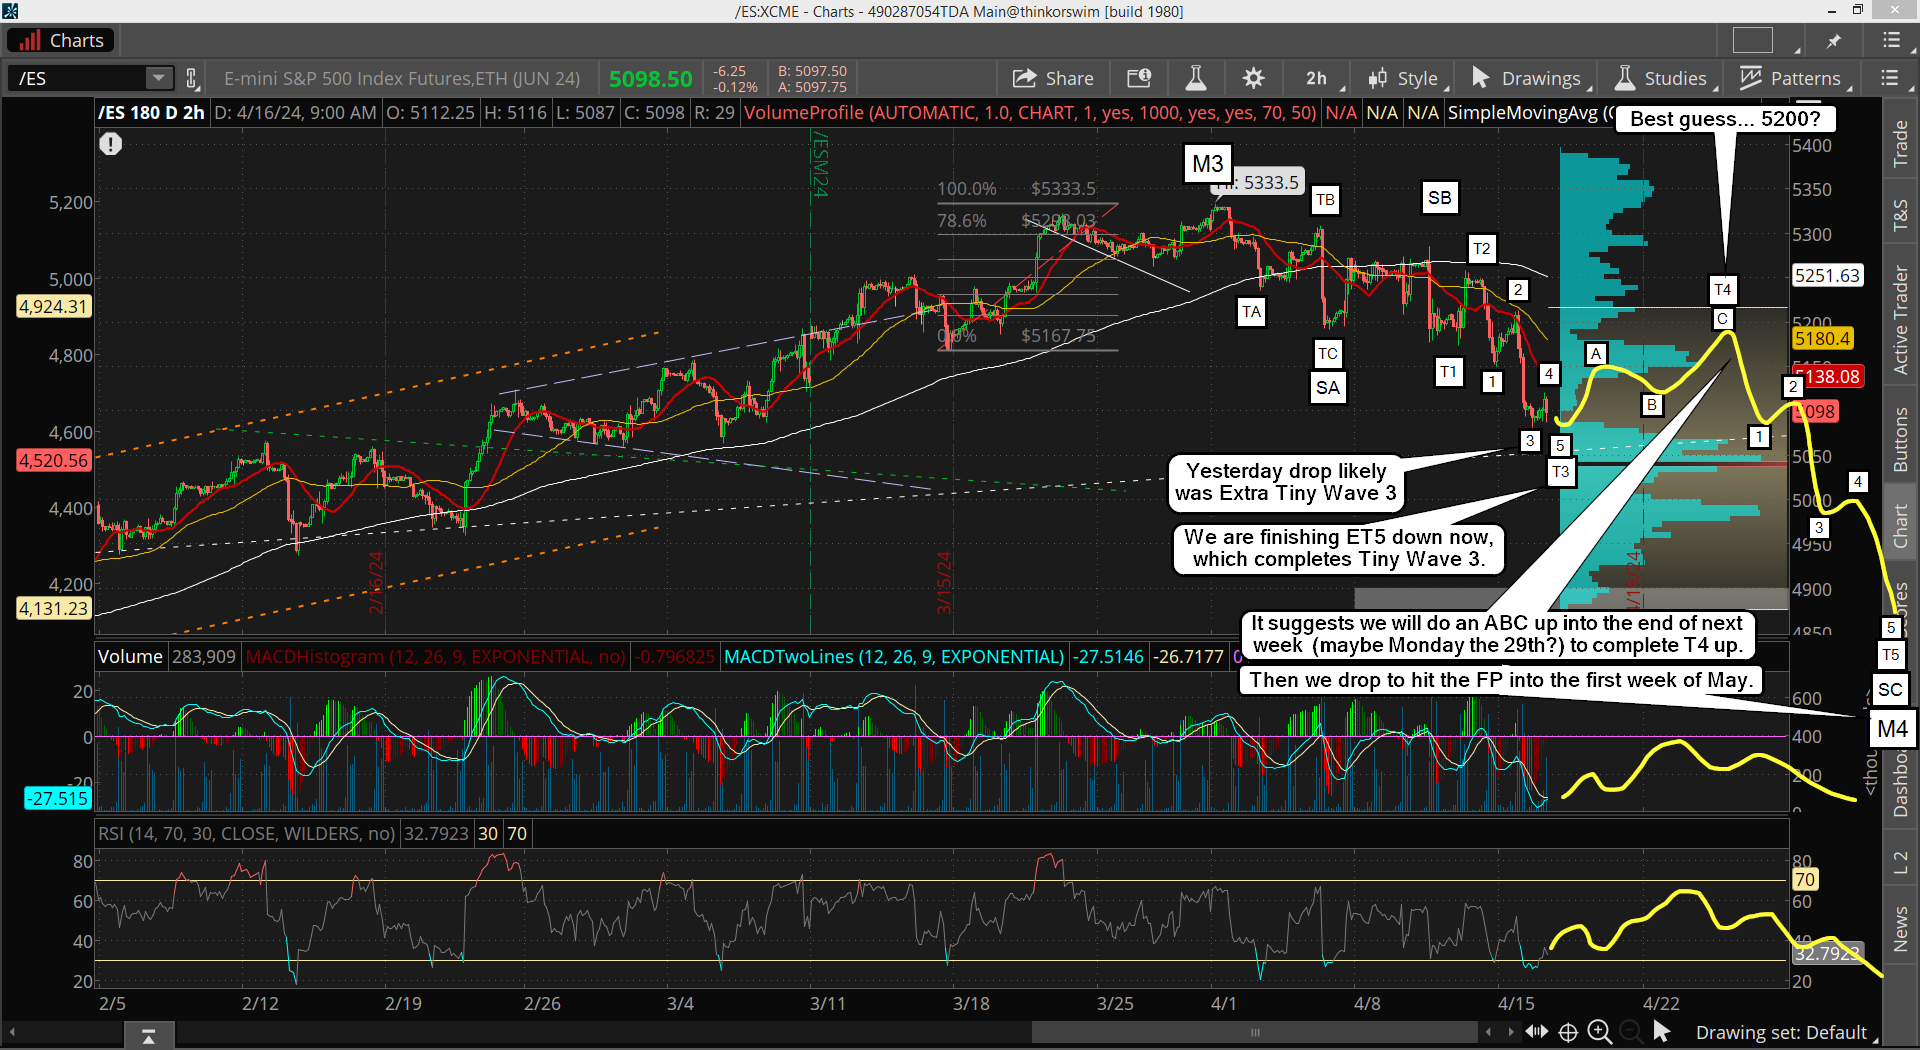
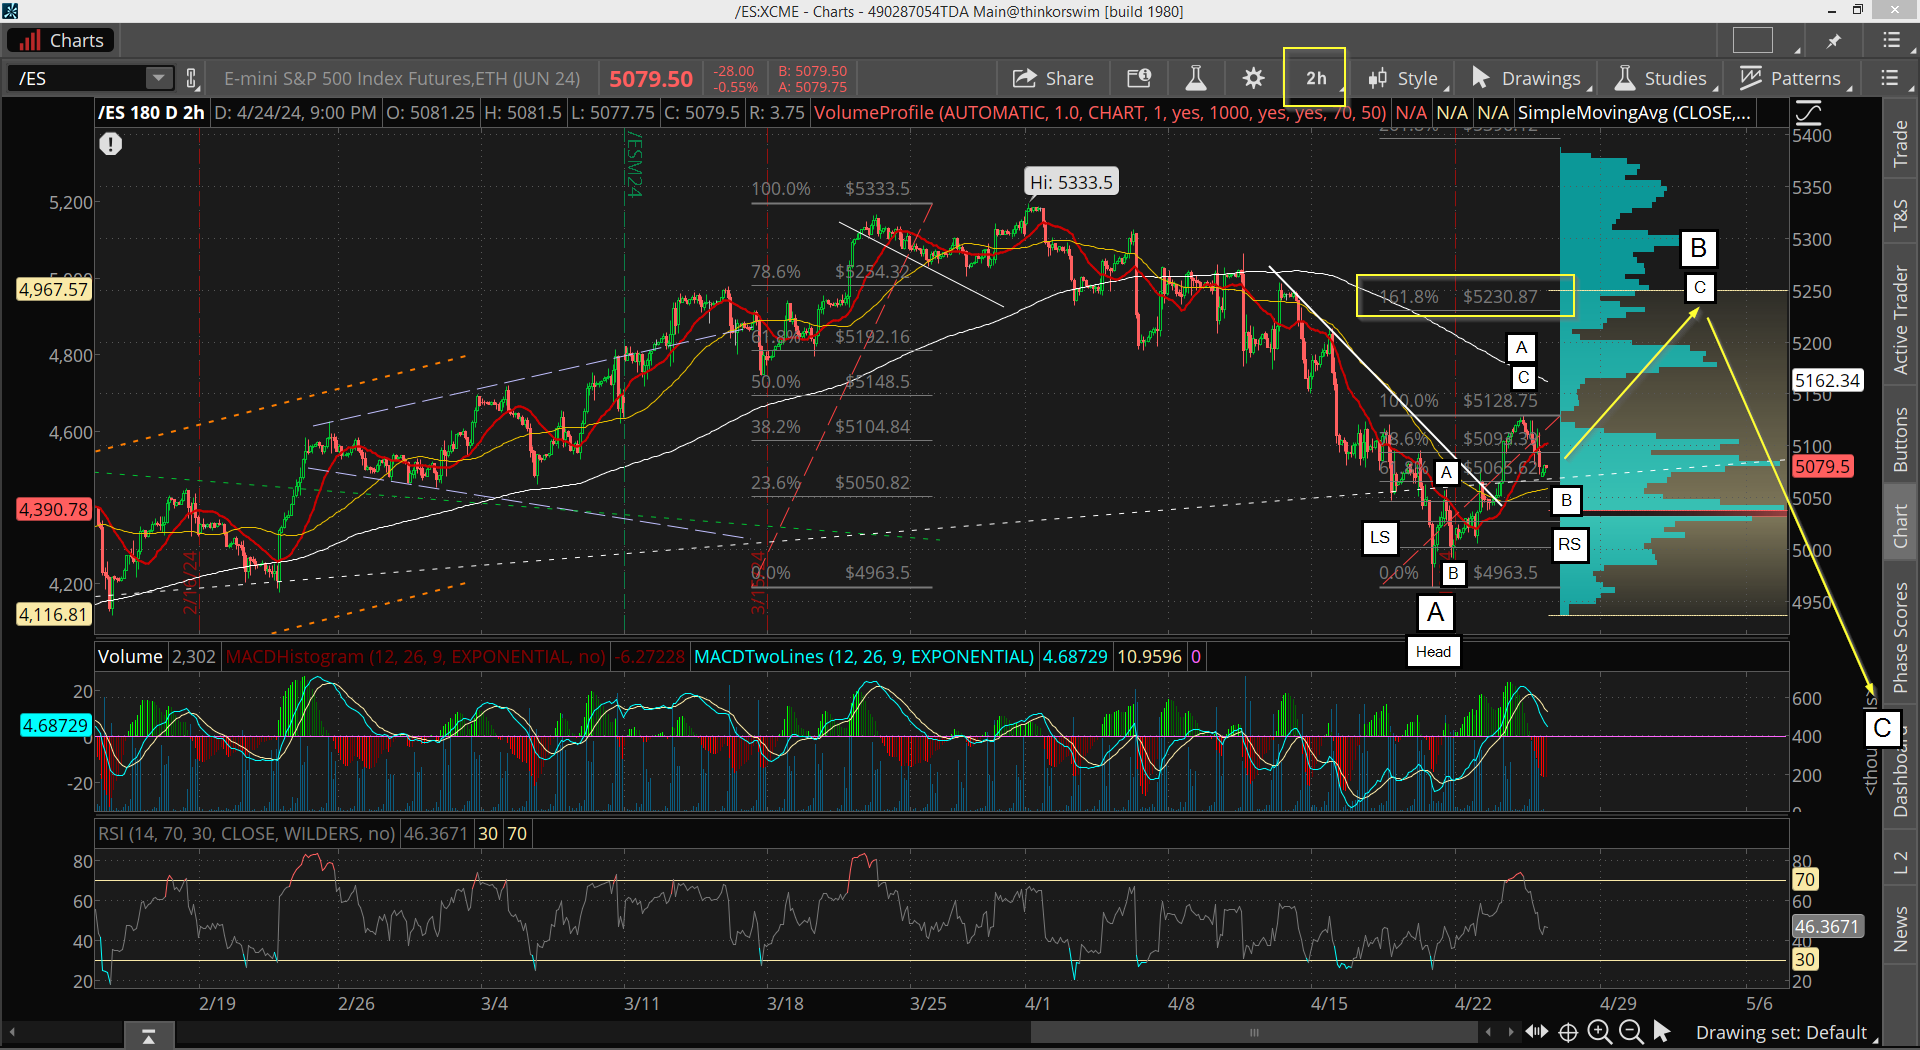
A "pause" day yesterday as the market completed what I think was Extra Tiny Wave 4 and 5, which completed Tiny Wave 3 down. After that is Tiny Wave 4 up, which could be very small as I posted on my chart I did of the wave count from Friday, April 12th close.

Now if we get any kind of good squeeze going then T4 will probably last about a week and could retrace 50-61.8% of the entire drop.

It's a tough call on what is going to play out. If the market can't get much going on the upside today then I think time will run out for the bulls and that we'll start Tiny Wave 5 down, which could reach the FP on the SPY by tomorrow. It's a "gut" feel thing right now on whether or not we are going to rollover hard or delay it and start a good rally as I don't know which scenario is correct.

Have a blessed day.
ES Morning Update April 16th 2024

0

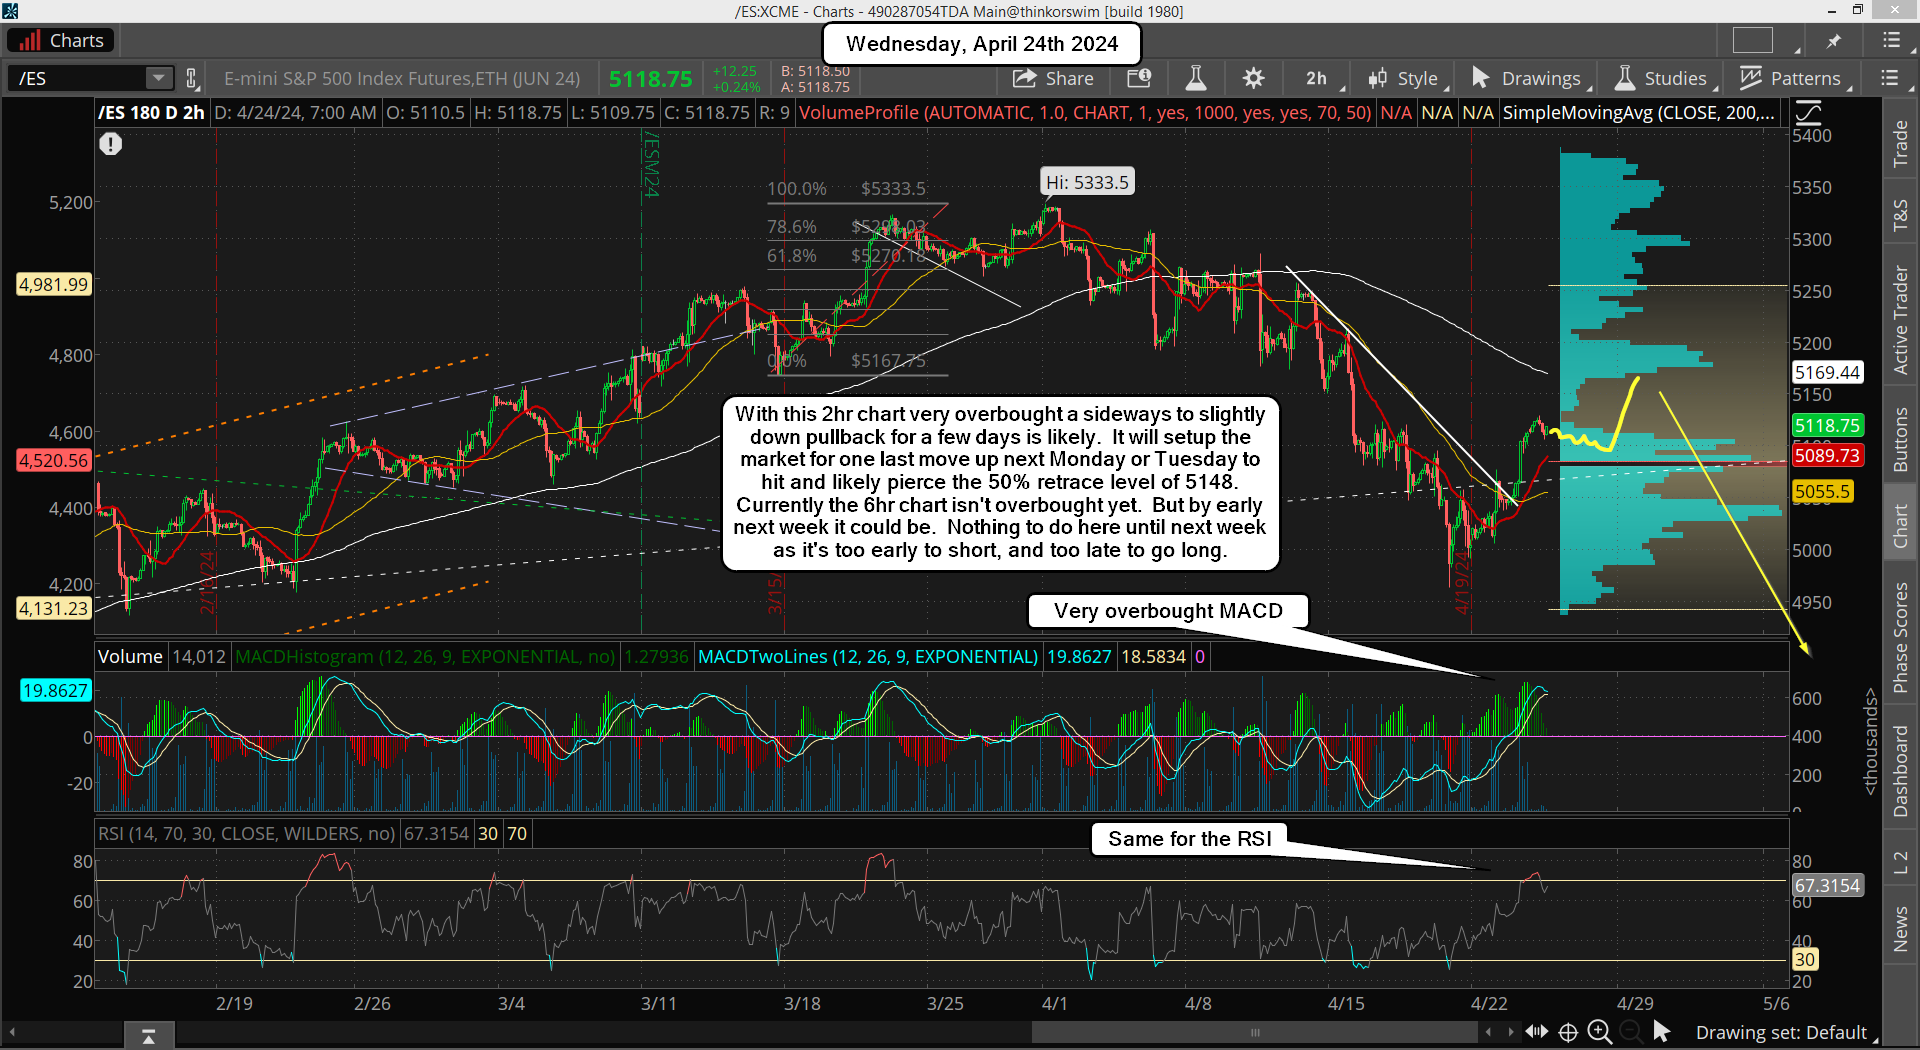
Another tricky move yesterday as we did get an early rally that looked like it might be going up to the FP on the QQQ, but then it rolled over and dropped steady the rest of the day, which I thought was at first just some B wave with the C up into the FP coming today. But that didn't happen as the market broke down in what is likely my Extra Tiny Wave 3, inside Tiny Wave 3, inside Small Wave C of Medium Wave 4.

I posted that chart on yesterdays update and it's tracking quite well so far... except for the rally up to the FP on the QQQ of course. When it was obvious that it wasn't going to go back up I took a small short. I hate chasing the market after it's already dropped 50 points but since I know we are going to the FP on the SPY I knew it would be worth the risk.

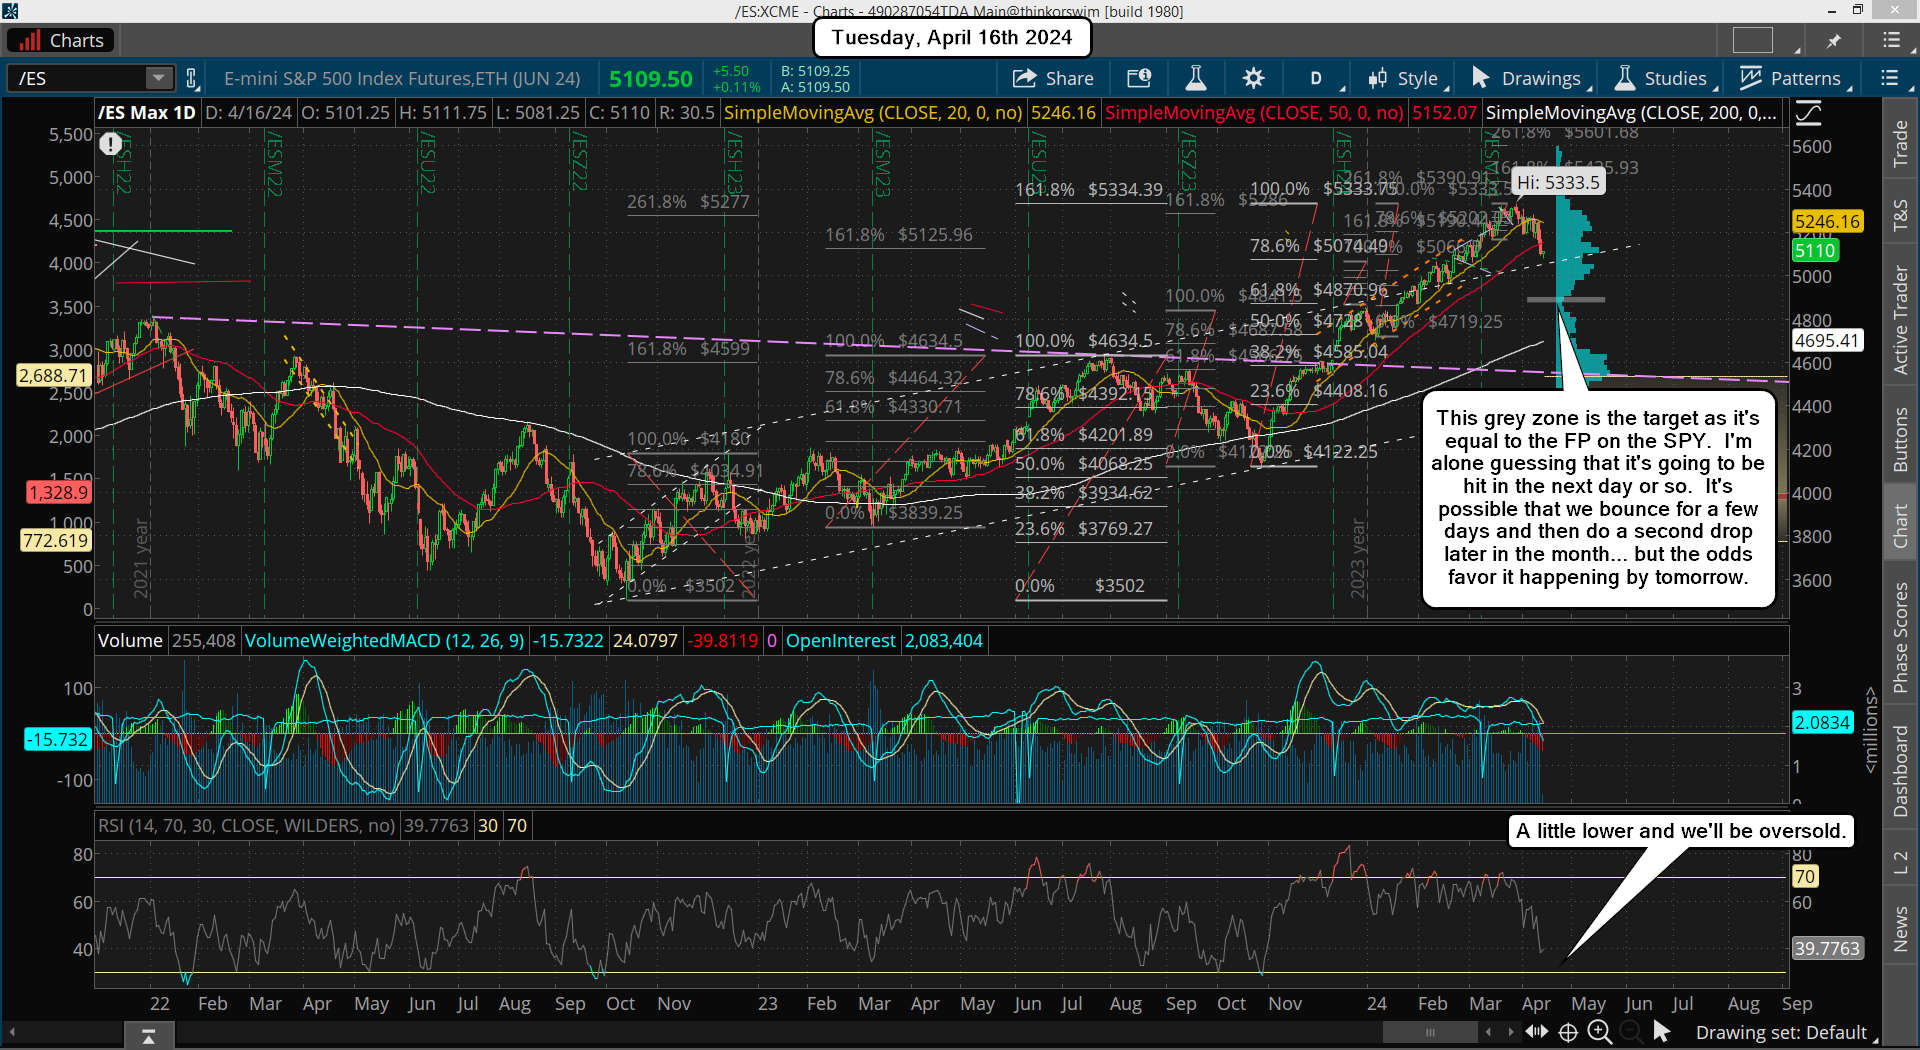
I think we will hit that 483 FP by this Wednesday, so I would not look for much of a bounce today. It's a short no matter how much it bounces and is a gift to the bears. I'll be looking for another spot to short again today but I doubt if I get much of a bounce. When we hit (and pierce) the FP of 483 on the SPY I expect to see a rally up of 61.85 of the drop into the end of this month.

We'll then likely pullback again for a higher low in the first or second week of May. The should be a wave 1 up and 2 down, so after that pullback I'll expect to see a super strong wave 3 rally up for a wave 3, which should go into June and beyond probably. Although I didn't get my ideal entry for the short I still got a small bit of it, and will really be excited to catch the long once the FP is hit.

Have a blessed day.
ES Morning Update April 15th 2024

2

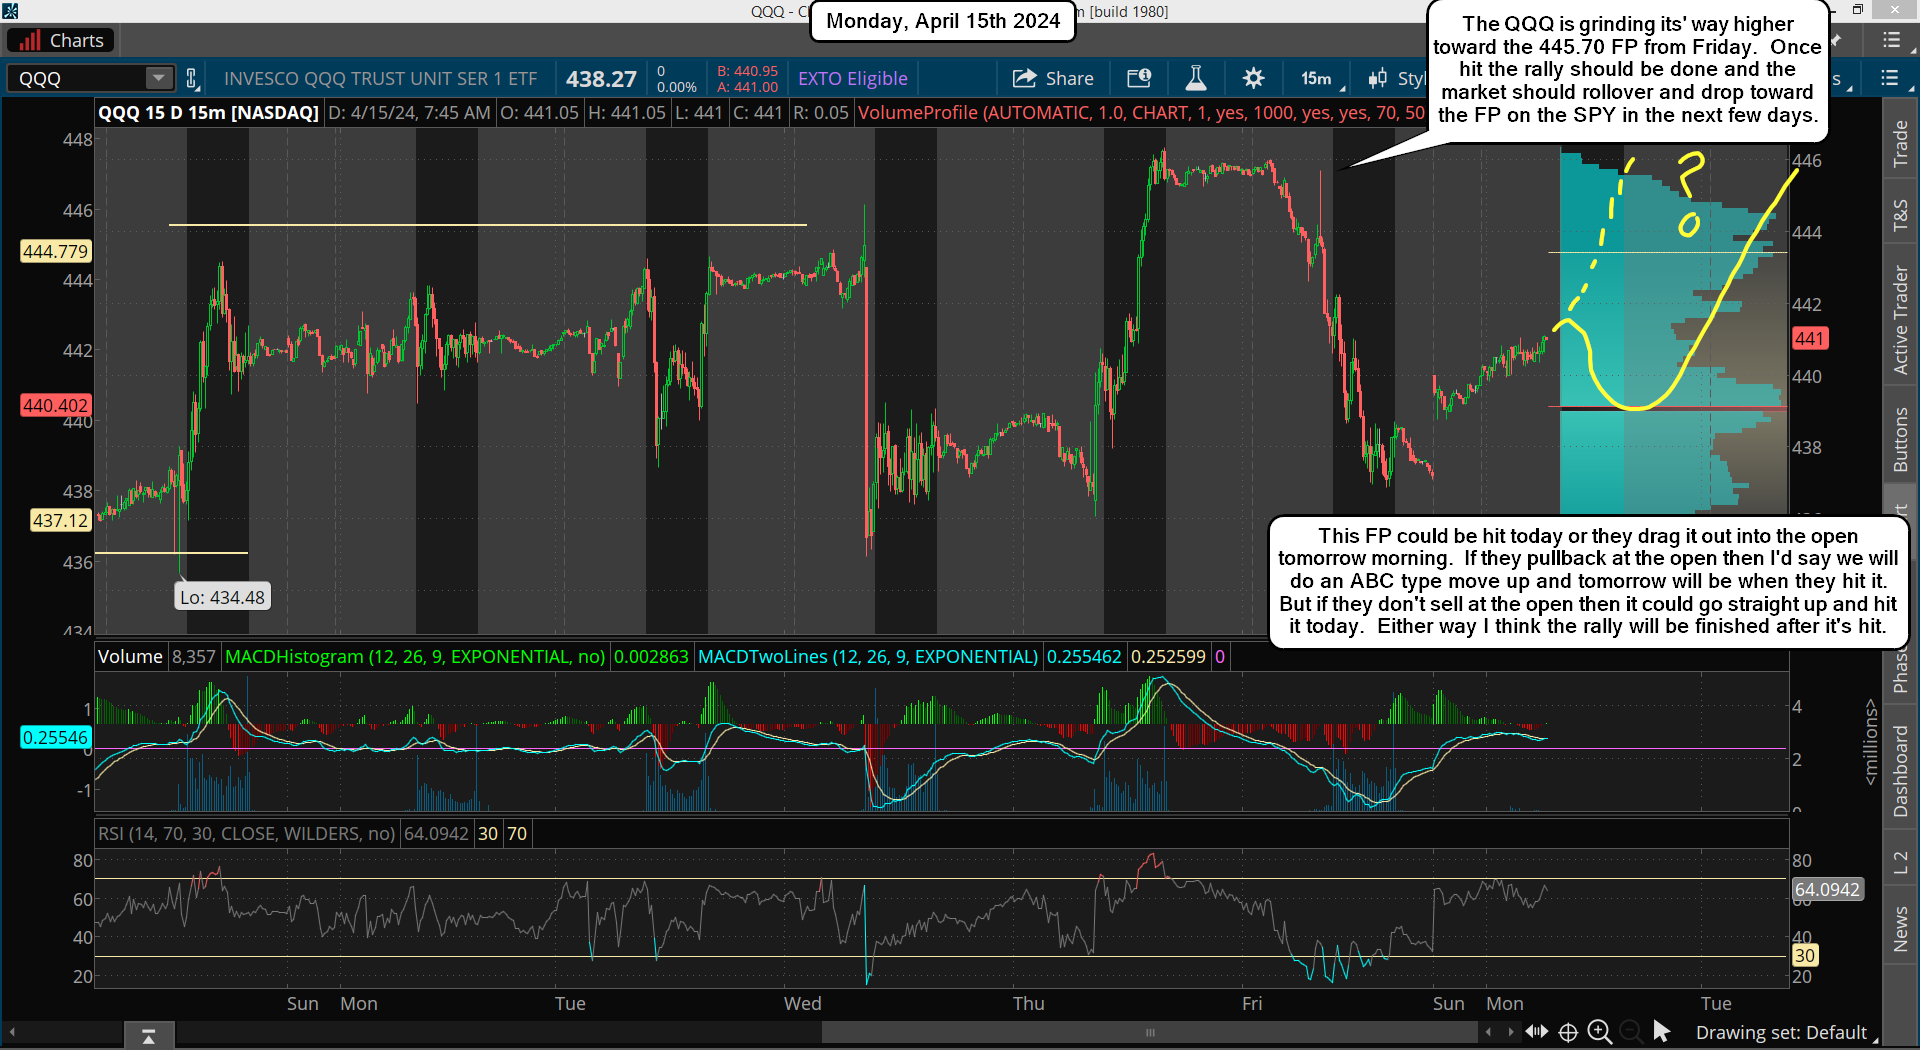
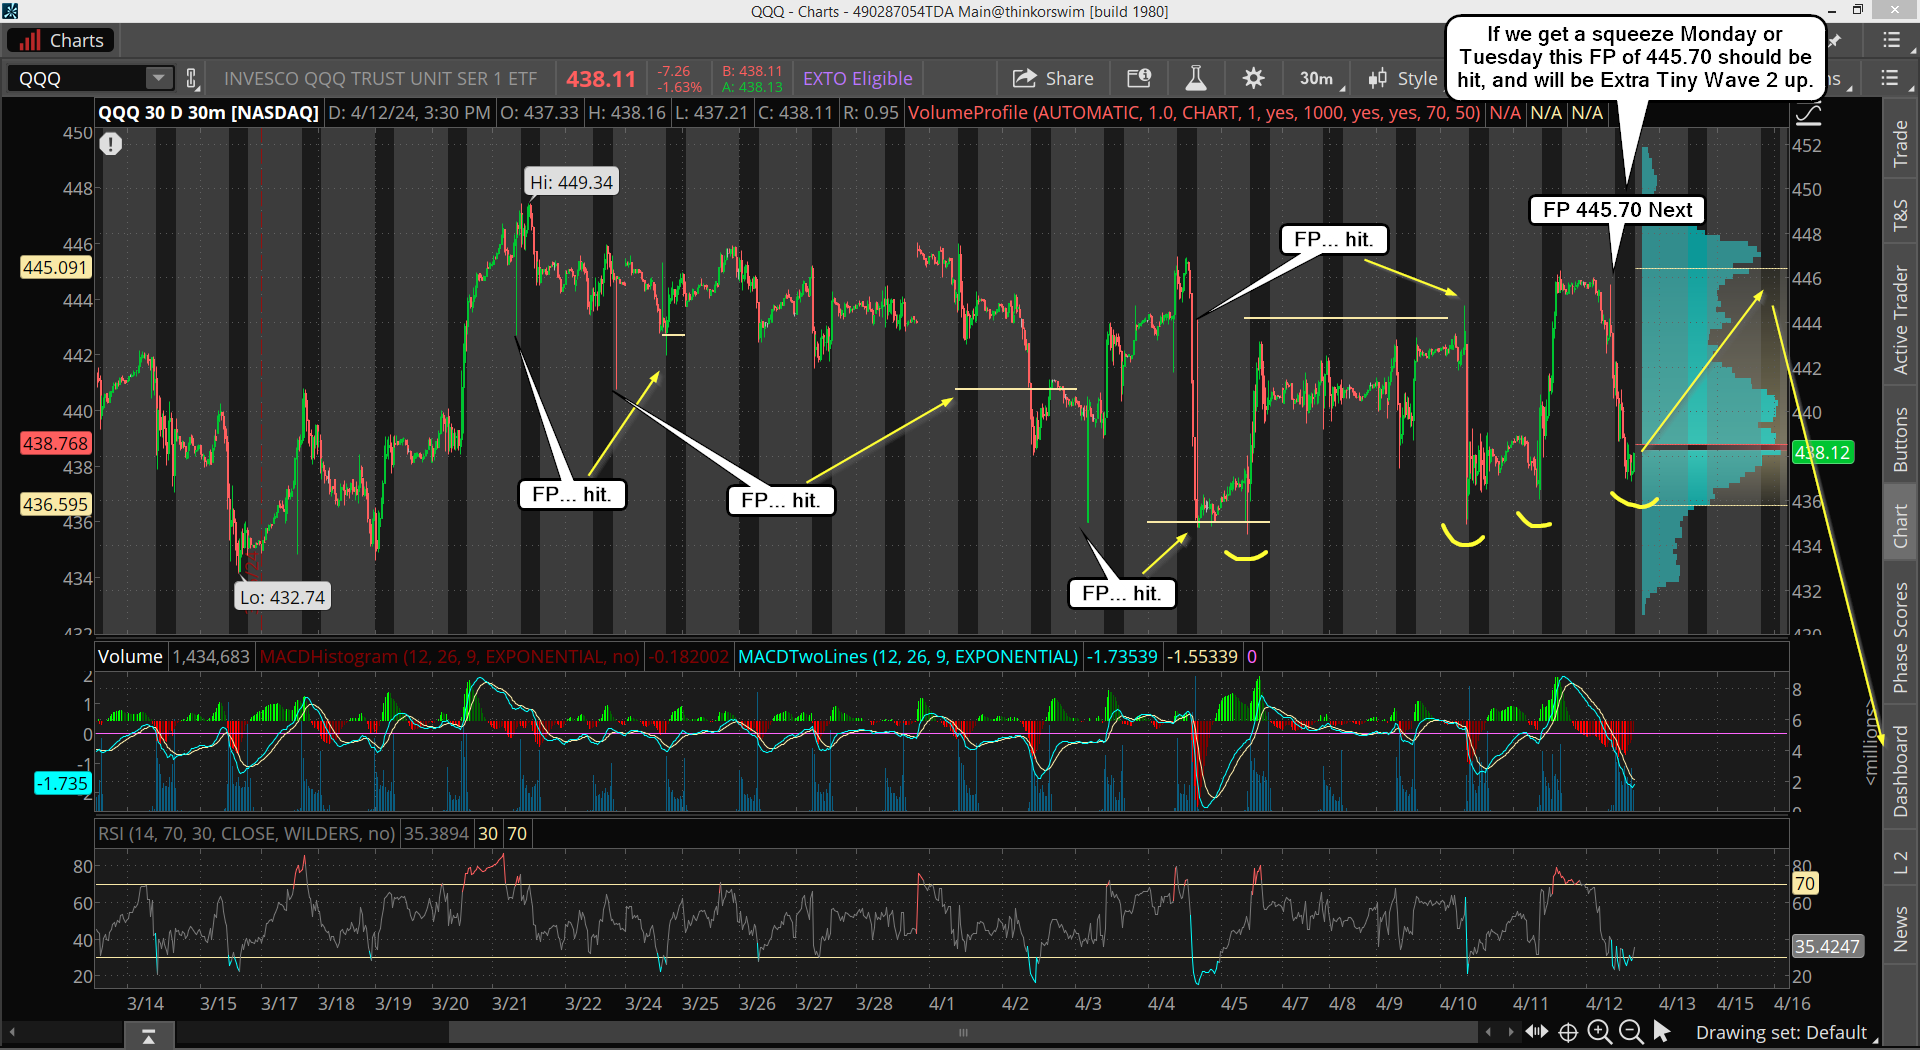
What a disaster for the bulls last Friday. I thought we would rally back up as the technicals where getting down in a zone where "turns" back up commonly happen, but it instead we took another large move down. I have to now rethink what is happening here. But first, let me share another FP on the QQQ that appeared Friday morning before the open.

This FP is for 445.70, and pretty much is a full reverse (about 95%) of the drop on Friday. Now that's ONLY on the QQQ, and it's stronger then the ES, so if this happen I don't think the ES will recover as much... maybe 75-80% of the move down? The ES is in a falling channel, whereas the QQQ (Nasdaq) is in more of a sideways channel. If the FP is hit early this week on the QQQ I think we might reach 5220-5230 on the ES, but not all the way back to the 5245 zone where it spent the premarket session at Friday.

Ok, so I said I have to rethink everything... which I have. I was stubborn and thinking that we'd only get a small pullback (which we have... so far) and then we'd go back up again and continue the grind like we've done for months now. But over the weekend I stepped back and re-thought about everything, and I've concluded that it's very likely that we are now in the 5-10% correction after all.

My FET of 5334 was a direct hit with the current all time high being just one point shy of it, so why would I think that a target that important would just produce a minor dip? I should have woke up and slapped myself and said "hey dummy, it's time for the 5-10% correction now", but I guess I've been so used too all the dips being bought, and new all time highs following, that I couldn't see the forest for the trees.

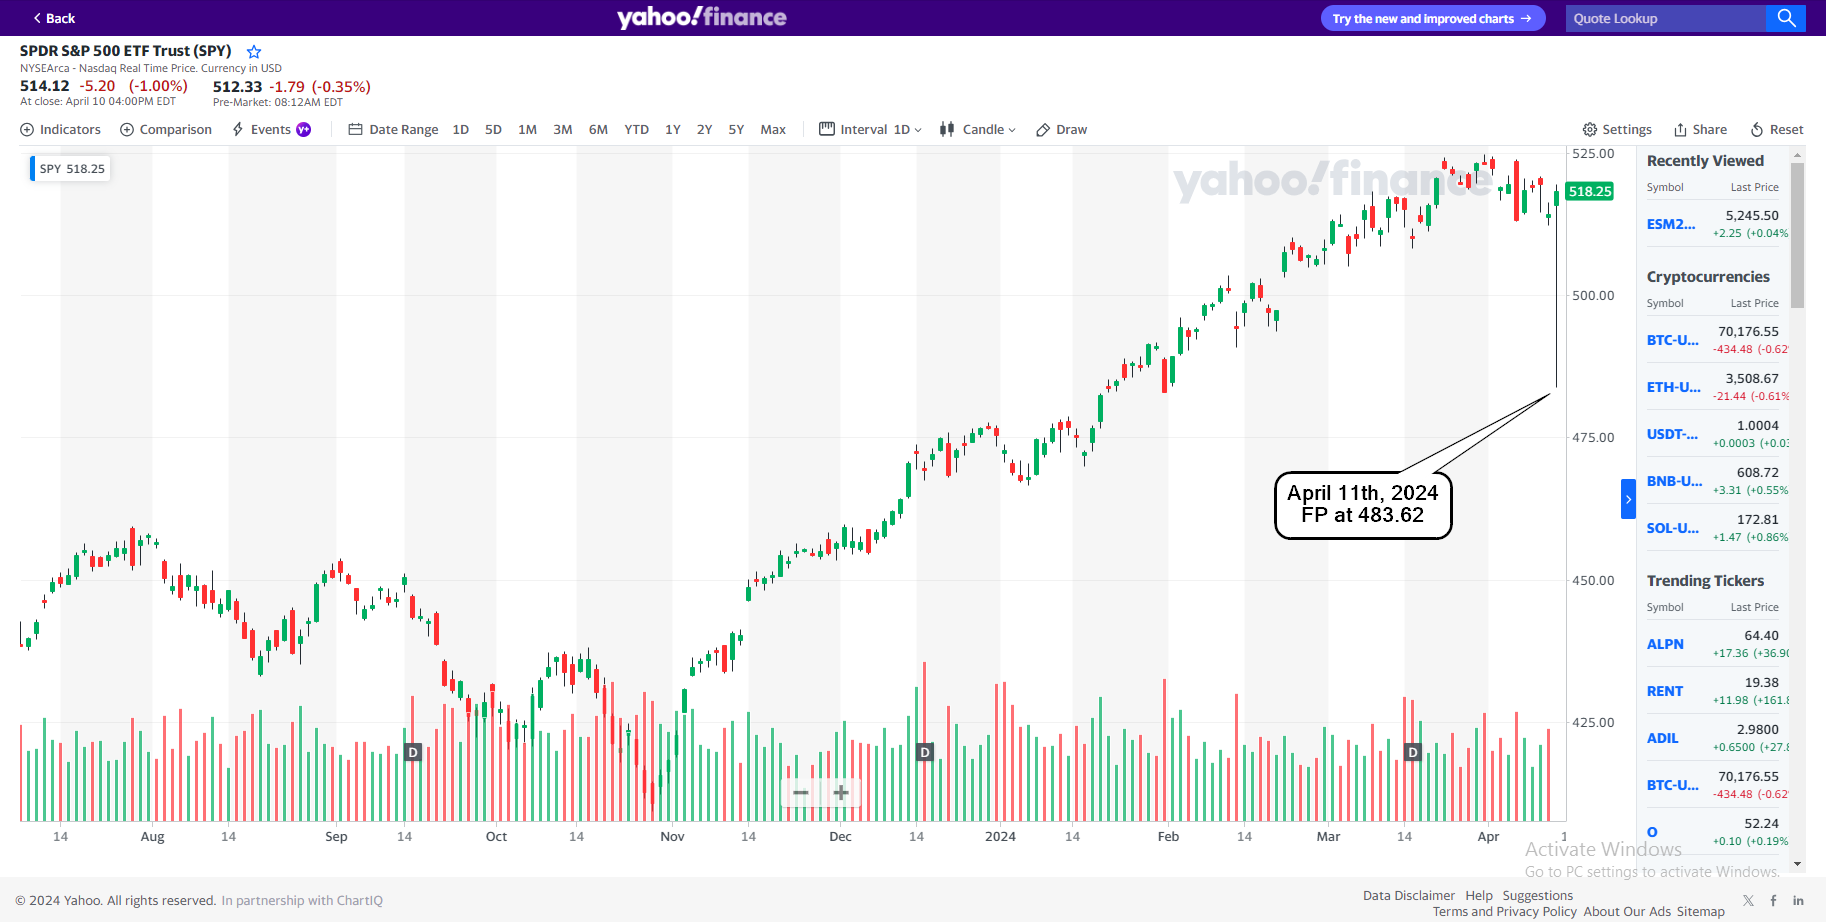
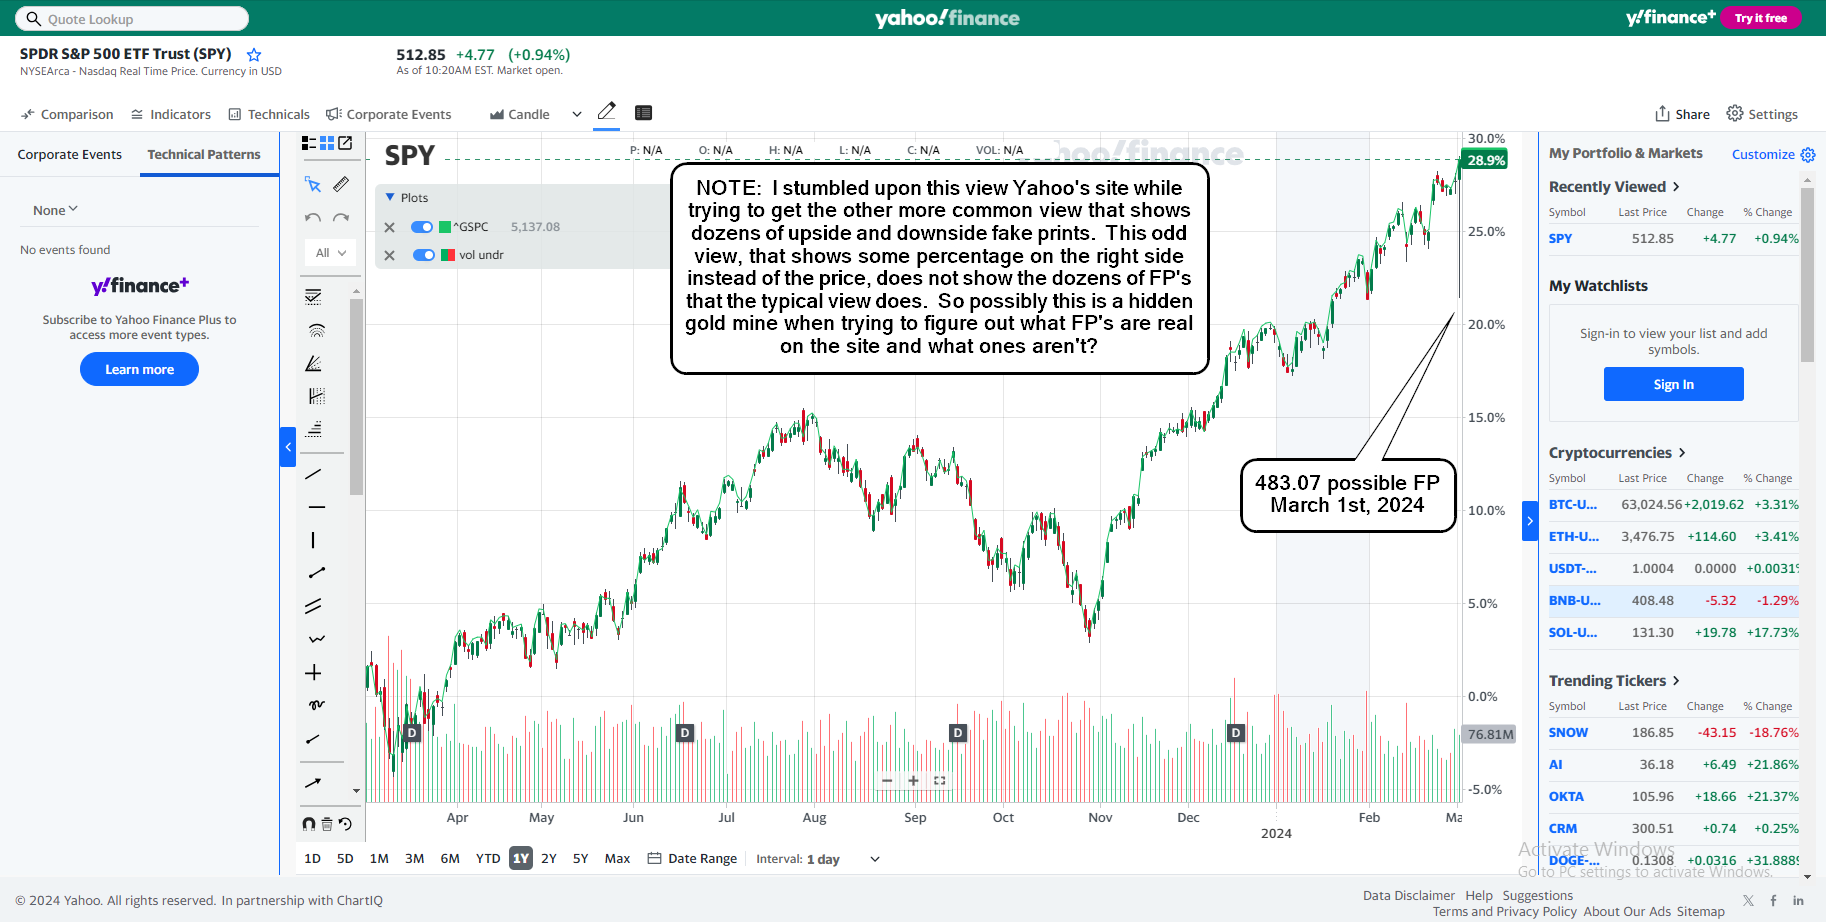
However, God gave me a good wake up last week with a second FP on the SPY that only lasted one day before disappearing. Guess where it was? The same 483 zone as the prior one back on March 1st.

Here's the first old one from March 1st below...

Now that's 2 Fake Prints showing the same level that disappeared within one or two days. Isn't that interesting?

Of course it's a signal that's telling all the insiders where the market will bottom at whenever the correction starts. So are we in the correction now? I have to think the odds are good that we are indeed in the 5-10% correction right now, and "if" we get some move up to the QQQ FP of 445.70 early this week I think it will be the last strong bounce before we have what will probably be a C wave drop (non-stop) that will hit the 483 SPY FP, which will be roughly 4880 or so on the ES (4830 or so on the SPX).

I've been clearly wrong on this pullback as it's more then that... it's the correction that everyone has been waiting for now for months. We could just go straight down to the SPY FP this week without any bounce back up to the QQQ FP, but the last 2 weeks the QQQ's have been a gold mine for FP's and they have all been hit within a few days, so I have no reason to believe this one won't be hit to. I just don't know the "when" part, but if it happens Monday it will NOT likely be the start of a big squeeze up to new all time highs as the history of those FP's don't support that, but instead they have all marked a "turning point".

Just look at all of them. They all got hit, pierced, and the market reversed back up the other direction. Why would this one be any different? When it's hit it I do think we'll turn back down again from it. The market will likely show NO FP whenever it's really going to run up and breakout to a new high and start the next multi-month grind higher, but that could be a month away.

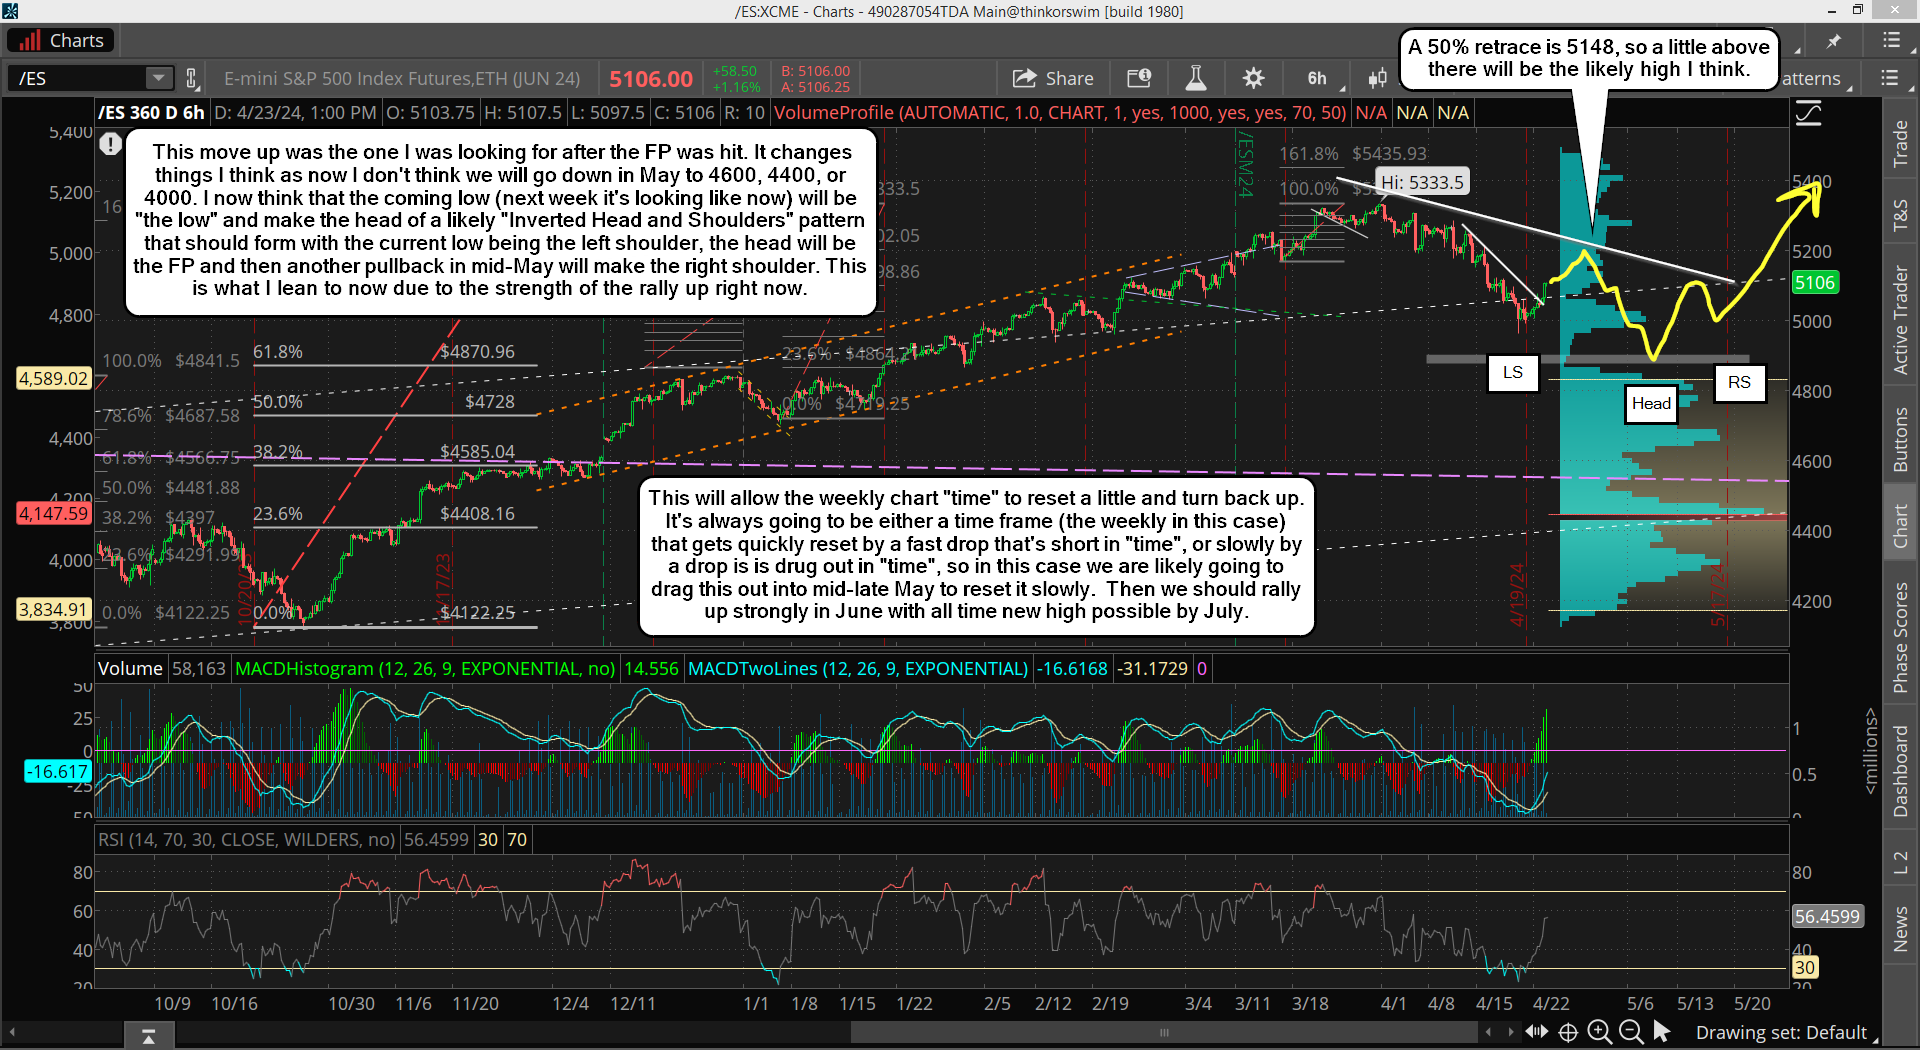
The very fact that this FP appeared last Friday is proof to me that we are not ready for another trend move up. It will only be another short squeeze that ends and gets reversed back down again. How low we go is anyone's guess? Maybe the market isn't in the 5-10% correction now? But the second 483 FP is telling me we are indeed in it, and all of these wild swings up and down look a lot like a whole bunch of wave 1's down and 2's up before a wave 3 of a 3 of a 3 (or A's and B's and then a C of C.... you get the idea). Here's what I see as possible with the waves...

Yes, we could be setting up a nasty crash like wave down coming this week, and it might be over with by mid-week. I really am kicking myself for not seeing this but I'm human and make mistakes, and this market is not easy to figure out. But if we do get one more move up early this week I think it's the ideal short before we drop to the 483 FP on the SPY later this week.

Here's the bigger picture wave count on the daily chart of the SPX cash...

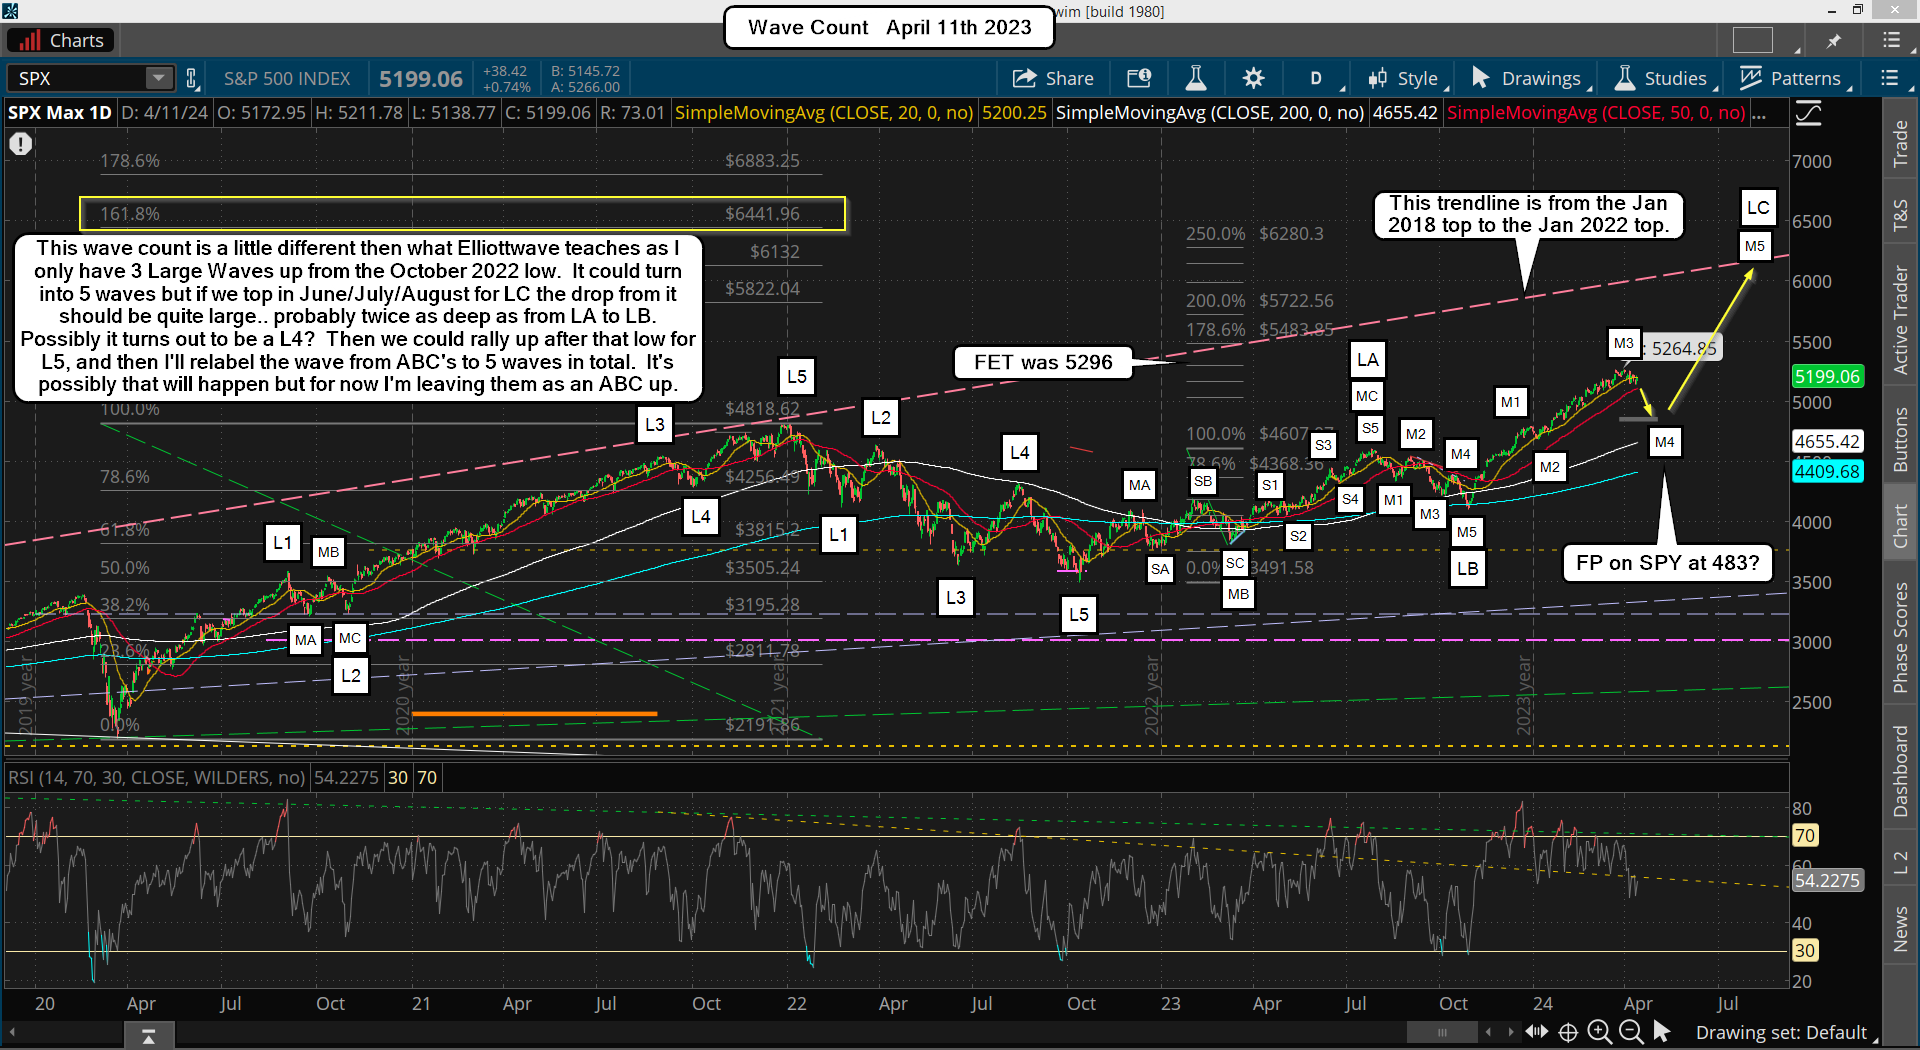
That dashed pink rising trendline will be strong resistance when it's hit this summer/fall, and it might mark the final high for Medium Wave 5?  The biggest Fibonacci Extension Target is at 6441.96, but who knows if that final leg up gets hit or not?  But I'll certainly be excited to ride that long out as it will be a huge money maker, and way easier then this correction.

Have a blessed day.
ES Morning Update April 12th 2024

0

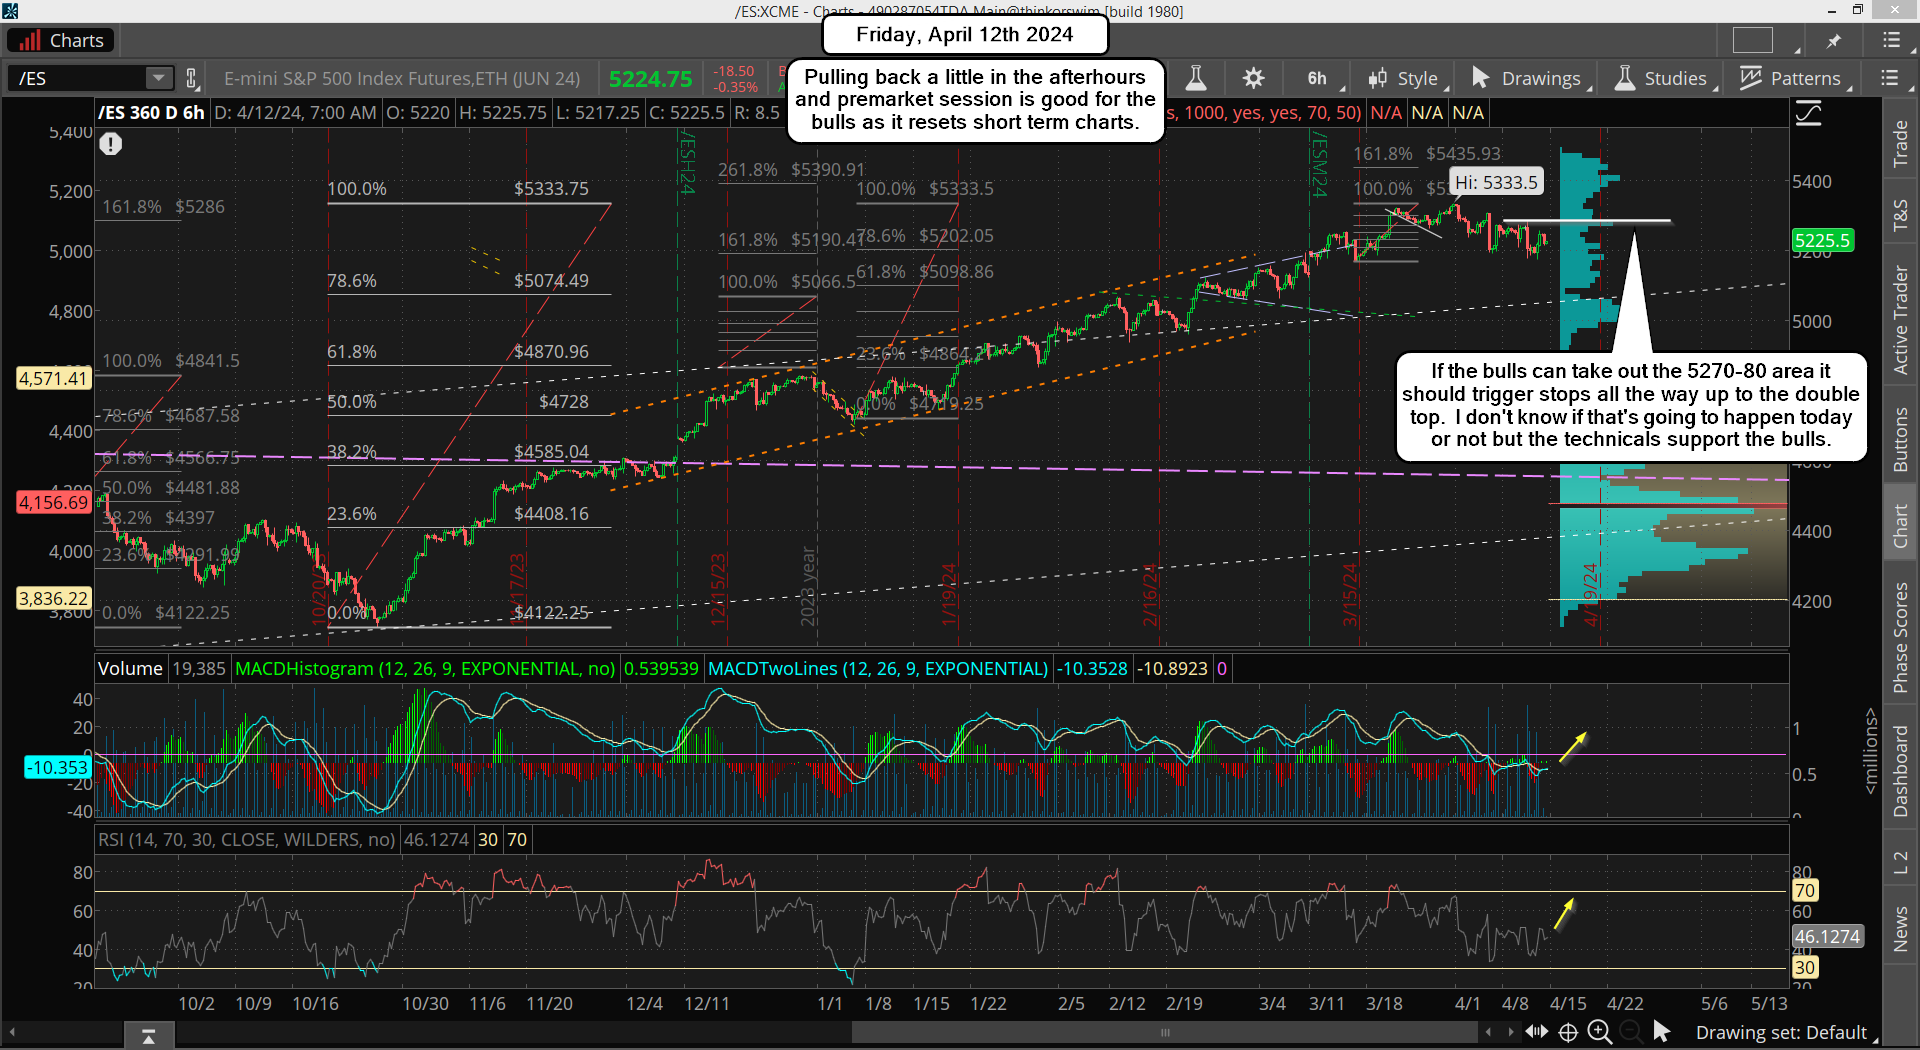
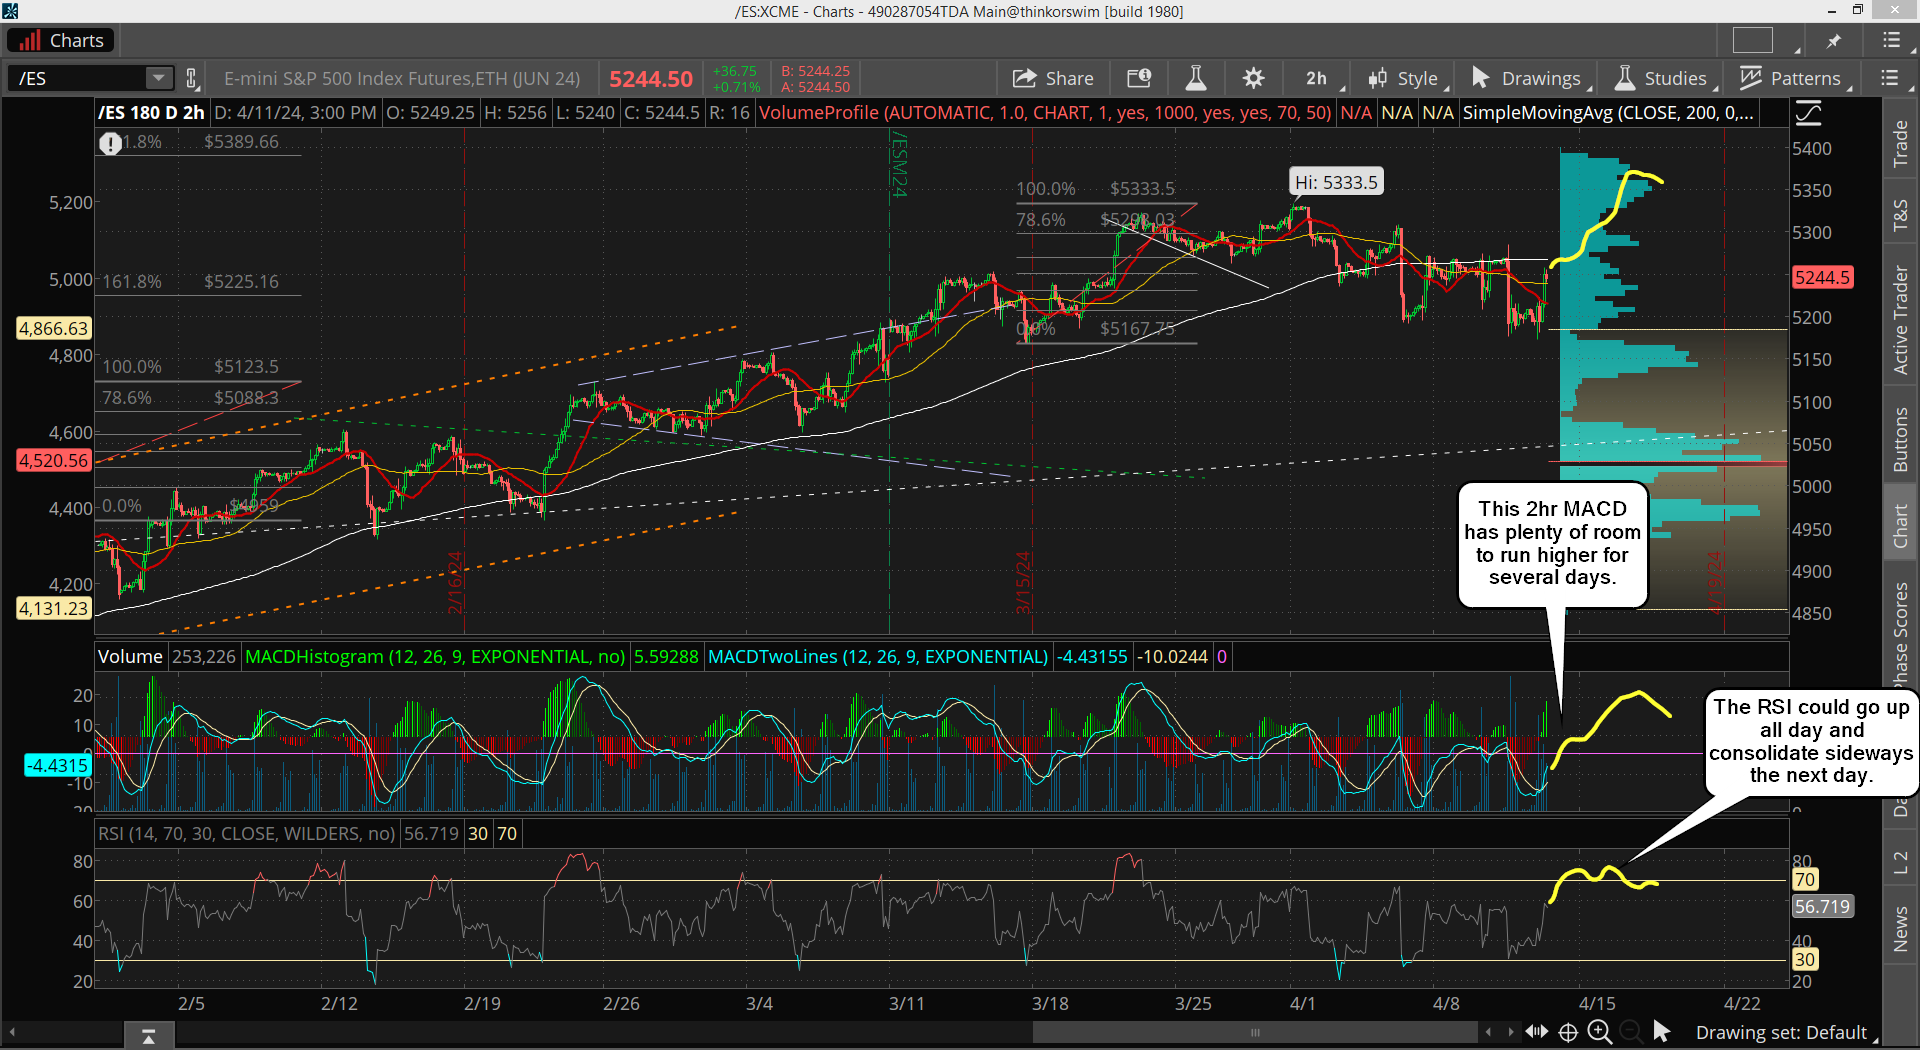
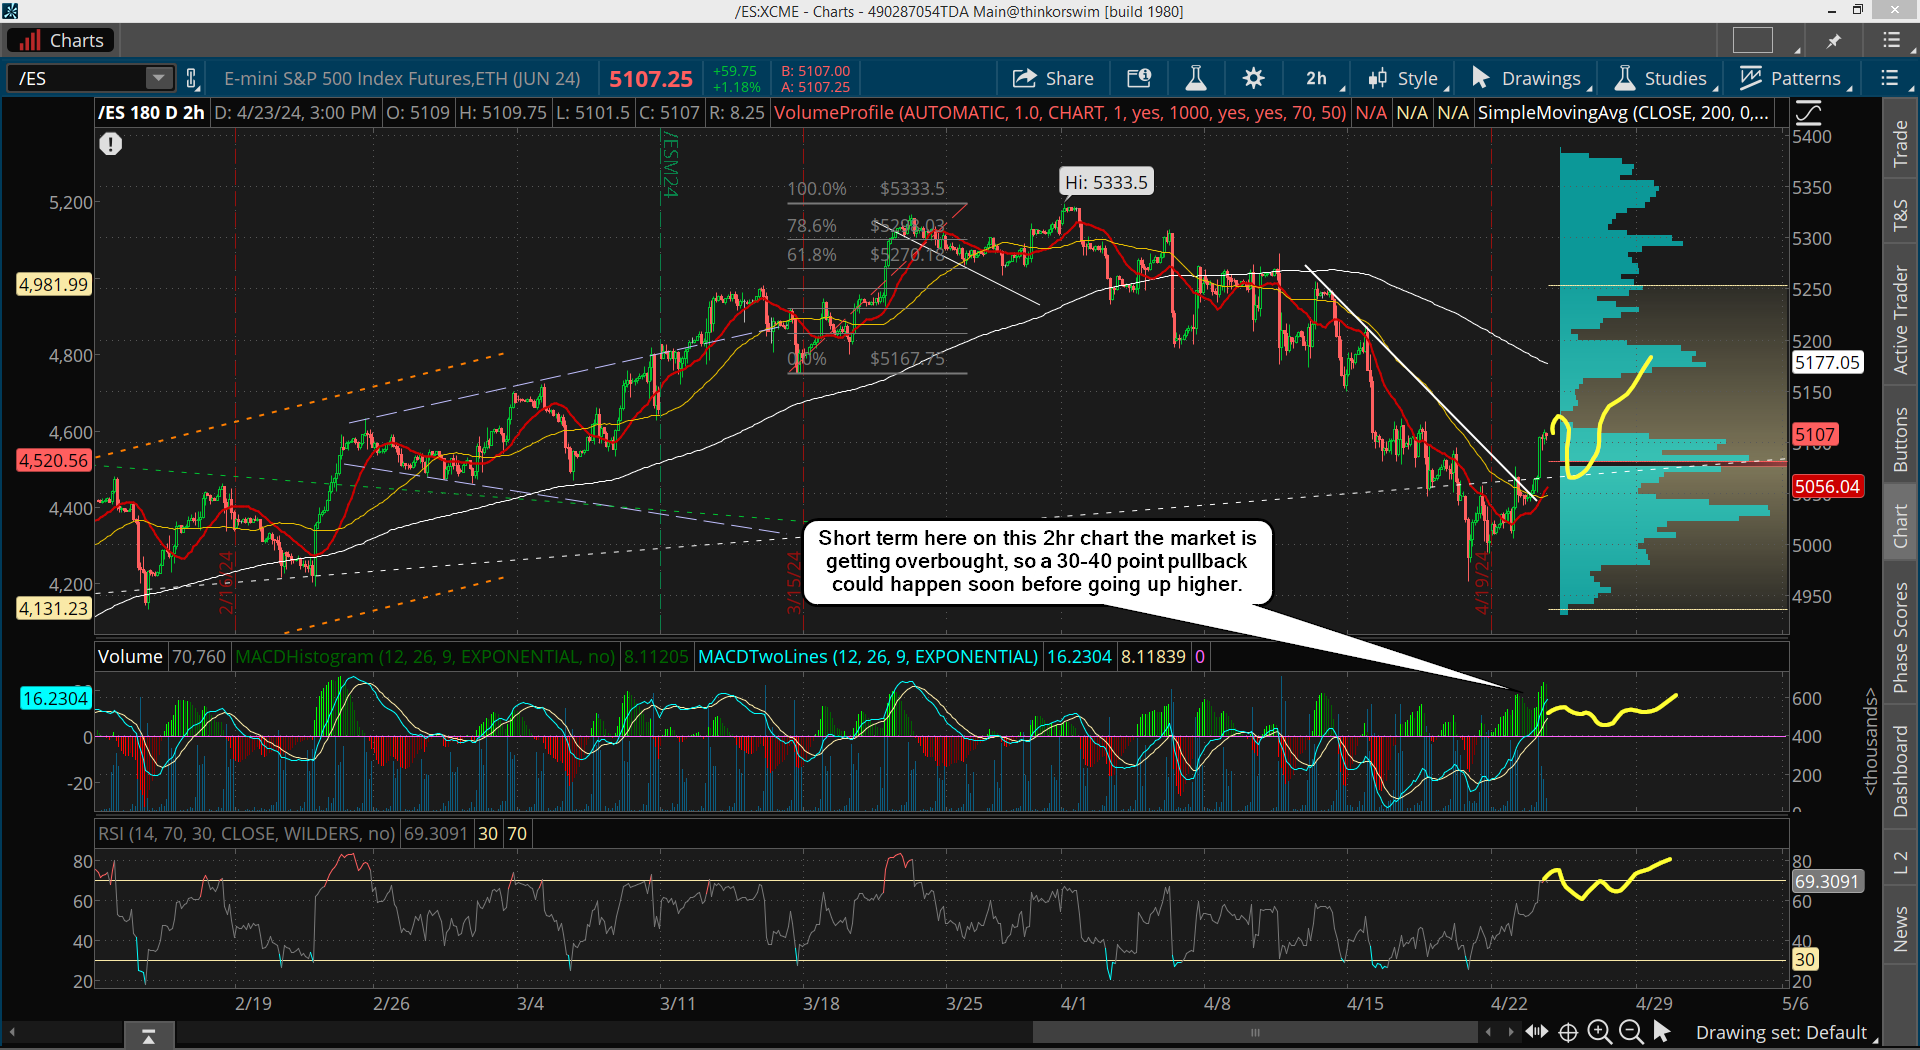
The market appears to have bottomed now as I was thinking it would. Looking at the 2hr, 6hr and daily chart the all support a lot more upside. While bears are likely shorting this bounce I don't see again big drop. The technicals look very bullish now The 2hr chart below looks bottomed to me.

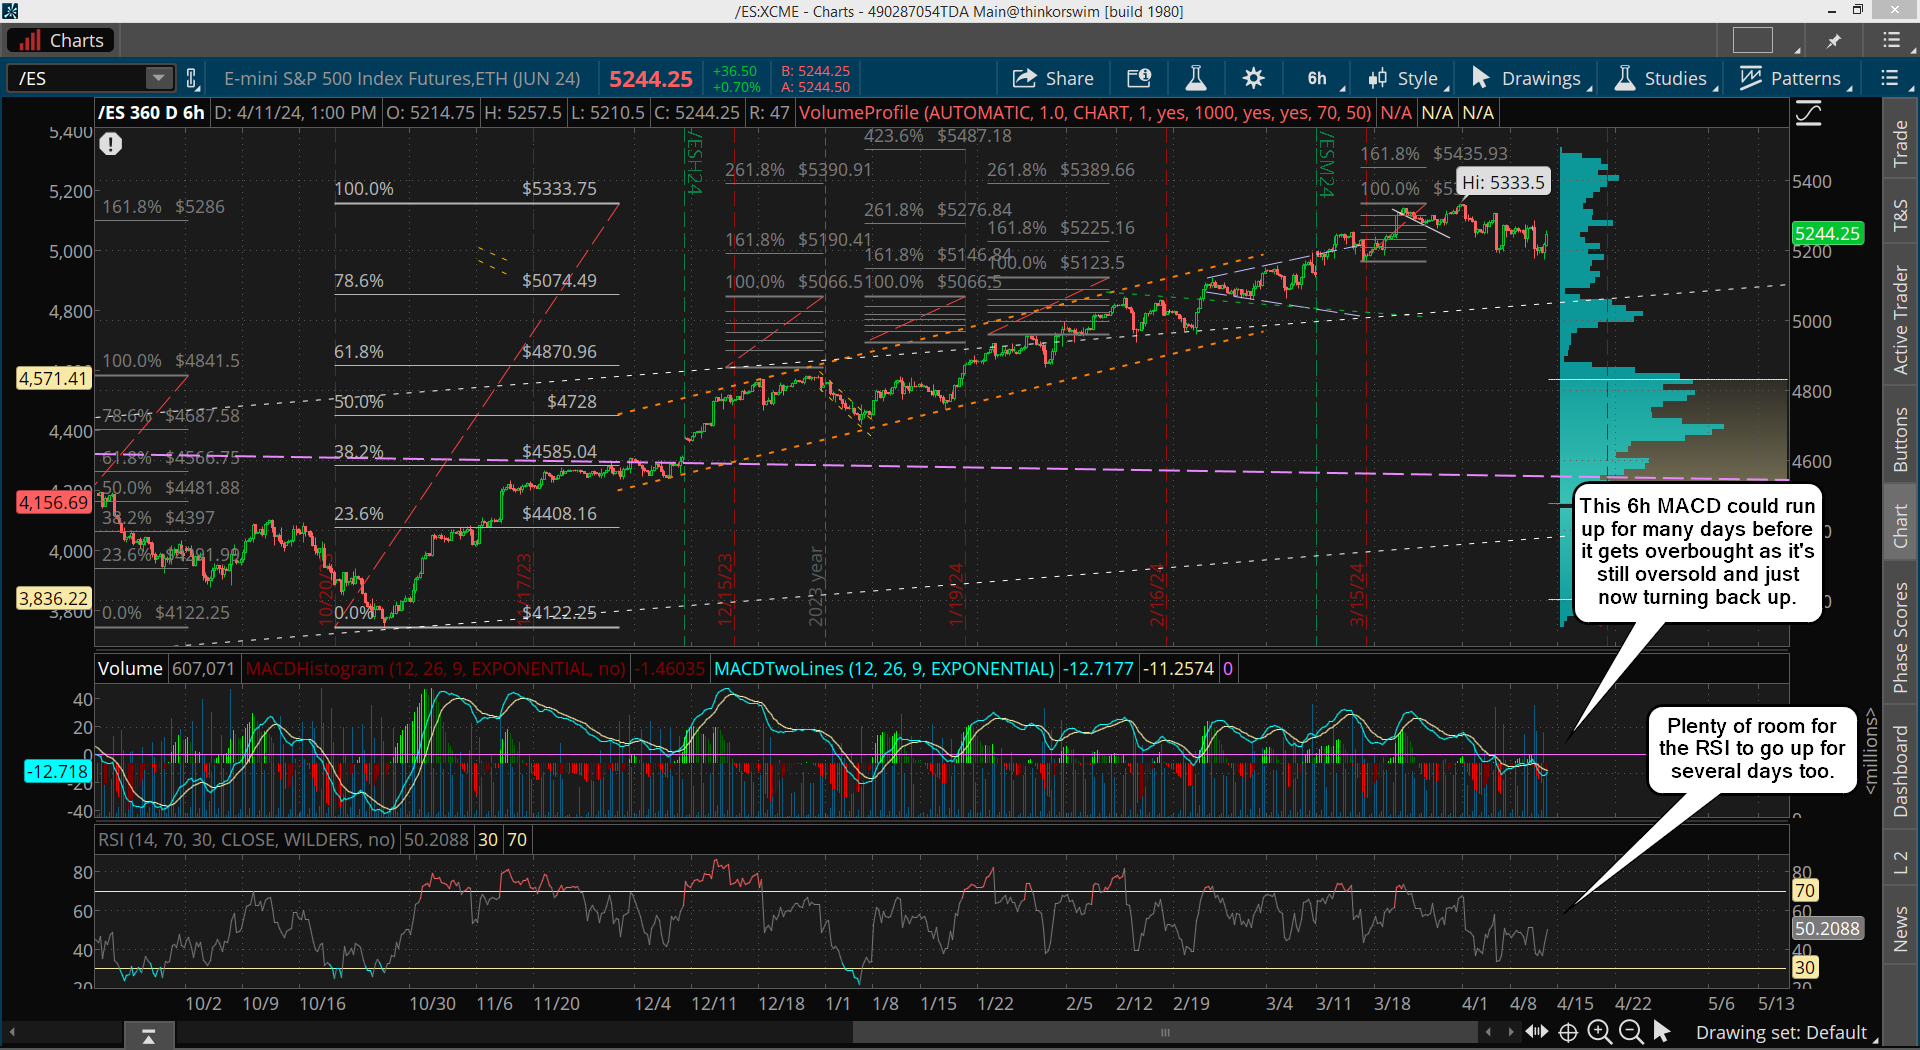
And here on the 6hr hour chart the MACD and RSI have plenty of room to run up higher today and early next week.

The daily chart never reached oversold, but that's normal in a strong bull market, which we are still in I think. The RSI reached the 50% mark and turned back up yesterday, but the MACD's haven't yet made that turn. That doesn't mean it won't, and it is a lagging indicator, so another 1-2 days of upside should hook it back up.

The entire week plus correction is a bull flag as well, so unless some other big negative news comes out I see no reason to expect any more downside. I went in to detail yesterday on "why" this pullback does have any of the patterns that real corrections have. Everything says it's just a pullback and not some 5-10% correction.

As for the weekly chart, it's still very overbought, but there's NO negative divergence on it, so I suspect we are going up into June or so "in price" and down on the MACD "in volume weight". The RSI will likely go down too as the market goes up.

Have a blessed day.
s2Member®