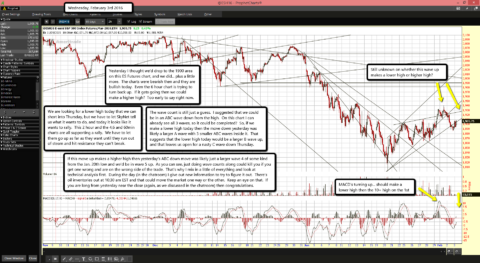
 Still unknown on whether this wave up makes a lower high or higher high?
MACD's turning up... should make a lower high then the 10+ high on the 1st
Yesterday I thought we'd drop to the 1900 area on this ES Futures chart, and we did... plus a little more. The charts were bearish then and they are bullish today. Even the 6 hour chart is trying to turn back up. If it gets going then we could make a higher high? Too early to say right now.
We are looking for a lower high today that we can short into Thursday, but we have to let SkyNet tell us what it wants to do, and today it looks like it wants to rally. This 2 hour and the 4,6 and 60min charts are all supporting a rally. We have to let them go up as far as they want until they run out of steam and hit resistance they can't break.
The wave count is still just a guess. I suggested that we could be in an ABC wave down from the high. On this chart I can already see all 3 waves, so it could be completed? So, if we make a lower high today then the move down yesterday was likely a larger A wave with 3 smaller ABC waves inside it. That suggests that the lower high today would be a larger B wave up, and that leaves us open for a nasty C wave down Thursday.
If this move up makes a higher high then yesterday's ABC down move was likely just a larger wave 4 of some kind from the Jan. 20th low and we'd be in wave 5 up. As you can see, just doing wave counts along could kill you if you get one wrong and are on the wrong side of the trade. That's why I mix in a little of everything and look at technical analysis first. During the day (in the chatroom) I give out new information to try to figure it out. There's oil inventories out at 10:30 am EST and that could move the market one way or the other. Keep an eye on that. If you are long from yesterday near the close (again, as we discussed in the chatroom) then congratulations.


