
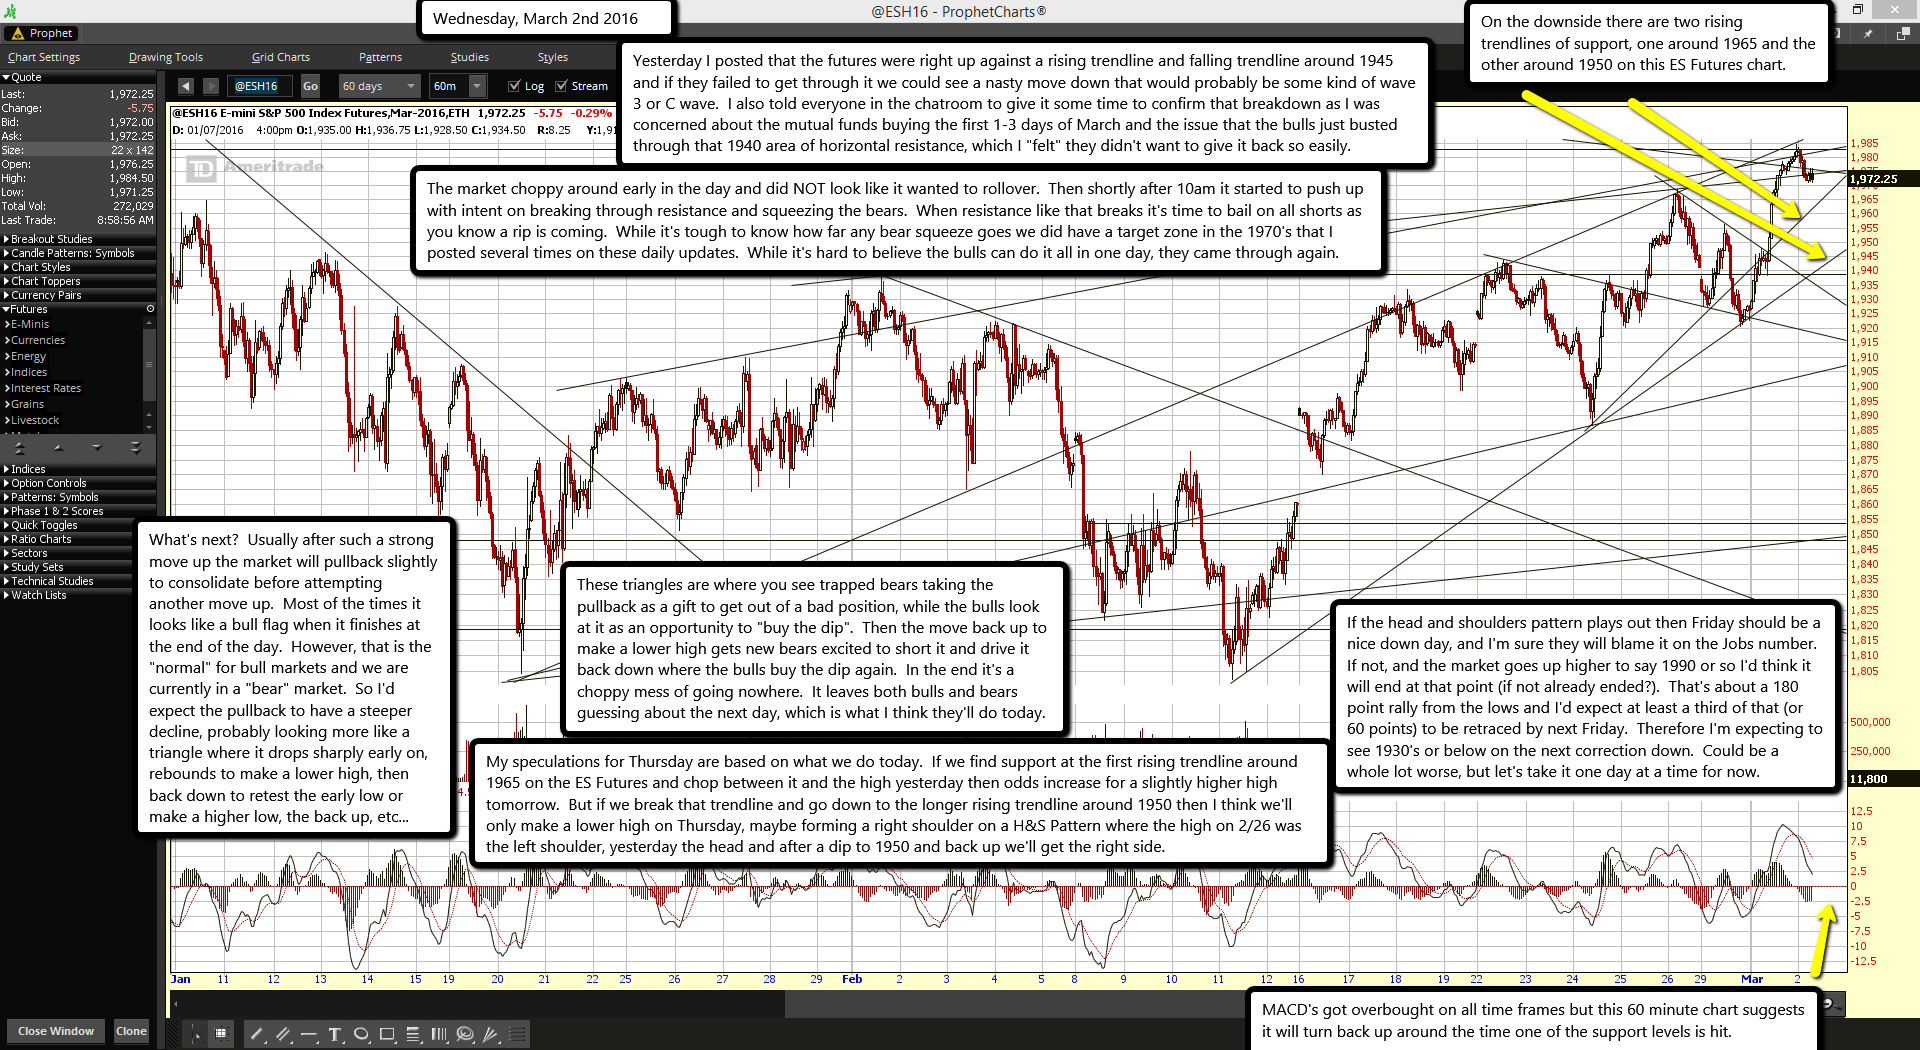
 On the downside there are two rising trendlines of support, one around 1965 and the other around 1950 on this ES Futures chart.
MACD's got overbought on all time frames but this 60 minute chart suggests it will turn back up around the time one of the support levels is hit.
Yesterday I posted that the futures were right up against a rising trendline and falling trendline around 1945 and if they failed to get through it we could see a nasty move down that would probably be some kind of wave 3 or C wave. I also told everyone in the chatroom to give it some time to confirm that breakdown as I was concerned about the mutual funds buying the first 1-3 days of March and the issue that the bulls just busted through that 1940 area of horizontal resistance, which I "felt" they didn't want to give it back so easily.
The market choppy around early in the day and did NOT look like it wanted to rollover. Then shortly after 10am it started to push up with intent on breaking through resistance and squeezing the bears. When resistance like that breaks it's time to bail on all shorts as you know a rip is coming. While it's tough to know how far any bear squeeze goes we did have a target zone in the 1970's that I posted several times on these daily updates. While it's hard to believe the bulls can do it all in one day, they came through again.
What's next? Usually after such a strong move up the market will pullback slightly to consolidate before attempting another move up. Most of the times it looks like a bull flag when it finishes at the end of the day. However, that is the "normal" for bull markets and we are currently in a "bear" market. So I'd expect the pullback to have a steeper decline, probably looking more like a triangle where it drops sharply early on, rebounds to make a lower high, then back down to retest the early low or make a higher low, the back up, etc...
These triangles are where you see trapped bears taking the pullback as a gift to get out of a bad position, while the bulls look at it as an opportunity to "buy the dip". Then the move back up to make a lower high gets new bears excited to short it and drive it back down where the bulls buy the dip again. In the end it's a choppy mess of going nowhere. It leaves both bulls and bears guessing about the next day, which is what I think they'll do today.
My speculations for Thursday are based on what we do today. If we find support at the first rising trendline around 1965 on the ES Futures and chop between it and the high yesterday then odds increase for a slightly higher high tomorrow. But if we break that trendline and go down to the longer rising trendline around 1950 then I think we'll only make a lower high on Thursday, maybe forming a right shoulder on a H&S Pattern where the high on 2/26 was the left shoulder, yesterday the head and after a dip to 1950 and back up we'll get the right side.
If the head and shoulders pattern plays out then Friday should be a nice down day, and I'm sure they will blame it on the Jobs number. If not, and the market goes up higher to say 1990 or so I'd think it will end at that point (if not already ended?). That's about a 180 point rally from the lows and I'd expect at least a third of that (or 60 points) to be retraced by next Friday. Therefore I'm expecting to see 1930's or below on the next correction down. Could be a whole lot worse, but let's take it one day at a time for now.

