
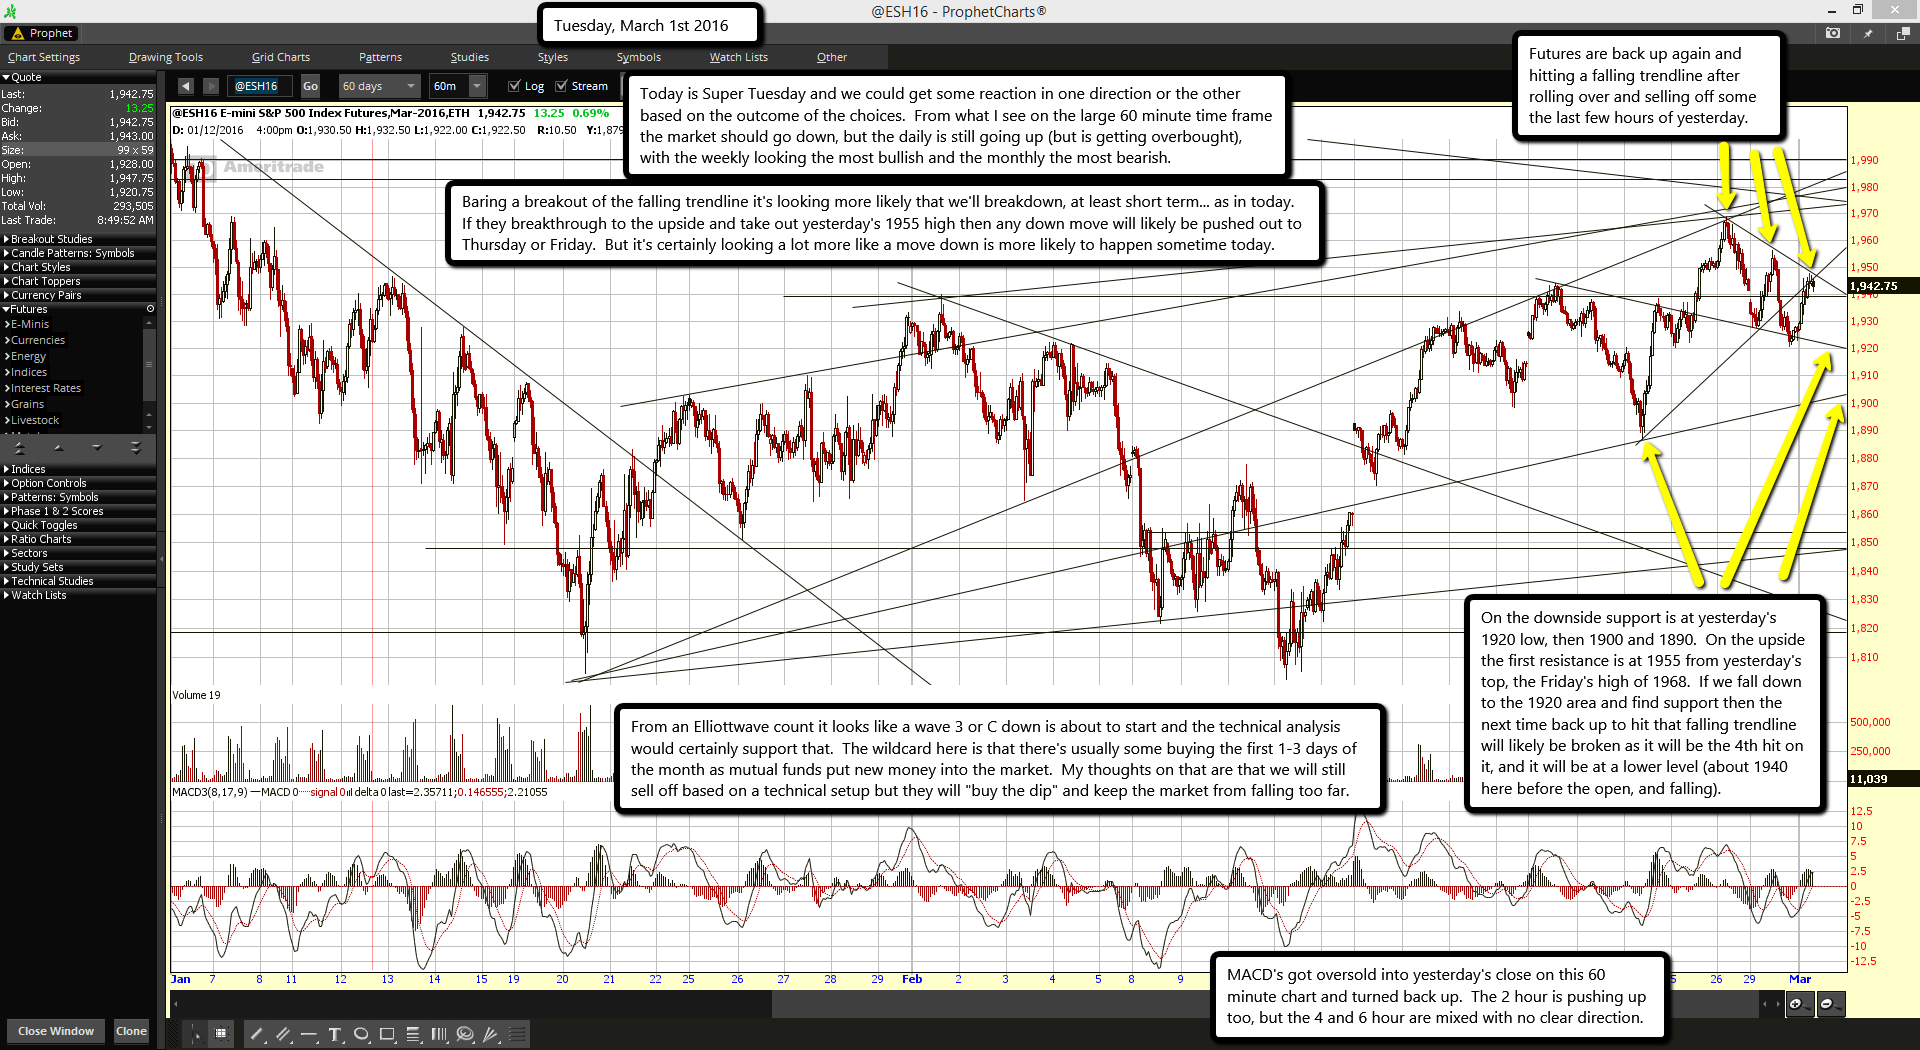
 Futures are back up again and hitting a falling trendline after rolling over and selling off some the last few hours of yesterday.
MACD's got oversold into yesterday's close on this 60 minute chart and turned back up. The 2 hour is pushing up too, but the 4 and 6 hour are mixed with no clear direction.
Today is Super Tuesday and we could get some reaction in one direction or the other based on the outcome of the choices. From what I see on the large 60 minute time frame the market should go down, but the daily is still going up (but is getting overbought), with the weekly looking the most bullish and the monthly the most bearish.
Baring a breakout of the falling trendline it's looking more likely that we'll breakdown, at least short term... as in today. If they breakthrough to the upside and take out yesterday's 1955 high then any down move will likely be pushed out to Thursday or Friday. But it's certainly looking a lot more like a move down is more likely to happen sometime today.
From an Elliottwave count it looks like a wave 3 or C down is about to start and the technical analysis would certainly support that. The wildcard here is that there's usually some buying the first 1-3 days of the month as mutual funds put new money into the market. My thoughts on that are that we will still sell off based on a technical setup but they will "buy the dip" and keep the market from falling too far.
On the downside support is at yesterday's 1920 low, then 1900 and 1890. On the upside the first resistance is at 1955 from yesterday's top, the Friday's high of 1968. If we fall down to the 1920 area and find support then the next time back up to hit that falling trendline will likely be broken as it will be the 4th hit on it, and it will be at a lower level (about 1940 here before the open, and falling).
This whole week is getting support from the strength of the weekly chart push up strongly in my opinion and will limit the down moves. But there's heavy resistance overhead in the 1970's on this ES Futures chart, which I don't see broken any time this week. Maybe we get up close to it later this week? It's possible, but all of the smaller time frames want to go back down. This makes for a chop week as every time they try to fall the weekly chart saves them and pushes back up. For now, it's a day traders market. Sell resistance and buy support.

