
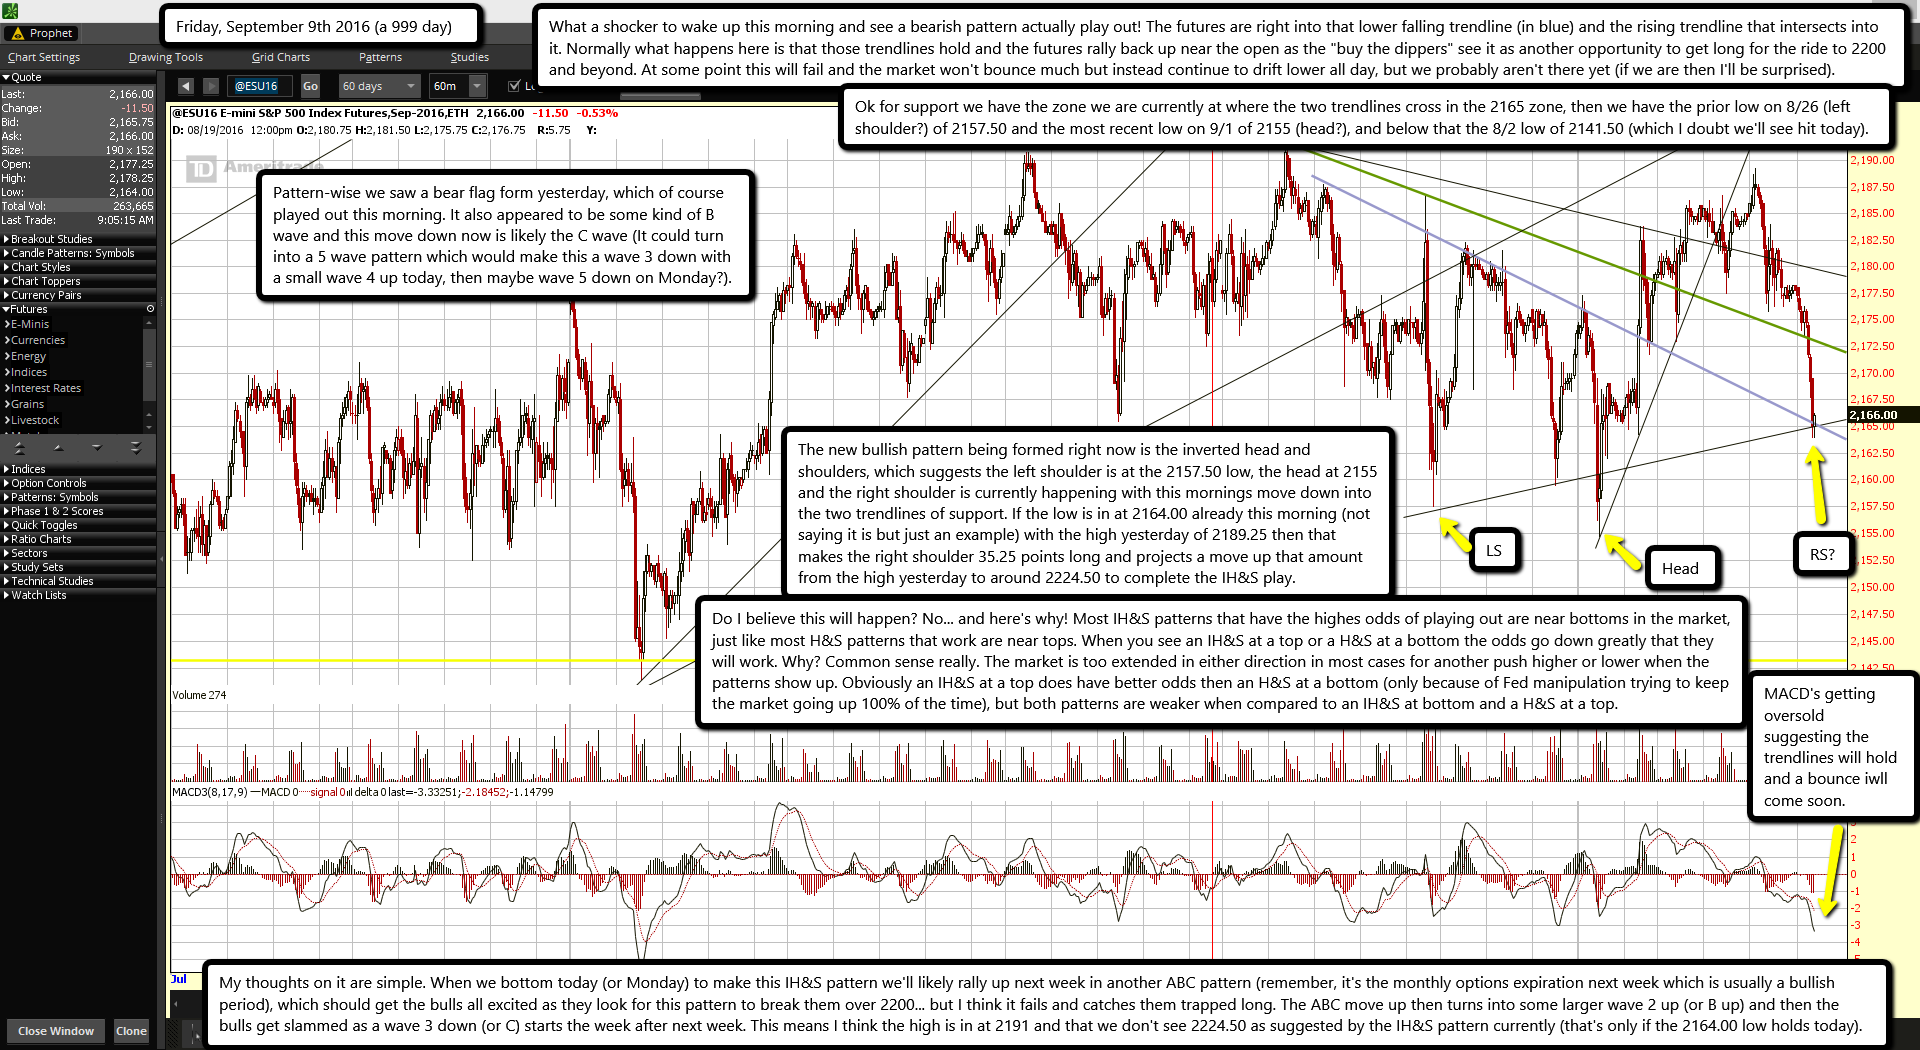
What a shocker to wake up this morning and see a bearish pattern actually play out! The futures are right into that lower falling trendline (in blue) and the rising trendline that intersects into it. Normally what happens here is that those trendlines hold and the futures rally back up near the open as the "buy the dippers" see it as another opportunity to get long for the ride to 2200 and beyond. At some point this will fail and the market won't bounce much but instead continue to drift lower all day, but we probably aren't there yet (if we are then I'll be surprised).
Ok for support we have the zone we are currently at where the two trendlines cross in the 2165 zone, then we have the prior low on 8/26 (left shoulder?) of 2157.50 and the most recent low on 9/1 of 2155 (head?), and below that the 8/2 low of 2141.50 (which I doubt we'll see hit today).
Pattern-wise we saw a bear flag form yesterday, which of course played out this morning. It also appeared to be some kind of B wave and this move down now is likely the C wave (It could turn into a 5 wave pattern which would make this a wave 3 down with a small wave 4 up today, then maybe wave 5 down on Monday?).
The new bullish pattern being formed right now is the inverted head and shoulders, which suggests the left shoulder is at the 2157.50 low, the head at 2155 and the right shoulder is currently happening with this mornings move down into the two trendlines of support. If the low is in at 2164.00 already this morning (not saying it is but just an example) with the high yesterday of 2189.25 then that makes the right shoulder 35.25 points long and projects a move up that amount from the high yesterday to around 2224.50 to complete the IH&S play.
Do I believe this will happen? No... and here's why! Most IH&S patterns that have the highes odds of playing out are near bottoms in the market, just like most H&S patterns that work are near tops. When you see an IH&S at a top or a H&S at a bottom the odds go down greatly that they will work. Why? Common sense really. The market is too extended in either direction in most cases for another push higher or lower when the patterns show up. Obviously an IH&S at a top does have better odds then an H&S at a bottom (only because of Fed manipulation trying to keep the market going up 100% of the time), but both patterns are weaker when compared to an IH&S at bottom and a H&S at a top.
My thoughts on it are simple. When we bottom today (or Monday) to make this IH&S pattern we'll likely rally up next week in another ABC pattern (remember, it's the monthly options expiration next week which is usually a bullish period), which should get the bulls all excited as they look for this pattern to break them over 2200... but I think it fails and catches them trapped long. The ABC move up then turns into some larger wave 2 up (or B up) and then the bulls get slammed as a wave 3 down (or C) starts the week after next week. This means I think the high is in at 2191 and that we don't see 2224.50 as suggested by the IH&S pattern currently (that's only if the 2164.00 low holds today).

