
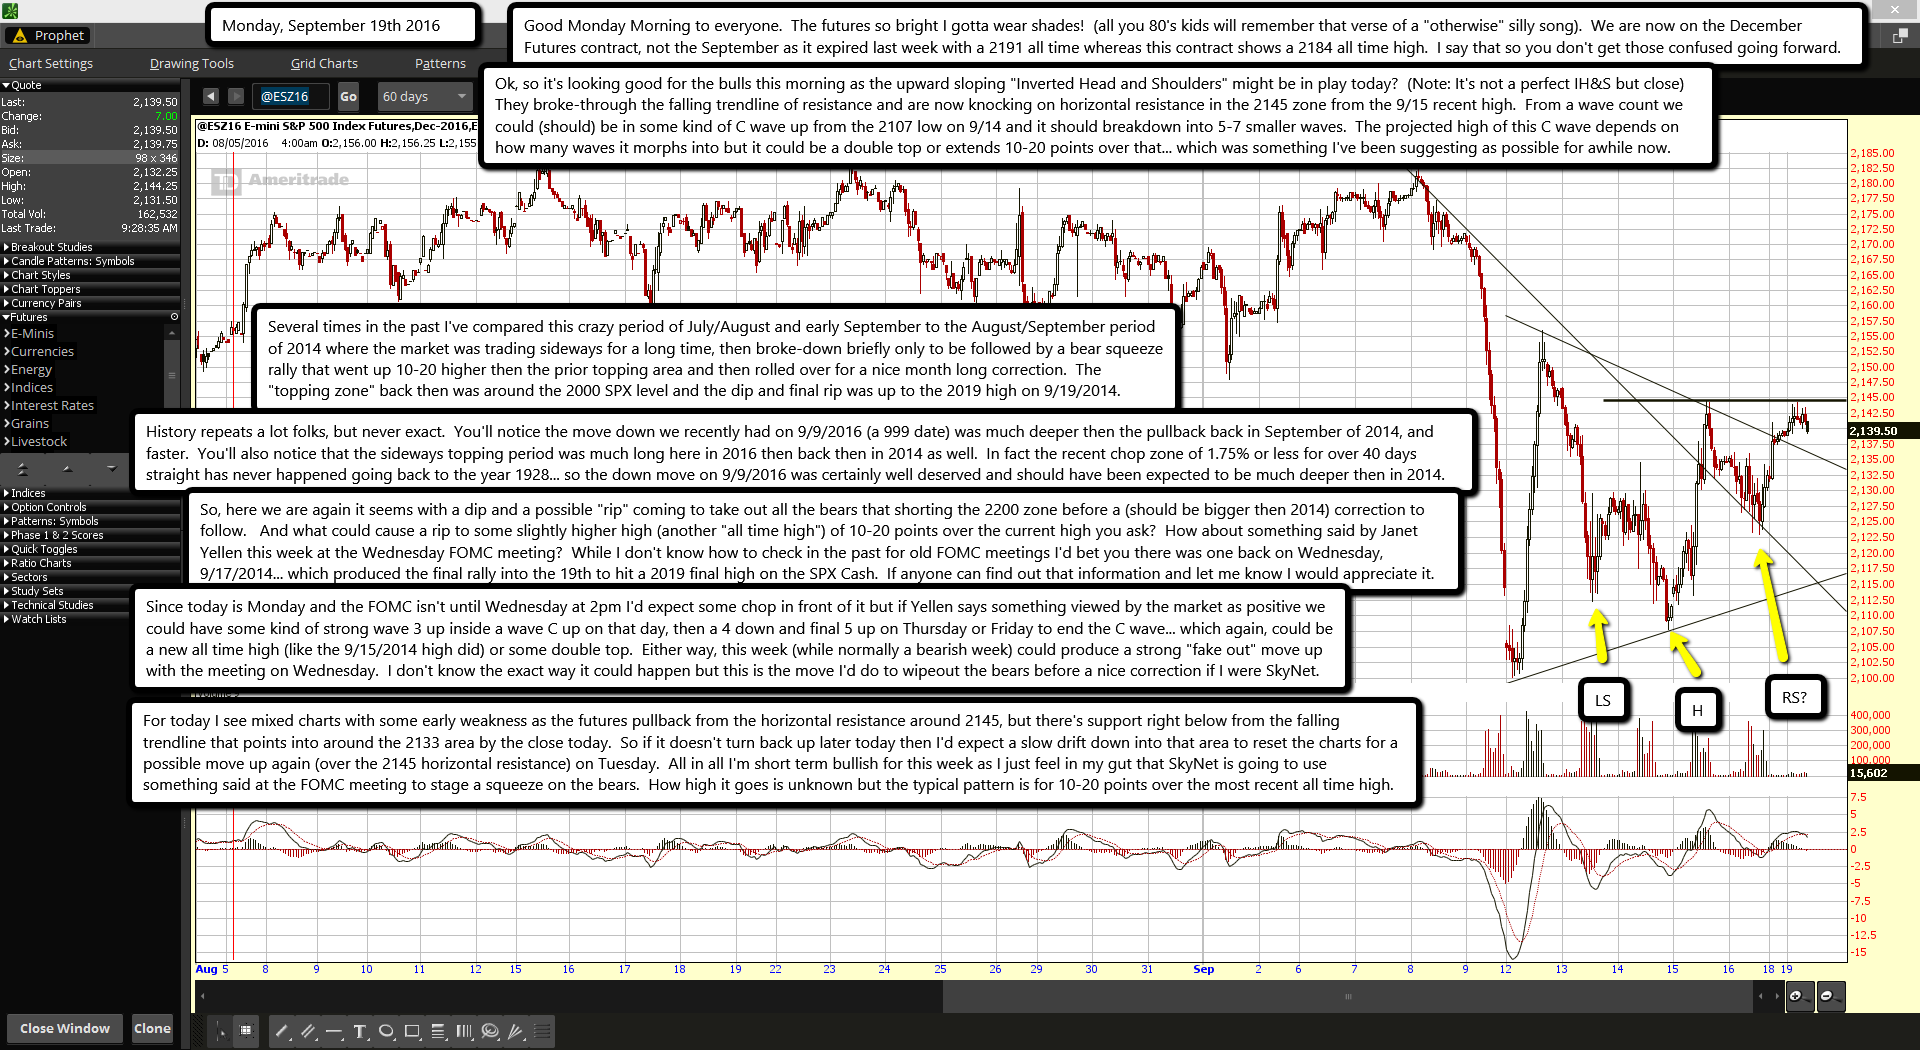
Good Monday Morning to everyone. The futures so bright I gotta wear shades! (all you 80's kids will remember that verse of a "otherwise" silly song). We are now on the December Futures contract, not the September as it expired last week with a 2191 all time whereas this contract shows a 2184 all time high. I say that so you don't get those confused going forward.
Ok, so it's looking good for the bulls this morning as the upward sloping "Inverted Head and Shoulders" might be in play today? (Note: It's not a perfect IH&S but close) They broke-through the falling trendline of resistance and are now knocking on horizontal resistance in the 2145 zone from the 9/15 recent high. From a wave count we could (should) be in some kind of C wave up from the 2107 low on 9/14 and it should breakdown into 5-7 smaller waves. The projected high of this C wave depends on how many waves it morphs into but it could be a double top or extends 10-20 points over that... which was something I've been suggesting as possible for awhile now.
Several times in the past I've compared this crazy period of July/August and early September to the August/September period of 2014 where the market was trading sideways for a long time, then broke-down briefly only to be followed by a bear squeeze rally that went up 10-20 higher then the prior topping area and then rolled over for a nice month long correction. The "topping zone" back then was around the 2000 SPX level and the dip and final rip was up to the 2019 high on 9/19/2014.
History repeats a lot folks, but never exact. You'll notice the move down we recently had on 9/9/2016 (a 999 date) was much deeper then the pullback back in September of 2014, and faster. You'll also notice that the sideways topping period was much long here in 2016 then back then in 2014 as well. In fact the recent chop zone of 1.75% or less for over 40 days straight has never happened going back to the year 1928... so the down move on 9/9/2016 was certainly well deserved and should have been expected to be much deeper then in 2014.
So, here we are again it seems with a dip and a possible "rip" coming to take out all the bears that shorting the 2200 zone before a (should be bigger then 2014) correction to follow. And what could cause a rip to some slightly higher high (another "all time high") of 10-20 points over the current high you ask? How about something said by Janet Yellen this week at the Wednesday FOMC meeting? While I don't know how to check in the past for old FOMC meetings I'd bet you there was one back on Wednesday, 9/17/2014... which produced the final rally into the 19th to hit a 2019 final high on the SPX Cash. If anyone can find out that information and let me know I would appreciate it.
Since today is Monday and the FOMC isn't until Wednesday at 2pm I'd expect some chop in front of it but if Yellen says something viewed by the market as positive we could have some kind of strong wave 3 up inside a wave C up on that day, then a 4 down and final 5 up on Thursday or Friday to end the C wave... which again, could be a new all time high (like the 9/15/2014 high did) or some double top. Either way, this week (while normally a bearish week) could produce a strong "fake out" move up with the meeting on Wednesday. I don't know the exact way it could happen but this is the move I'd do to wipeout the bears before a nice correction if I were SkyNet.
For today I see mixed charts with some early weakness as the futures pullback from the horizontal resistance around 2145, but there's support right below from the falling trendline that points into around the 2133 area by the close today. So if it doesn't turn back up later today then I'd expect a slow drift down into that area to reset the charts for a possible move up again (over the 2145 horizontal resistance) on Tuesday. All in all I'm short term bullish for this week as I just feel in my gut that SkyNet is going to use something said at the FOMC meeting to stage a squeeze on the bears. How high it goes is unknown but the typical pattern is for 10-20 points over the most recent all time high.

