
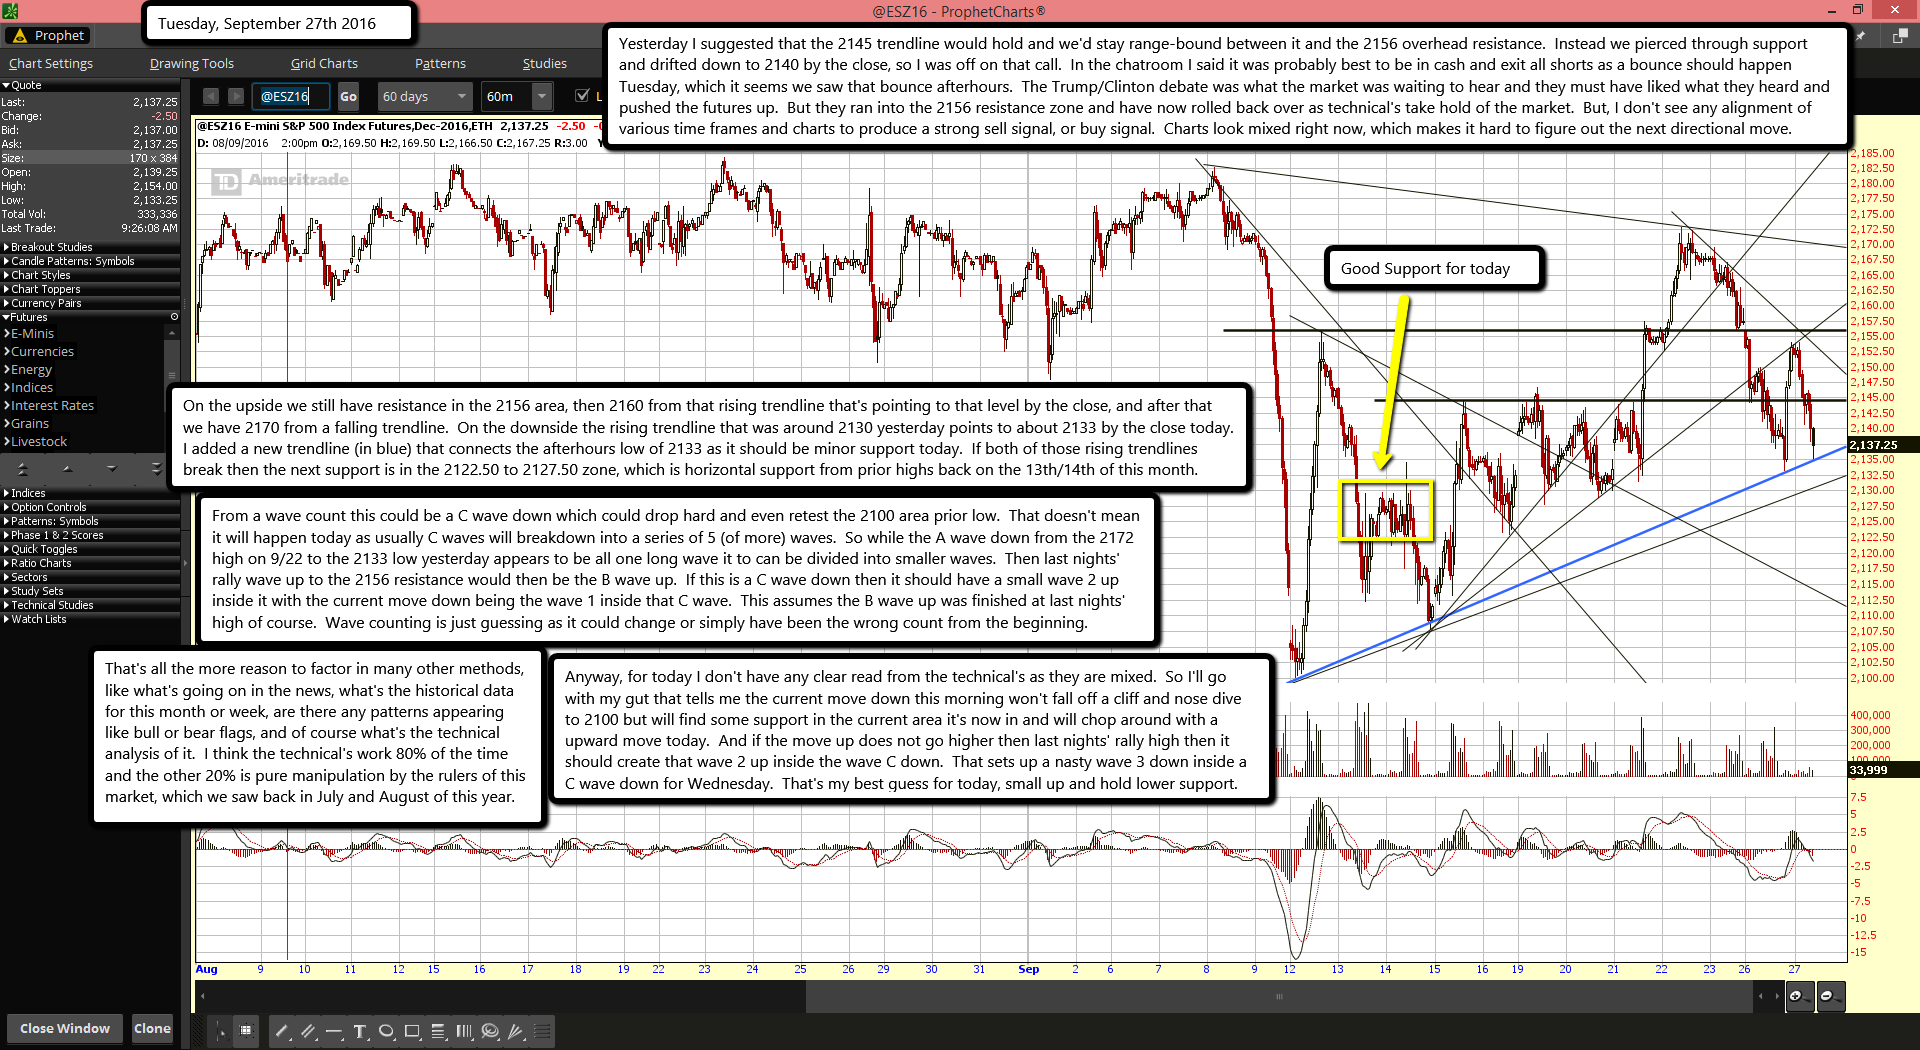
Yesterday I suggested that the 2145 trendline would hold and we'd stay range-bound between it and the 2156 overhead resistance. Instead we pierced through support and drifted down to 2140 by the close, so I was off on that call. In the chatroom I said it was probably best to be in cash and exit all shorts as a bounce should happen Tuesday, which it seems we saw that bounce afterhours. The Trump/Clinton debate was what the market was waiting to hear and they must have liked what they heard and pushed the futures up. But they ran into the 2156 resistance zone and have now rolled back over as technical's take hold of the market. But, I don't see any alignment of various time frames and charts to produce a strong sell signal, or buy signal. Charts look mixed right now, which makes it hard to figure out the next directional move.
On the upside we still have resistance in the 2156 area, then 2160 from that rising trendline that's pointing to that level by the close, and after that we have 2170 from a falling trendline. On the downside the rising trendline that was around 2130 yesterday points to about 2133 by the close today. I added a new trendline (in blue) that connects the afterhours low of 2133 as it should be minor support today. If both of those rising trendlines break then the next support is in the 2122.50 to 2127.50 zone, which is horizontal support from prior highs back on the 13th/14th of this month.
From a wave count this could be a C wave down which could drop hard and even retest the 2100 area prior low. That doesn't mean it will happen today as usually C waves will breakdown into a series of 5 (of more) waves. So while the A wave down from the 2172 high on 9/22 to the 2133 low yesterday appears to be all one long wave it to can be divided into smaller waves. Then last nights' rally wave up to the 2156 resistance would then be the B wave up. If this is a C wave down then it should have a small wave 2 up inside it with the current move down being the wave 1 inside that C wave. This assumes the B wave up was finished at last nights' high of course. Wave counting is just guessing as it could change or simply have been the wrong count from the beginning.
That's all the more reason to factor in many other methods, like what's going on in the news, what's the historical data for this month or week, are there any patterns appearing like bull or bear flags, and of course what's the technical analysis of it. I think the technical's work 80% of the time and the other 20% is pure manipulation by the rulers of this market, which we saw back in July and August of this year.
Anyway, for today I don't have any clear read from the technical's as they are mixed. So I'll go with my gut that tells me the current move down this morning won't fall off a cliff and nose dive to 2100 but will find some support in the current area it's now in and will chop around with a upward move today. And if the move up does not go higher then last nights' rally high then it should create that wave 2 up inside the wave C down. That sets up a nasty wave 3 down inside a C wave down for Wednesday. That's my best guess for today, small up and hold lower support.

