
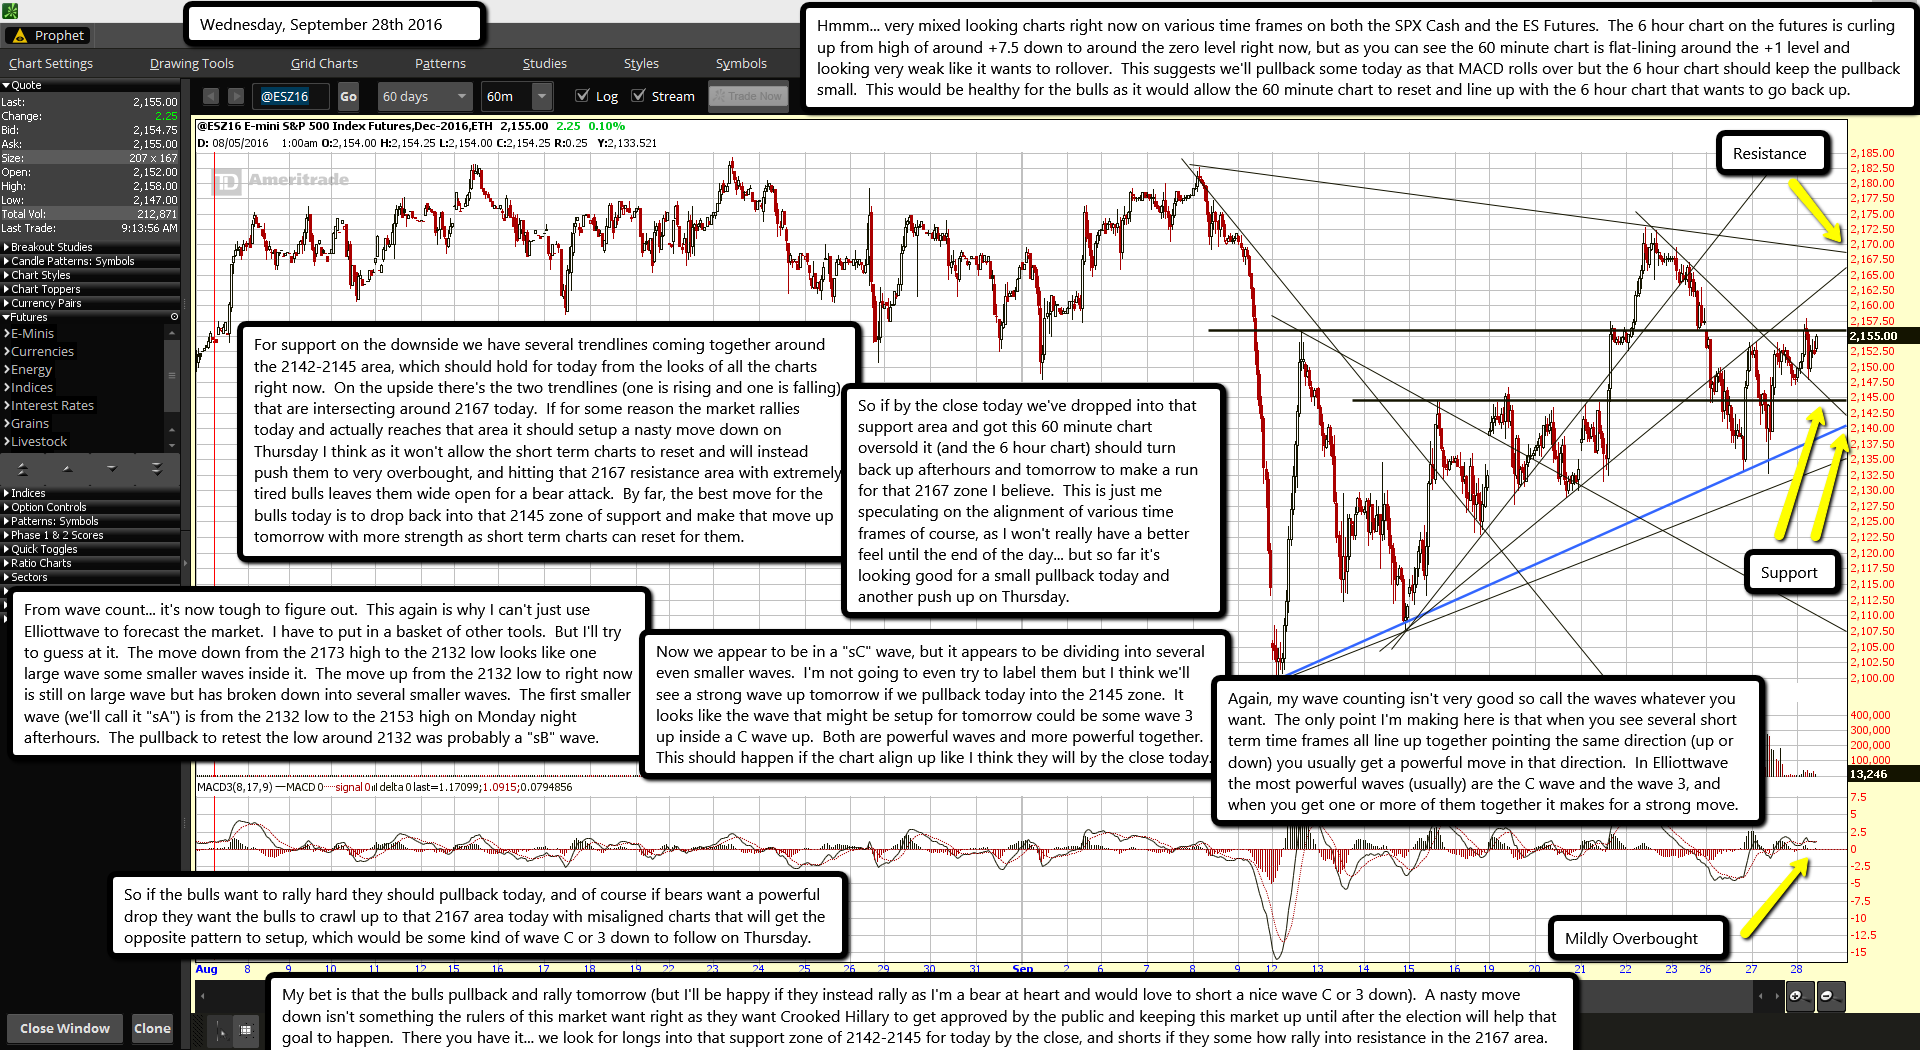
Hmmm... very mixed looking charts right now on various time frames on both the SPX Cash and the ES Futures. The 6 hour chart on the futures is curling up from high of around +7.5 down to around the zero level right now, but as you can see the 60 minute chart is flat-lining around the +1 level and looking very weak like it wants to rollover. This suggests we'll pullback some today as that MACD rolls over but the 6 hour chart should keep the pullback small. This would be healthy for the bulls as it would allow the 60 minute chart to reset and line up with the 6 hour chart that wants to go back up.
For support on the downside we have several trendlines coming together around the 2142-2145 area, which should hold for today from the looks of all the charts right now. On the upside there's the two trendlines (one is rising and one is falling) that are intersecting around 2167 today. If for some reason the market rallies today and actually reaches that area it should setup a nasty move down on Thursday I think as it won't allow the short term charts to reset and will instead push them to very overbought, and hitting that 2167 resistance area with extremely tired bulls leaves them wide open for a bear attack. By far, the best move for the bulls today is to drop back into that 2145 zone of support and make that move up tomorrow with more strength as short term charts can reset for them.
So if by the close today we've dropped into that support area and got this 60 minute chart oversold it (and the 6 hour chart) should turn back up afterhours and tomorrow to make a run for that 2167 zone I believe. This is just me speculating on the alignment of various time frames of course, as I won't really have a better feel until the end of the day... but so far it's looking good for a small pullback today and another push up on Thursday.
From wave count... it's now tough to figure out. This again is why I can't just use Elliottwave to forecast the market. I have to put in a basket of other tools. But I'll try to guess at it. The move down from the 2173 high to the 2132 low looks like one large wave some smaller waves inside it. The move up from the 2132 low to right now is still on large wave but has broken down into several smaller waves. The first smaller wave (we'll call it "sA") is from the 2132 low to the 2153 high on Monday night afterhours. The pullback to retest the low around 2132 was probably a "sB" wave.
Now we appear to be in a "sC" wave, but it appears to be dividing into several even smaller waves. I'm not going to even try to label them but I think we'll see a strong wave up tomorrow if we pullback today into the 2145 zone. It looks like the wave that might be setup for tomorrow could be some wave 3 up inside a C wave up. Both are powerful waves and more powerful together. This should happen if the chart align up like I think they will by the close today.
Again, my wave counting isn't very good so call the waves whatever you want. The only point I'm making here is that when you see several short term time frames all line up together pointing the same direction (up or down) you usually get a powerful move in that direction. In Elliottwave the most powerful waves (usually) are the C wave and the wave 3, and when you get one or more of them together it makes for a strong move.
So if the bulls want to rally hard they should pullback today, and of course if bears want a powerful drop they want the bulls to crawl up to that 2167 area today with misaligned charts that will get the opposite pattern to setup, which would be some kind of wave C or 3 down to follow on Thursday.
My bet is that the bulls pullback and rally tomorrow (but I'll be happy if they instead rally as I'm a bear at heart and would love to short a nice wave C or 3 down). A nasty move down isn't something the rulers of this market want right as they want Crooked Hillary to get approved by the public and keeping this market up until after the election will help that goal to happen. There you have it... we look for longs into that support zone of 2142-2145 for today by the close, and shorts if they some how rally into resistance in the 2167 area.

