
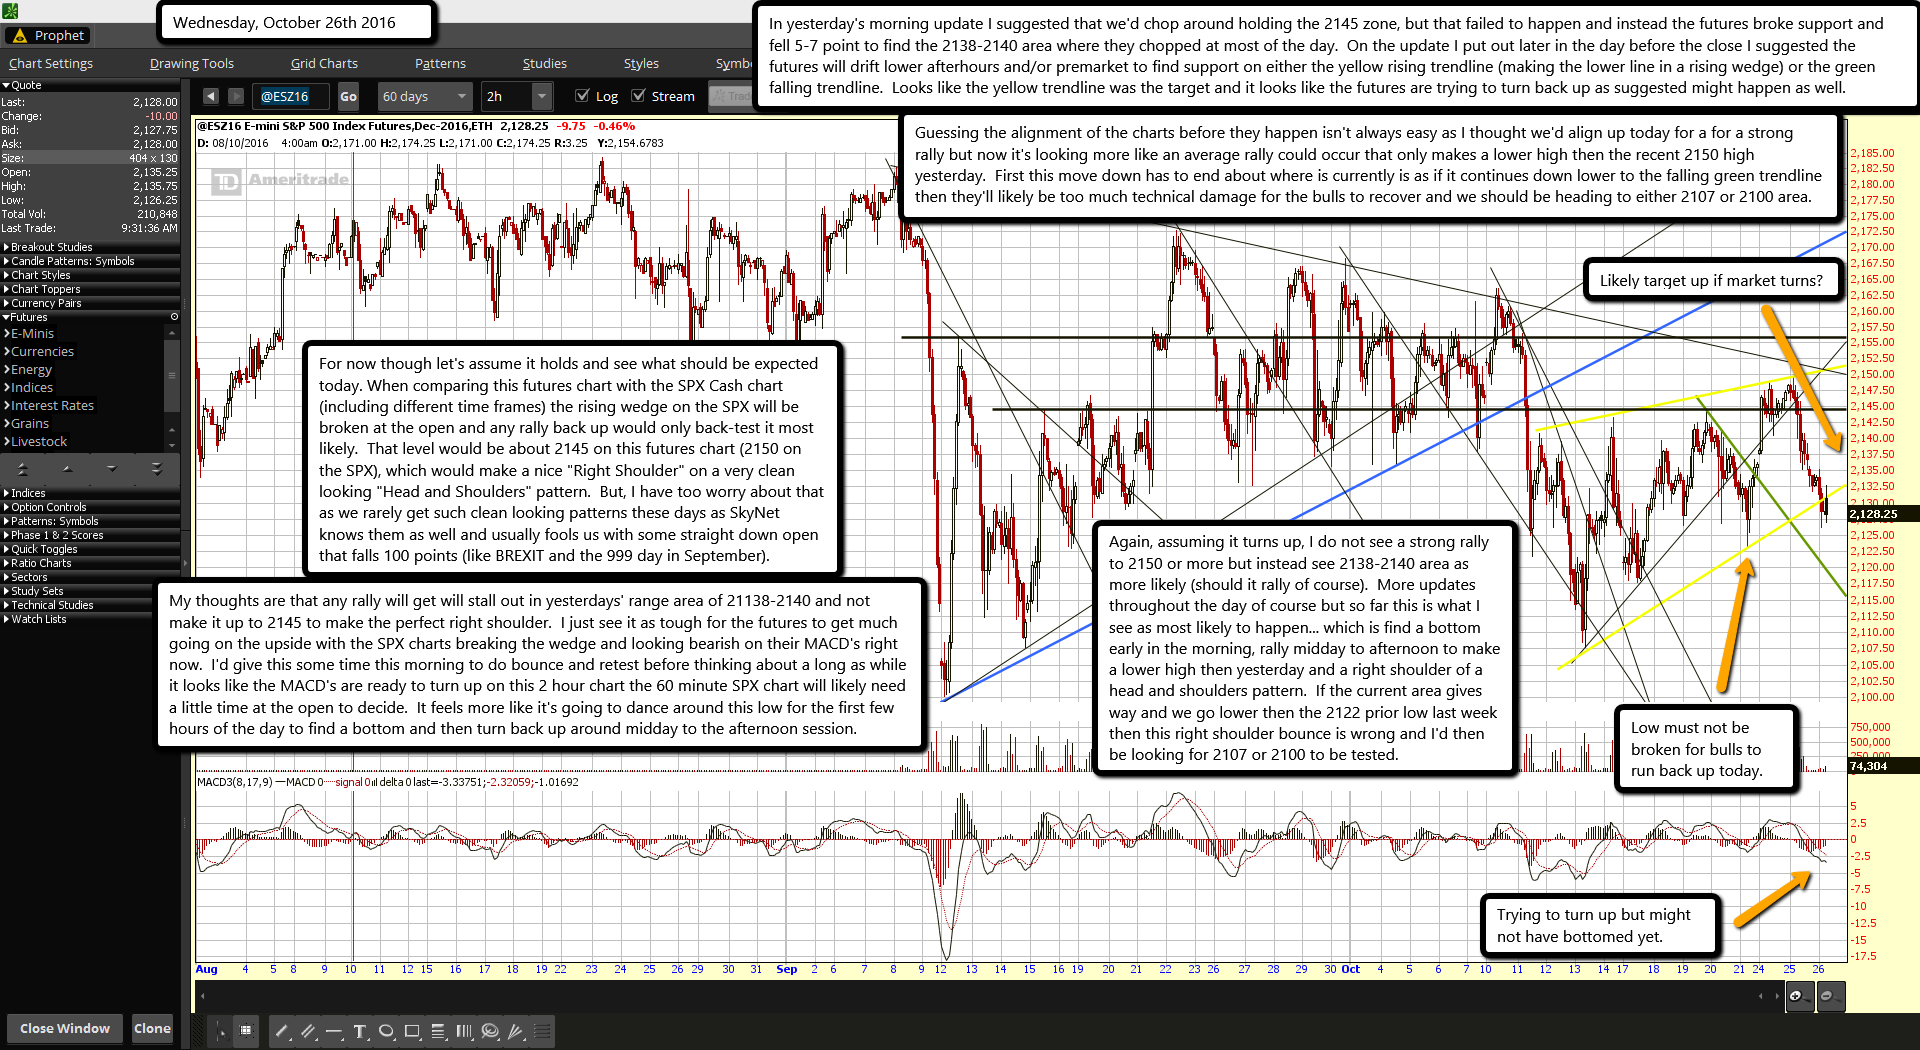
In yesterday's morning update I suggested that we'd chop around holding the 2145 zone, but that failed to happen and instead the futures broke support and fell 5-7 point to find the 2138-2140 area where they chopped at most of the day. On the update I put out later in the day before the close I suggested the futures will drift lower afterhours and/or premarket to find support on either the yellow rising trendline (making the lower line in a rising wedge) or the green falling trendline. Looks like the yellow trendline was the target and it looks like the futures are trying to turn back up as suggested might happen as well.
Guessing the alignment of the charts before they happen isn't always easy as I thought we'd align up today for a for a strong rally but now it's looking more like an average rally could occur that only makes a lower high then the recent 2150 high yesterday. First this move down has to end about where is currently is as if it continues down lower to the falling green trendline then they'll likely be too much technical damage for the bulls to recover and we should be heading to either 2107 or 2100 area.
For now though let's assume it holds and see what should be expected today. When comparing this futures chart with the SPX Cash chart (including different time frames) the rising wedge on the SPX will be broken at the open and any rally back up would only back-test it most likely. That level would be about 2145 on this futures chart (2150 on the SPX), which would make a nice "Right Shoulder" on a very clean looking "Head and Shoulders" pattern. But, I have too worry about that as we rarely get such clean looking patterns these days as SkyNet knows them as well and usually fools us with some straight down open that falls 100 points (like BREXIT and the 999 day in September).
My thoughts are that any rally will get will stall out in yesterdays' range area of 21138-2140 and not make it up to 2145 to make the perfect right shoulder. I just see it as tough for the futures to get much going on the upside with the SPX charts breaking the wedge and looking bearish on their MACD's right now. I'd give this some time this morning to do bounce and retest before thinking about a long as while it looks like the MACD's are ready to turn up on this 2 hour chart the 60 minute SPX chart will likely need a little time at the open to decide. It feels more like it's going to dance around this low for the first few hours of the day to find a bottom and then turn back up around midday to the afternoon session.
Again, assuming it turns up, I do not see a strong rally to 2150 or more but instead see 2138-2140 area as more likely (should it rally of course). More updates throughout the day of course but so far this is what I see as most likely to happen... which is find a bottom early in the morning, rally midday to afternoon to make a lower high then yesterday and a right shoulder of a head and shoulders pattern. If the current area gives way and we go lower then the 2122 prior low last week then this right shoulder bounce is wrong and I'd then be looking for 2107 or 2100 to be tested.

