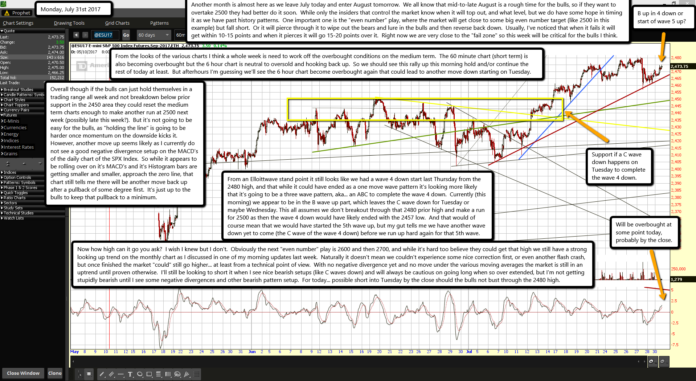
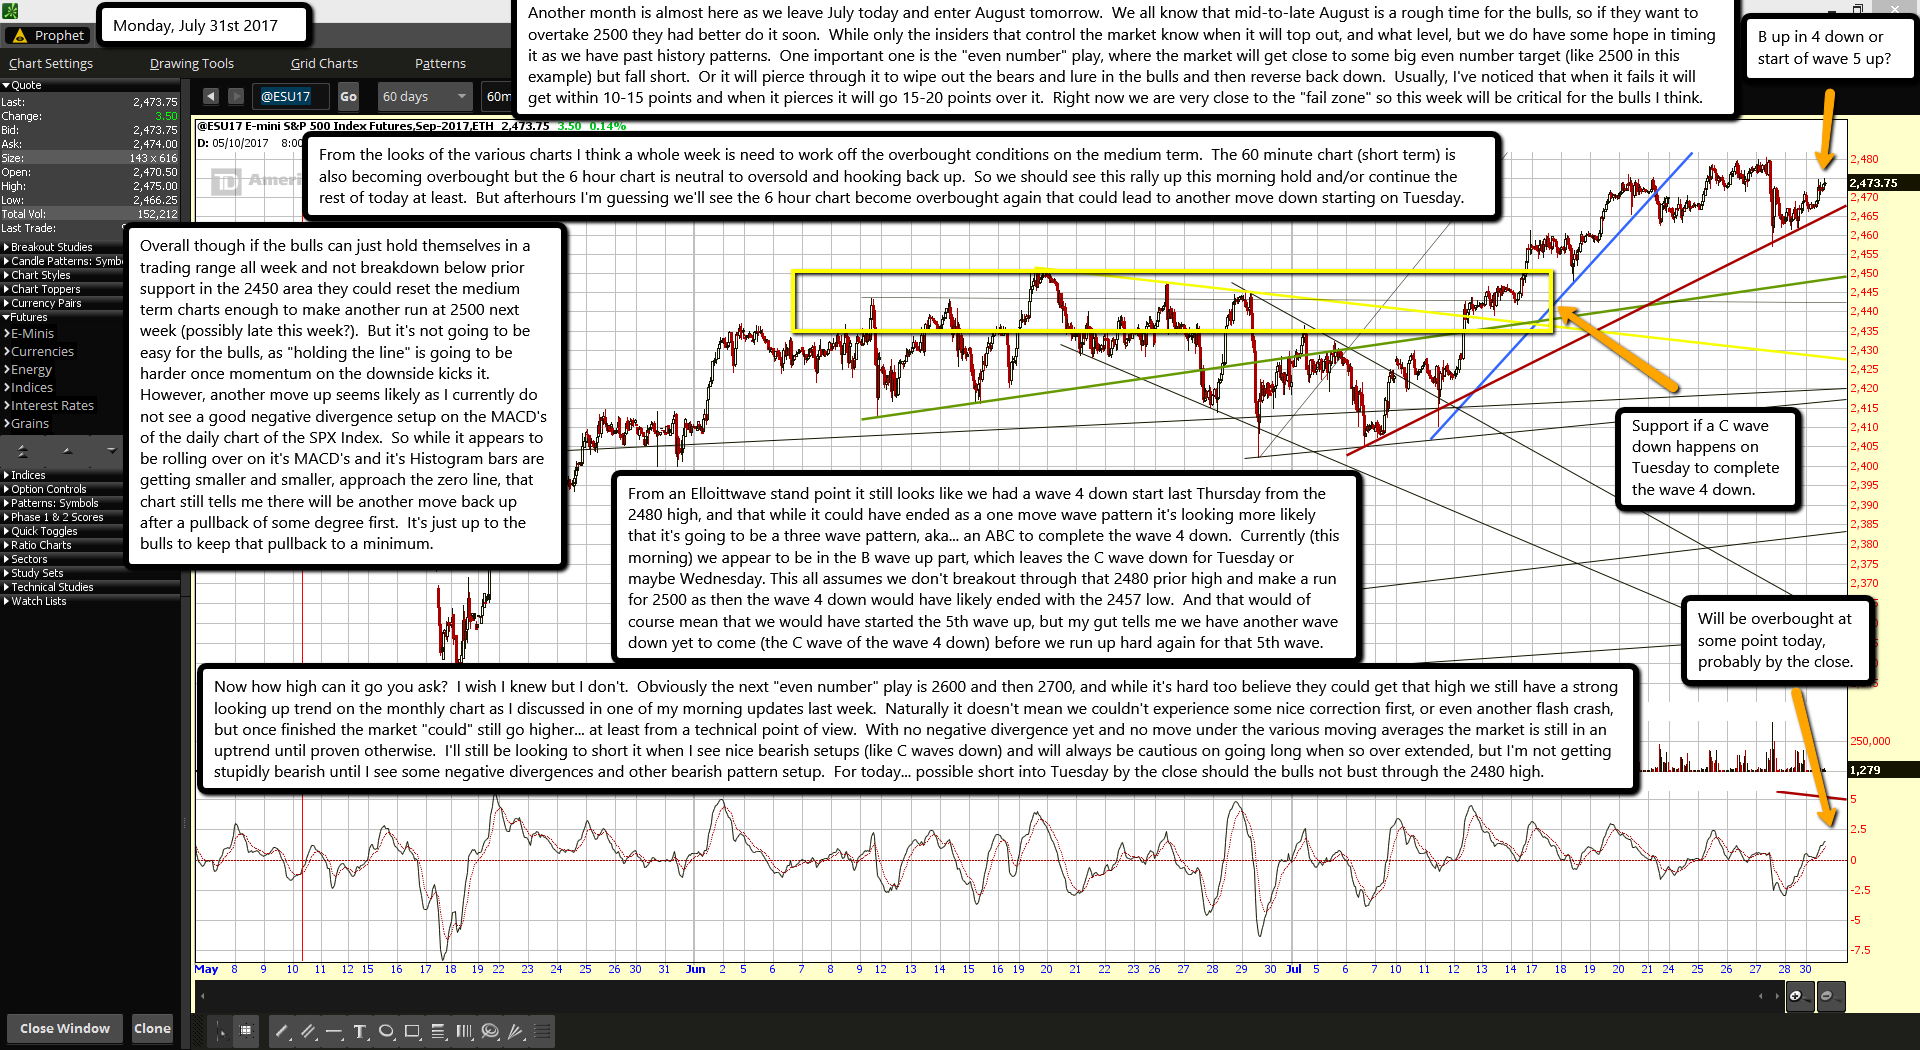
Another month is almost here as we leave July today and enter August tomorrow. We all know that mid-to-late August is a rough time for the bulls, so if they want to overtake 2500 they had better do it soon. While only the insiders that control the market know when it will top out, and what level, but we do have some hope in timing it as we have past history patterns. One important one is the "even number" play, where the market will get close to some big even number target (like 2500 in this example) but fall short. Or it will pierce through it to wipe out the bears and lure in the bulls and then reverse back down. Usually, I've noticed that when it fails it will get within 10-15 points and when it pierces it will go 15-20 points over it. Right now we are very close to the "fail zone" so this week will be critical for the bulls I think.
From the looks of the various charts I think a whole week is need to work off the overbought conditions on the medium term. The 60 minute chart (short term) is also becoming overbought but the 6 hour chart is neutral to oversold and hooking back up. So we should see this rally up this morning hold and/or continue the rest of today at least. But afterhours I'm guessing we'll see the 6 hour chart become overbought again that could lead to another move down starting on Tuesday.
Overall though if the bulls can just hold themselves in a trading range all week and not breakdown below prior support in the 2450 area they could reset the medium term charts enough to make another run at 2500 next week (possibly late this week?). But it's not going to be easy for the bulls, as "holding the line" is going to be harder once momentum on the downside kicks it. However, another move up seems likely as I currently do not see a good negative divergence setup on the MACD's of the daily chart of the SPX Index. So while it appears to be rolling over on it's MACD's and it's Histogram bars are getting smaller and smaller, approach the zero line, that chart still tells me there will be another move back up after a pullback of some degree first. It's just up to the bulls to keep that pullback to a minimum.
From an Elloittwave stand point it still looks like we had a wave 4 down start last Thursday from the 2480 high, and that while it could have ended as a one move wave pattern it's looking more likely that it's going to be a three wave pattern, aka... an ABC to complete the wave 4 down. Currently (this morning) we appear to be in the B wave up part, which leaves the C wave down for Tuesday or maybe Wednesday. This all assumes we don't breakout through that 2480 prior high and make a run for 2500 as then the wave 4 down would have likely ended with the 2457 low. And that would of course mean that we would have started the 5th wave up, but my gut tells me we have another wave down yet to come (the C wave of the wave 4 down) before we run up hard again for that 5th wave.
Now how high can it go you ask? I wish I knew but I don't. Obviously the next "even number" play is 2600 and then 2700, and while it's hard too believe they could get that high we still have a strong looking up trend on the monthly chart as I discussed in one of my morning updates last week. Naturally it doesn't mean we couldn't experience some nice correction first, or even another flash crash, but once finished the market "could" still go higher... at least from a technical point of view. With no negative divergence yet and no move under the various moving averages the market is still in an uptrend until proven otherwise. I'll still be looking to short it when I see nice bearish setups (like C waves down) and will always be cautious on going long when so over extended, but I'm not getting stupidly bearish until I see some negative divergences and other bearish pattern setup. For today... possible short into Tuesday by the close should the bulls not bust through the 2480 high.


