
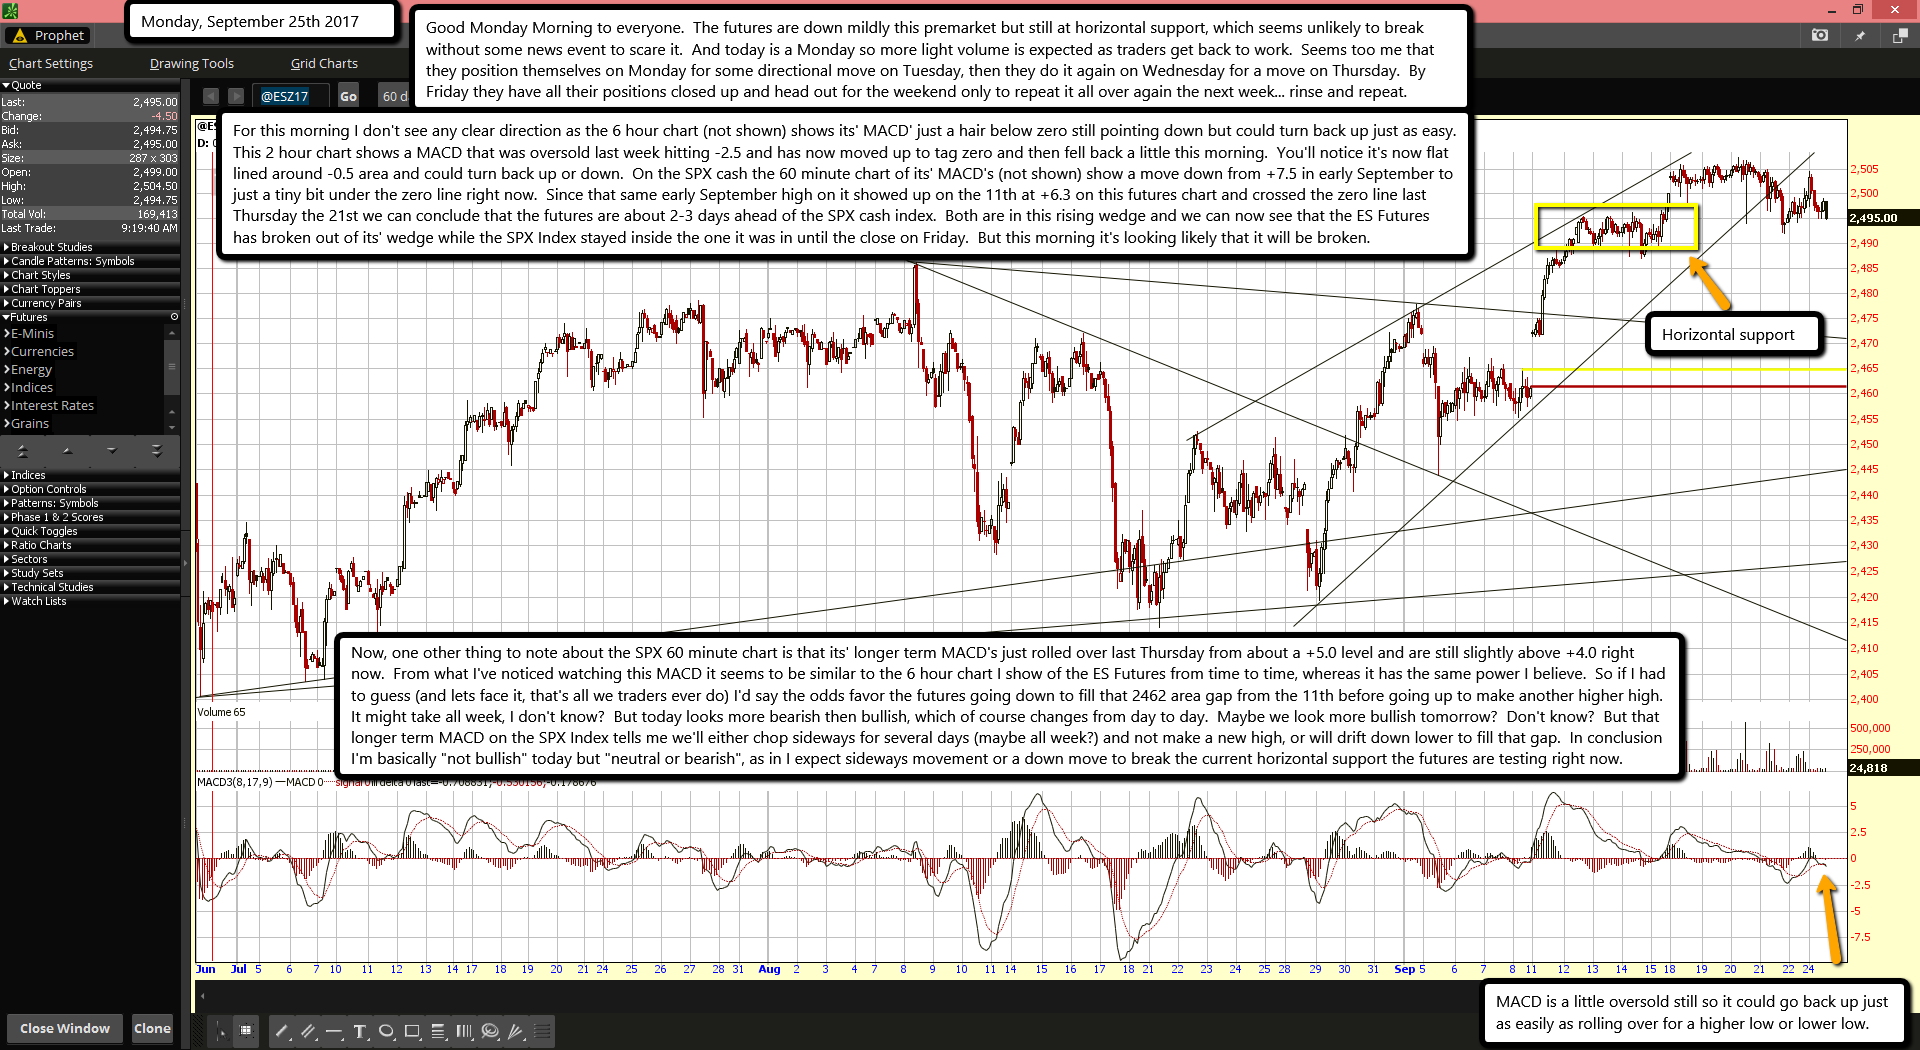
Good Monday Morning to everyone. The futures are down mildly this premarket but still at horizontal support, which seems unlikely to break without some news event to scare it. And today is a Monday so more light volume is expected as traders get back to work. Seems too me that they position themselves on Monday for some directional move on Tuesday, then they do it again on Wednesday for a move on Thursday. By Friday they have all their positions closed up and head out for the weekend only to repeat it all over again the next week... rinse and repeat.
For this morning I don't see any clear direction as the 6 hour chart (not shown) shows its' MACD' just a hair below zero still pointing down but could turn back up just as easy. This 2 hour chart shows a MACD that was oversold last week hitting -2.5 and has now moved up to tag zero and then fell back a little this morning. You'll notice it's now flat lined around -0.5 area and could turn back up or down. On the SPX cash the 60 minute chart of its' MACD's (not shown) show a move down from +7.5 in early September to just a tiny bit under the zero line right now. Since that same early September high on it showed up on the 11th at +6.3 on this futures chart and crossed the zero line last Thursday the 21st we can conclude that the futures are about 2-3 days ahead of the SPX cash index. Both are in this rising wedge and we can now see that the ES Futures has broken out of its' wedge while the SPX Index stayed inside the one it was in until the close on Friday. But this morning it's looking likely that it will be broken.
Now, one other thing to note about the SPX 60 minute chart is that its' longer term MACD's just rolled over last Thursday from about a +5.0 level and are still slightly above +4.0 right now. From what I've noticed watching this MACD it seems to be similar to the 6 hour chart I show of the ES Futures from time to time, whereas it has the same power I believe. So if I had to guess (and lets face it, that's all we traders ever do) I'd say the odds favor the futures going down to fill that 2462 area gap from the 11th before going up to make another higher high. It might take all week, I don't know? But today looks more bearish then bullish, which of course changes from day to day. Maybe we look more bullish tomorrow? Don't know? But that longer term MACD on the SPX Index tells me we'll either chop sideways for several days (maybe all week?) and not make a new high, or will drift down lower to fill that gap. In conclusion I'm basically "not bullish" today but "neutral or bearish", as in I expect sideways movement or a down move to break the current horizontal support the futures are testing right now.

