
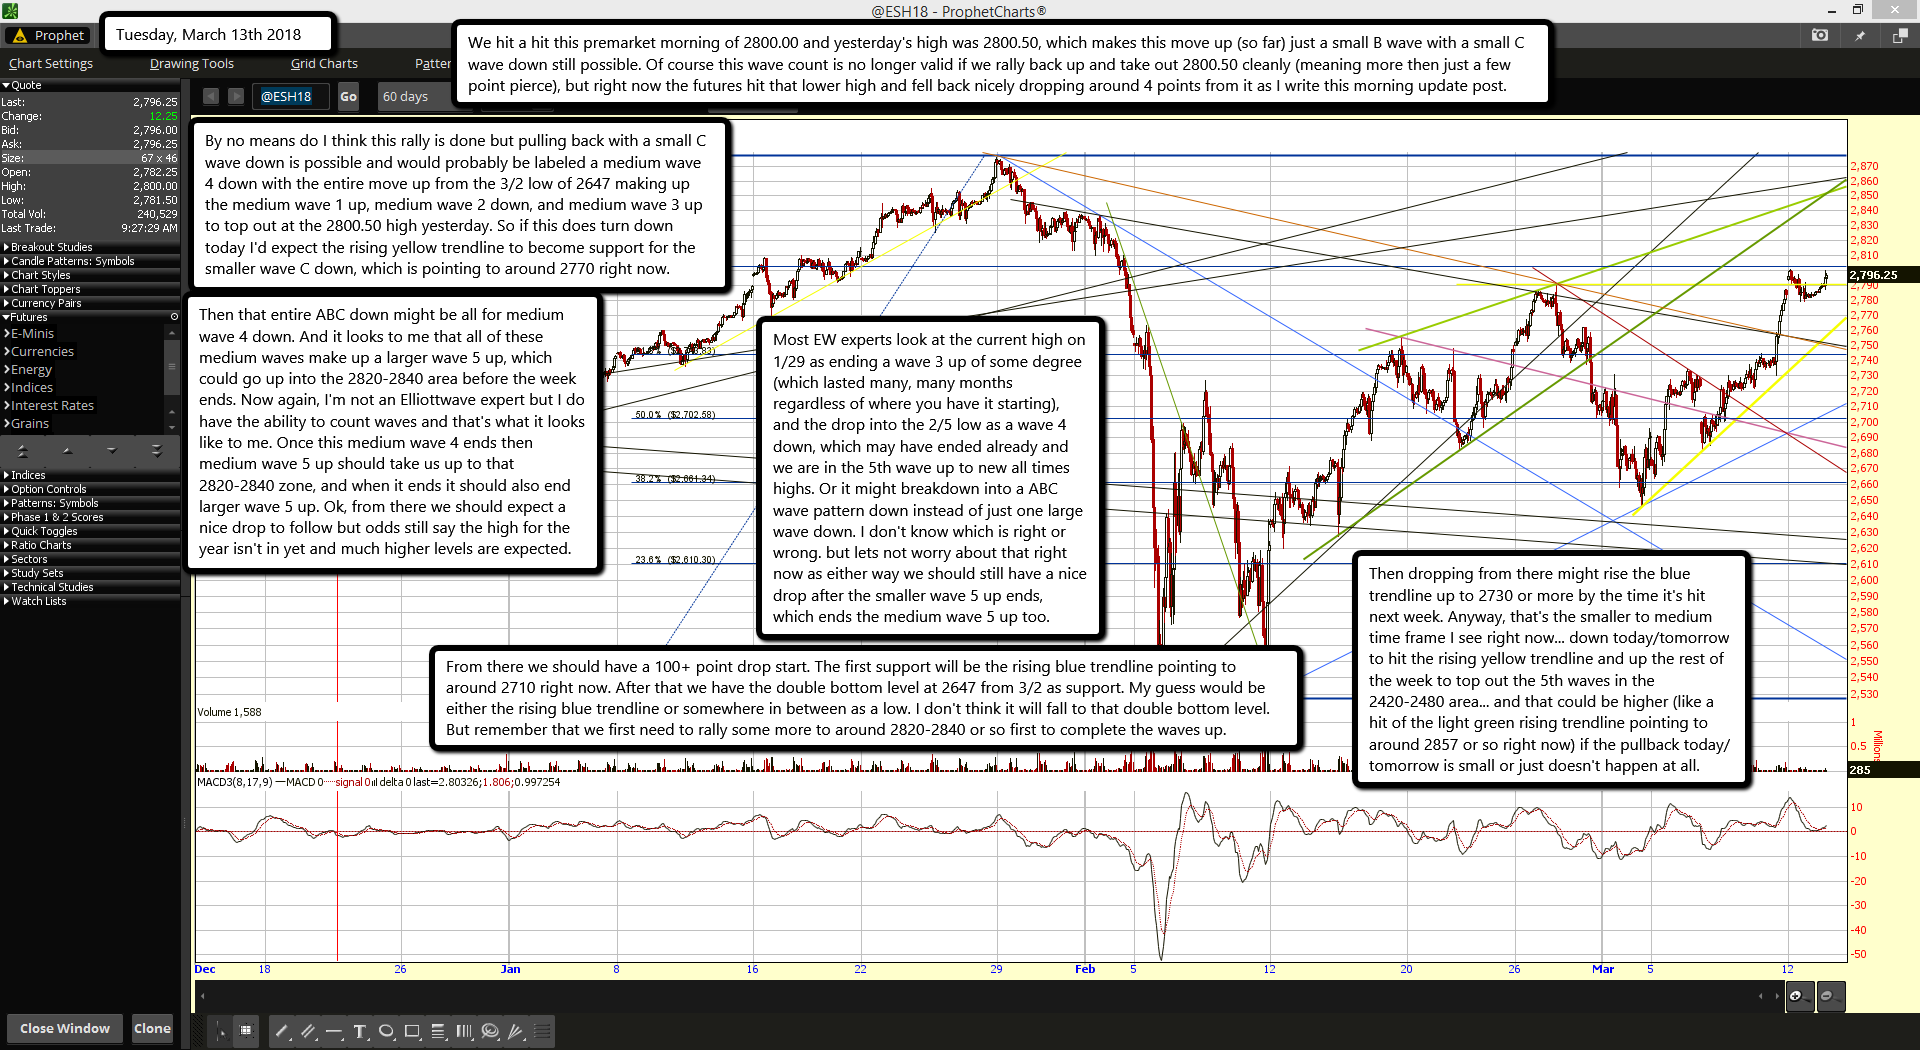
We hit a hit this premarket morning of 2800.00 and yesterday's high was 2800.50, which makes this move up (so far) just a small B wave with a small C wave down still possible. Of course this wave count is no longer valid if we rally back up and take out 2800.50 cleanly (meaning more then just a few point pierce), but right now the futures hit that lower high and fell back nicely dropping around 4 points from it as I write this morning update post.
By no means do I think this rally is done but pulling back with a small C wave down is possible and would probably be labeled a medium wave 4 down with the entire move up from the 3/2 low of 2647 making up the medium wave 1 up, medium wave 2 down, and medium wave 3 up to top out at the 2800.50 high yesterday. So if this does turn down today I'd expect the rising yellow trendline to become support for the smaller wave C down, which is pointing to around 2770 right now.
Then that entire ABC down might be all for medium wave 4 down. And it looks to me that all of these medium waves make up a larger wave 5 up, which could go up into the 2820-2840 area before the week ends. Now again, I'm not an Elliottwave expert but I do have the ability to count waves and that's what it looks like to me. Once this medium wave 4 ends then medium wave 5 up should take us up to that 2820-2840 zone, and when it ends it should also end larger wave 5 up. Ok, from there we should expect a nice drop to follow but odds still say the high for the year isn't in yet and much higher levels are expected.
Most EW experts look at the current high on 1/29 as ending a wave 3 up of some degree (which lasted many, many months regardless of where you have it starting), and the drop into the 2/5 low as a wave 4 down, which may have ended already and we are in the 5th wave up to new all times highs. Or it might breakdown into a ABC wave pattern down instead of just one large wave down. I don't know which is right or wrong. but lets not worry about that right now as either way we should still have a nice drop after the smaller wave 5 up ends, which ends the medium wave 5 up too.
From there we should have a 100+ point drop start. The first support will be the rising blue trendline pointing to around 2710 right now. After that we have the double bottom level at 2647 from 3/2 as support. My guess would be either the rising blue trendline or somewhere in between as a low. I don't think it will fall to that double bottom level. But remember that we first need to rally some more to around 2820-2840 or so first to complete the waves up.
Then dropping from there might rise the blue trendline up to 2730 or more by the time it's hit next week. Anyway, that's the smaller to medium time frame I see right now... down today/tomorrow to hit the rising yellow trendline and up the rest of the week to top out the 5th waves in the 2420-2480 area... and that could be higher (like a hit of the light green rising trendline pointing to around 2857 or so right now) if the pullback today/tomorrow is small or just doesn't happen at all.

