
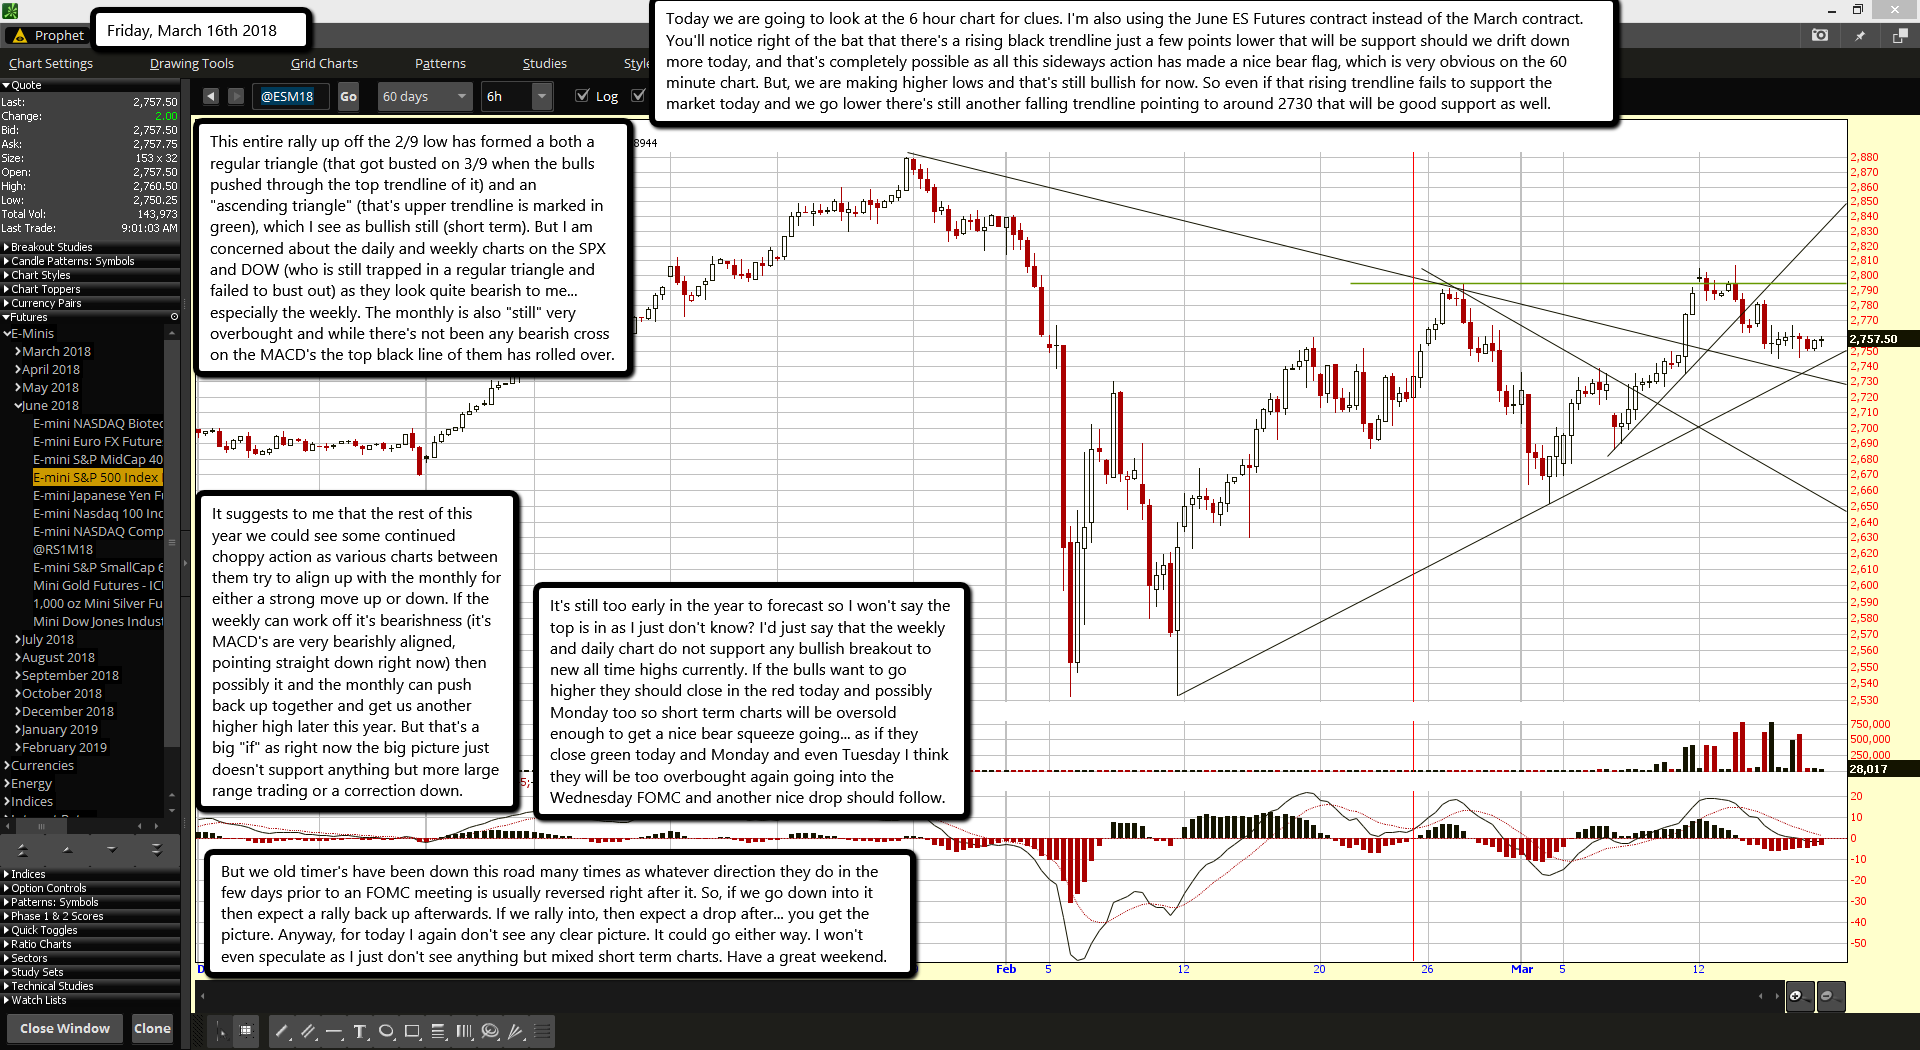
Today we are going to look at the 6 hour chart for clues. I'm also using the June ES Futures contract instead of the March contract. You'll notice right of the bat that there's a rising black trendline just a few points lower that will be support should we drift down more today, and that's completely possible as all this sideways action has made a nice bear flag, which is very obvious on the 60 minute chart. But, we are making higher lows and that's still bullish for now. So even if that rising trendline fails to support the market today and we go lower there's still another falling trendline pointing to around 2730 that will be good support as well.
This entire rally up off the 2/9 low has formed a both a regular triangle (that got busted on 3/9 when the bulls pushed through the top trendline of it) and an "ascending triangle" (that's upper trendline is marked in green), which I see as bullish still (short term). But I am concerned about the daily and weekly charts on the SPX and DOW (who is still trapped in a regular triangle and failed to bust out) as they look quite bearish to me... especially the weekly. The monthly is also "still" very overbought and while there's not been any bearish cross on the MACD's the top black line of them has rolled over.
It suggests to me that the rest of this year we could see some continued choppy action as various charts between them try to align up with the monthly for either a strong move up or down. If the weekly can work off it's bearishness (it's MACD's are very bearishly aligned, pointing straight down right now) then possibly it and the monthly can push back up together and get us another higher high later this year. But that's a big "if" as right now the big picture just doesn't support anything but more large range trading or a correction down.
It's still too early in the year to forecast so I won't say the top is in as I just don't know? I'd just say that the weekly and daily chart do not support any bullish breakout to new all time highs currently. If the bulls want to go higher they should close in the red today and possibly Monday too so short term charts will be oversold enough to get a nice bear squeeze going... as if they close green today and Monday and even Tuesday I think they will be too overbought again going into the Wednesday FOMC and another nice drop should follow.
But we old timer's have been down this road many times as whatever direction they do in the few days prior to an FOMC meeting is usually reversed right after it. So, if we go down into it then expect a rally back up afterwards. If we rally into, then expect a drop after... you get the picture. Anyway, for today I again don't see any clear picture. It could go either way. I won't even speculate as I just don't see anything but mixed short term charts. Have a great weekend.

