
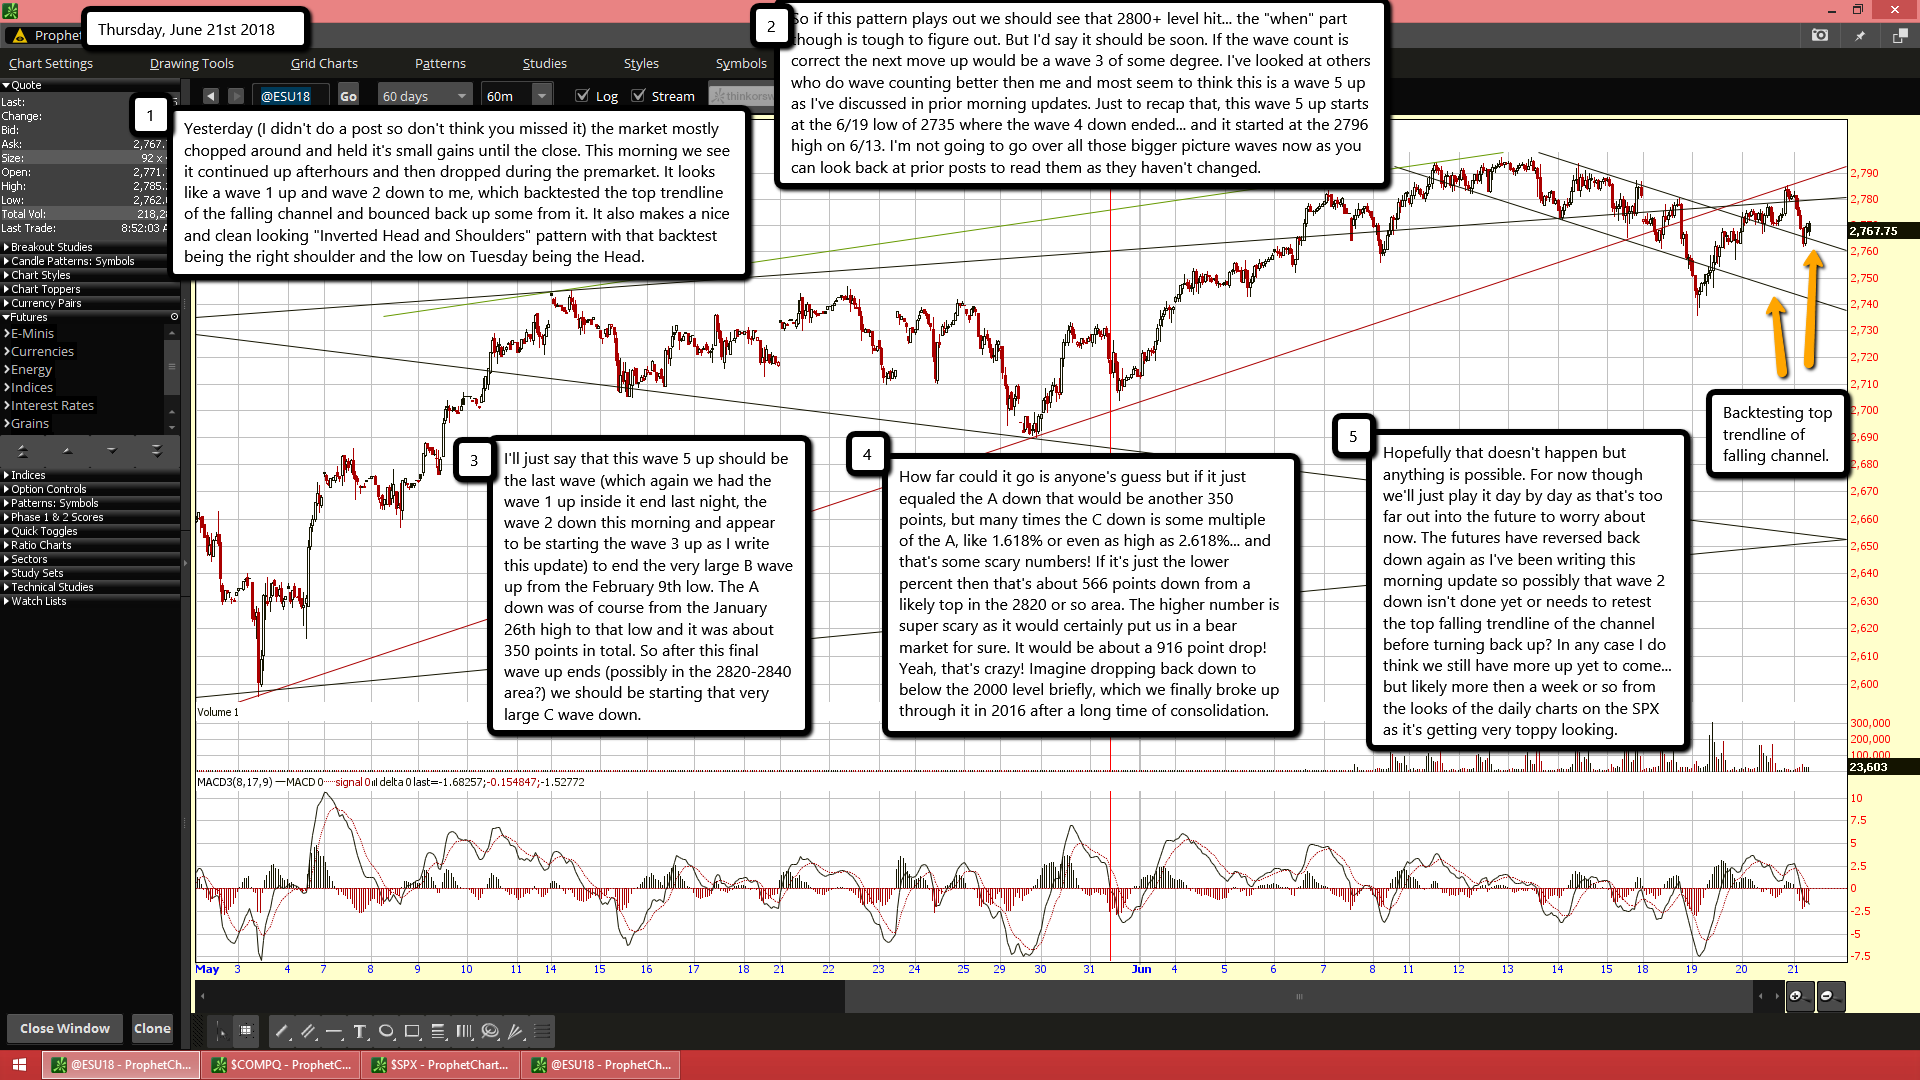
Yesterday (I didn't do a post so don't think you missed it) the market mostly chopped around and held it's small gains until the close. This morning we see it continued up afterhours and then dropped during the premarket. It looks like a wave 1 up and wave 2 down to me, which backtested the top trendline of the falling channel and bounced back up some from it. It also makes a nice and clean looking "Inverted Head and Shoulders" pattern with that backtest being the right shoulder and the low on Tuesday being the Head.
So if this pattern plays out we should see that 2800+ level hit... the "when" part though is tough to figure out. But I'd say it should be soon. If the wave count is correct the next move up would be a wave 3 of some degree. I've looked at others who do wave counting better then me and most seem to think this is a wave 5 up as I've discussed in prior morning updates. Just to recap that, this wave 5 up starts at the 6/19 low of 2735 where the wave 4 down ended... and it started at the 2796 high on 6/13. I'm not going to go over all those bigger picture waves now as you can look back at prior posts to read them as they haven't changed.
I'll just say that this wave 5 up should be the last wave (which again we had the wave 1 up inside it end last night, the wave 2 down this morning and appear to be starting the wave 3 up as I write this update) to end the very large B wave up from the February 9th low. The A down was of course from the January 26th high to that low and it was about 350 points in total. So after this final wave up ends (possibly in the 2820-2840 area?) we should be starting that very large C wave down.
How far could it go is anyone's guess but if it just equaled the A down that would be another 350 points, but many times the C down is some multiple of the A, like 1.618% or even as high as 2.618%... and that's some scary numbers! If it's just the lower percent then that's about 566 points down from a likely top in the 2820 or so area. The higher number is super scary as it would certainly put us in a bear market for sure. It would be about a 916 point drop! Yeah, that's crazy! Imagine dropping back down to below the 2000 level briefly, which we finally broke up through it in 2016 after a long time of consolidation.
Hopefully that doesn't happen but anything is possible. For now though we'll just play it day by day as that's too far out into the future to worry about now. The futures have reversed back down again as I've been writing this morning update so possibly that wave 2 down isn't done yet or needs to retest the top falling trendline of the channel before turning back up? In any case I do think we still have more up yet to come... but likely more then a week or so from the looks of the daily charts on the SPX as it's getting very toppy looking.

