
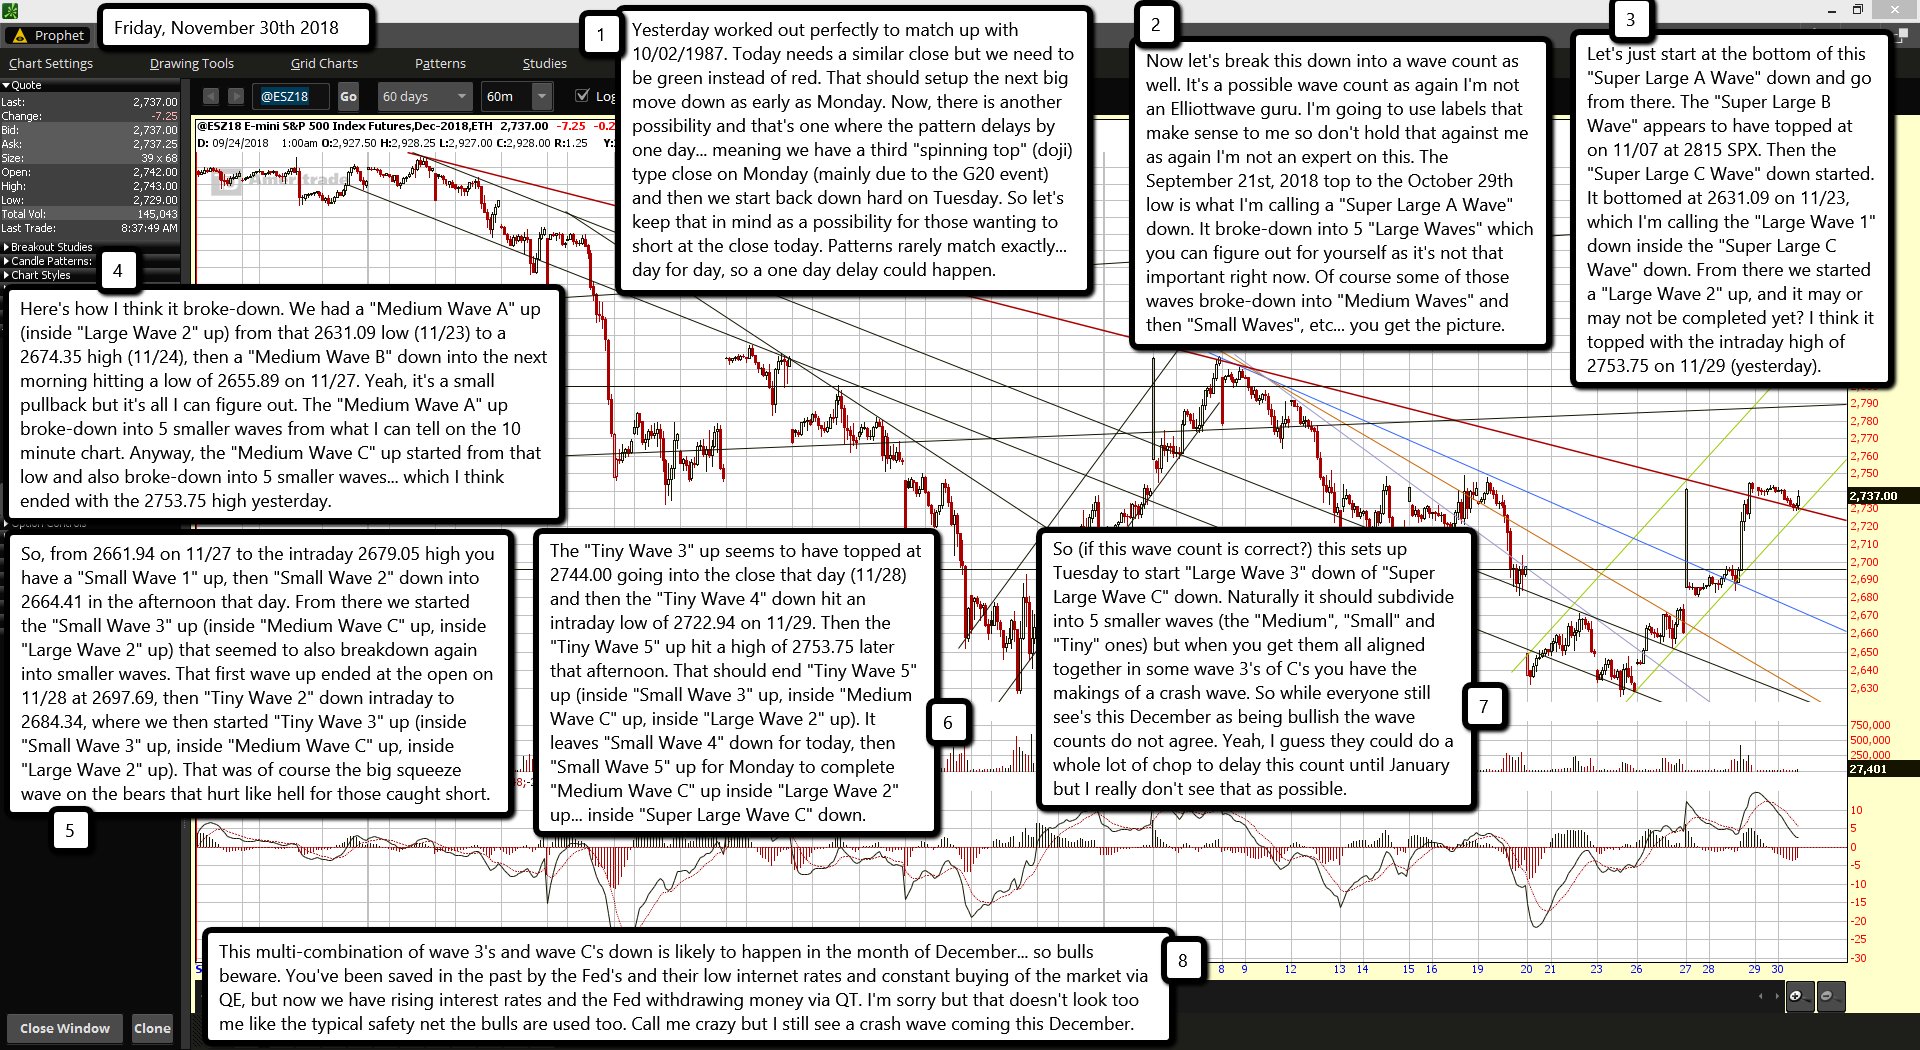
Yesterday worked out perfectly to match up with 10/02/1987. Today needs a similar close but we need to be green instead of red. That should setup the next big move down as early as Monday. Now, there is another possibility and that's one where the pattern delays by one day... meaning we have a third "spinning top" (doji) type close on Monday (mainly due to the G20 event) and then we start back down hard on Tuesday. So let's keep that in mind as a possibility for those wanting to short at the close today. Patterns rarely match exactly... day for day, so a one day delay could happen.
Now let's break this down into a wave count as well. It's a possible wave count as again I'm not an Elliottwave guru. I'm going to use labels that make sense to me so don't hold that against me as again I'm not an expert on this. The September 21st, 2018 top to the October 29th low is what I'm calling a "Super Large A Wave" down. It broke-down into 5 "Large Waves" which you can figure out for yourself as it's not that important right now. Of course some of those waves broke-down into "Medium Waves" and then "Small Waves", etc... you get the picture.
Let's just start at the bottom of this "Super Large A Wave" down and go from there. The "Super Large B Wave" appears to have topped at on 11/07 at 2815 SPX. Then the "Super Large C Wave" down started. It bottomed at 2631.09 on 11/23, which I'm calling the "Large Wave 1" down inside the "Super Large C Wave" down. From there we started a "Large Wave 2" up, and it may or may not be completed yet? I think it topped with the intraday high of 2753.75 on 11/29 (yesterday).
Here's how I think it broke-down. We had a "Medium Wave A" up (inside "Large Wave 2" up) from that 2631.09 low (11/23) to a 2674.35 high (11/24), then a "Medium Wave B" down into the next morning hitting a low of 2655.89 on 11/27. Yeah, it's a small pullback but it's all I can figure out. The "Medium Wave A" up broke-down into 5 smaller waves from what I can tell on the 10 minute chart. Anyway, the "Medium Wave C" up started from that low and also broke-down into 5 smaller waves... which I think ended with the 2753.75 high yesterday.
So, from 2661.94 on 11/27 to the intraday 2679.05 high you have a "Small Wave 1" up, then "Small Wave 2" down into 2664.41 in the afternoon that day. From there we started the "Small Wave 3" up (inside "Medium Wave C" up, inside "Large Wave 2" up) that seemed to also breakdown again into smaller waves. That first wave up ended at the open on 11/28 at 2697.69, then "Tiny Wave 2" down intraday to 2684.34, where we then started "Tiny Wave 3" up (inside "Small Wave 3" up, inside "Medium Wave C" up, inside "Large Wave 2" up). That was of course the big squeeze wave on the bears that hurt like hell for those caught short.
The "Tiny Wave 3" up seems to have topped at 2744.00 going into the close that day (11/28) and then the "Tiny Wave 4" down hit an intraday low of 2722.94 on 11/29. Then the "Tiny Wave 5" up hit a high of 2753.75 later that afternoon. That should end "Tiny Wave 5" up (inside "Small Wave 3" up, inside "Medium Wave C" up, inside "Large Wave 2" up). It leaves "Small Wave 4" down for today, then "Small Wave 5" up for Monday to complete "Medium Wave C" up inside "Large Wave 2" up... inside "Super Large Wave C" down.
So (if this wave count is correct?) this sets up Tuesday to start "Large Wave 3" down of "Super Large Wave C" down. Naturally it should subdivide into 5 smaller waves (the "Medium", "Small" and "Tiny" ones) but when you get them all aligned together in some wave 3's of C's you have the makings of a crash wave. So while everyone still see's this December as being bullish the wave counts do not agree. Yeah, I guess they could do a whole lot of chop to delay this count until January but I really don't see that as possible.
This multi-combination of wave 3's and wave C's down is likely to happen in the month of December... so bulls beware. You've been saved in the past by the Fed's and their low internet rates and constant buying of the market via QE, but now we have rising interest rates and the Fed withdrawing money via QT. I'm sorry but that doesn't look too me like the typical safety net the bulls are used too. Call me crazy but I still see a crash wave coming this December.

