
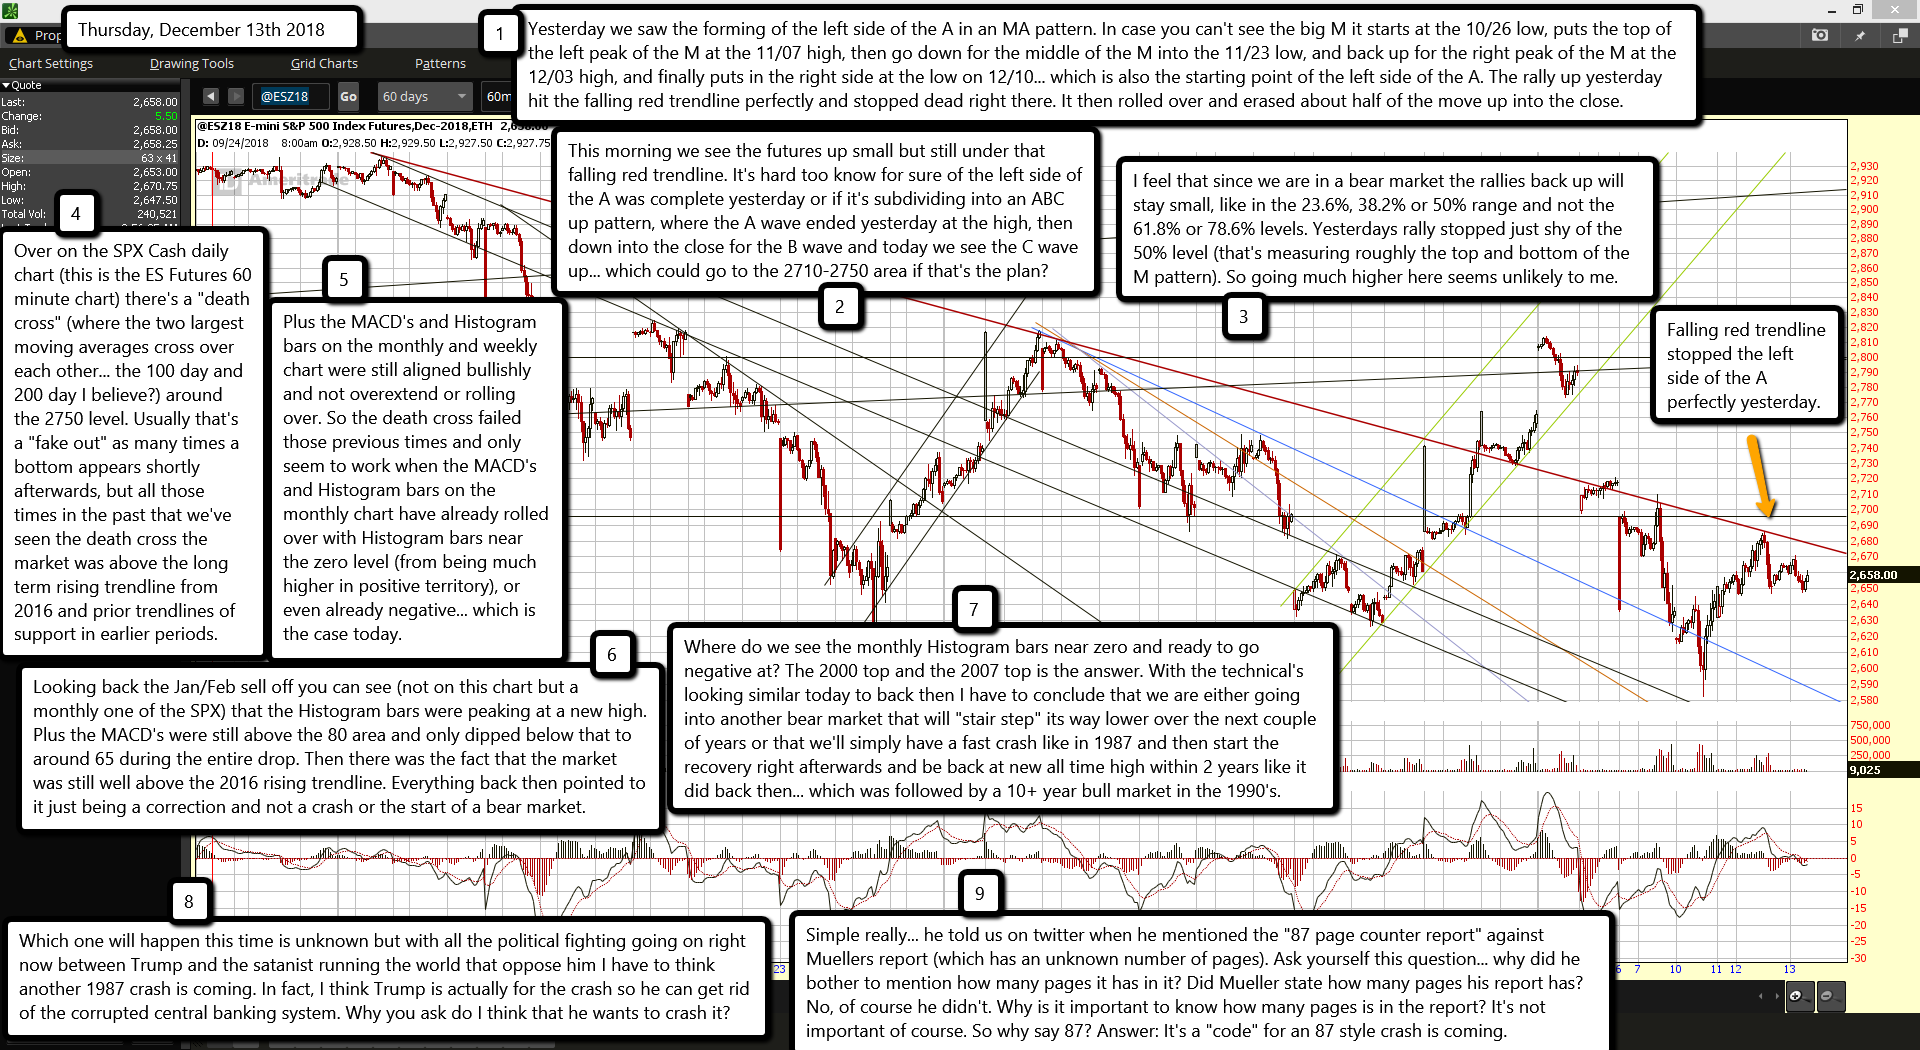
Yesterday we saw the forming of the left side of the A in an MA pattern. In case you can't see the big M it starts at the 10/26 low, puts the top of the left peak of the M at the 11/07 high, then go down for the middle of the M into the 11/23 low, and back up for the right peak of the M at the 12/03 high, and finally puts in the right side at the low on 12/10... which is also the starting point of the left side of the A. The rally up yesterday hit the falling red trendline perfectly and stopped dead right there. It then rolled over and erased about half of the move up into the close.
This morning we see the futures up small but still under that falling red trendline. It's hard too know for sure of the left side of the A was complete yesterday or if it's subdividing into an ABC up pattern, where the A wave ended yesterday at the high, then down into the close for the B wave and today we see the C wave up... which could go to the 2710-2750 area if that's the plan?
I feel that since we are in a bear market the rallies back up will stay small, like in the 23.6%, 38.2% or 50% range and not the 61.8% or 78.6% levels. Yesterdays rally stopped just shy of the 50% level (that's measuring roughly the top and bottom of the M pattern). So going much higher here seems unlikely to me.
Over on the SPX Cash daily chart (this is the ES Futures 60 minute chart) there's a "death cross" (where the two largest moving averages cross over each other... the 100 day and 200 day I believe?) around the 2750 level. Usually that's a "fake out" as many times a bottom appears shortly afterwards, but all those times in the past that we've seen the death cross the market was above the long term rising trendline from 2016 and prior trendlines of support in earlier periods.
Plus the MACD's and Histogram bars on the monthly and weekly chart were still aligned bullishly and not overextend or rolling over. So the death cross failed those previous times and only seem to work when the MACD's and Histogram bars on the monthly chart have already rolled over with Histogram bars near the zero level (from being much higher in positive territory), or even already negative... which is the case today.
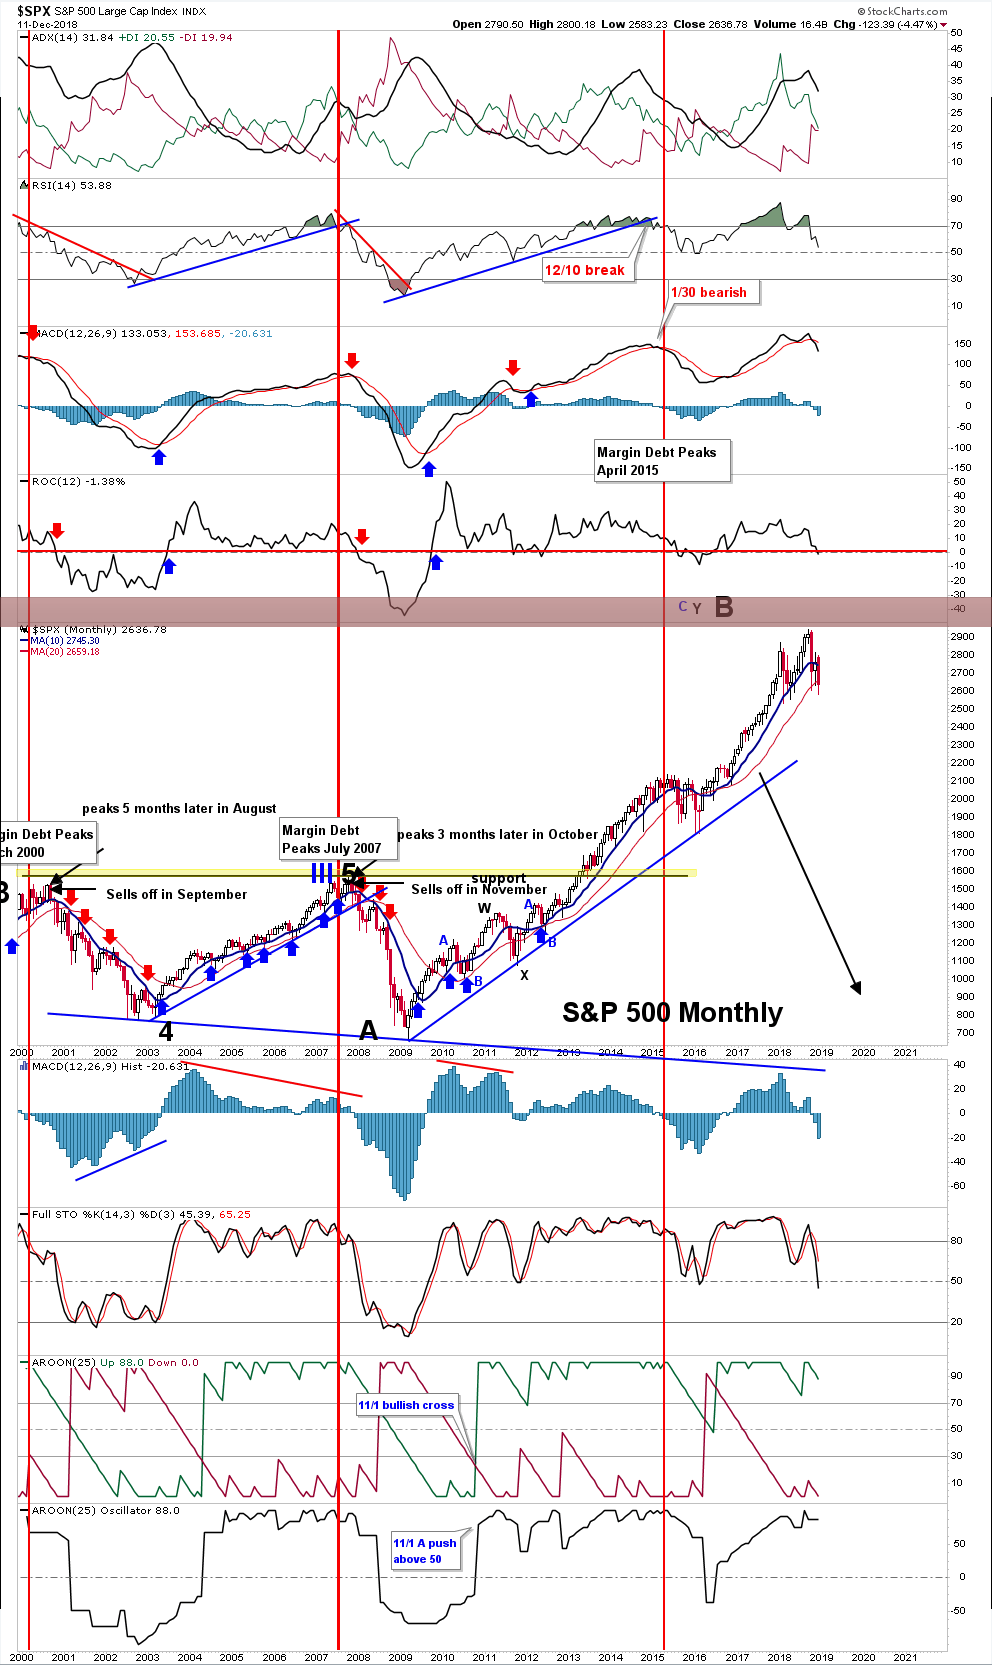 (Source of monthly chart above is from Ron Walker at TheChartPatternTrader)
Looking back the Jan/Feb sell off you can see (not on this chart but a monthly one of the SPX) that the Histogram bars were peaking at a new high. Plus the MACD's were still above the 80 area and only dipped below that to around 65 during the entire drop. Then there was the fact that the market was still well above the 2016 rising trendline. Everything back then pointed to it just being a correction and not a crash or the start of a bear market.
Where do we see the monthly Histogram bars near zero and ready to go negative at? The 2000 top and the 2007 top is the answer. With the technical's looking similar today to back then I have to conclude that we are either going into another bear market that will "stair step" its way lower over the next couple of years or that we'll simply have a fast crash like in 1987 and then start the recovery right afterwards and be back at new all time high within 2 years like it did back then... which was followed by a 10+ year bull market in the 1990's.
Which one will happen this time is unknown but with all the political fighting going on right now between Trump and the satanist running the world that oppose him I have to think another 1987 crash is coming. In fact, I think Trump is actually for the crash so he can get rid of the corrupted central banking system. Why you ask do I think that he wants to crash it?
Simple really... he told us on twitter when he mentioned the "87 page counter report" against Muellers report (which has an unknown number of pages). Ask yourself this question... why did he bother to mention how many pages it has in it? Did Mueller state how many pages his report has? No, of course he didn't. Why is it important to know how many pages is in the report? It's not important of course. So why say 87? Answer: It's a "code" for an 87 style crash is coming.

