
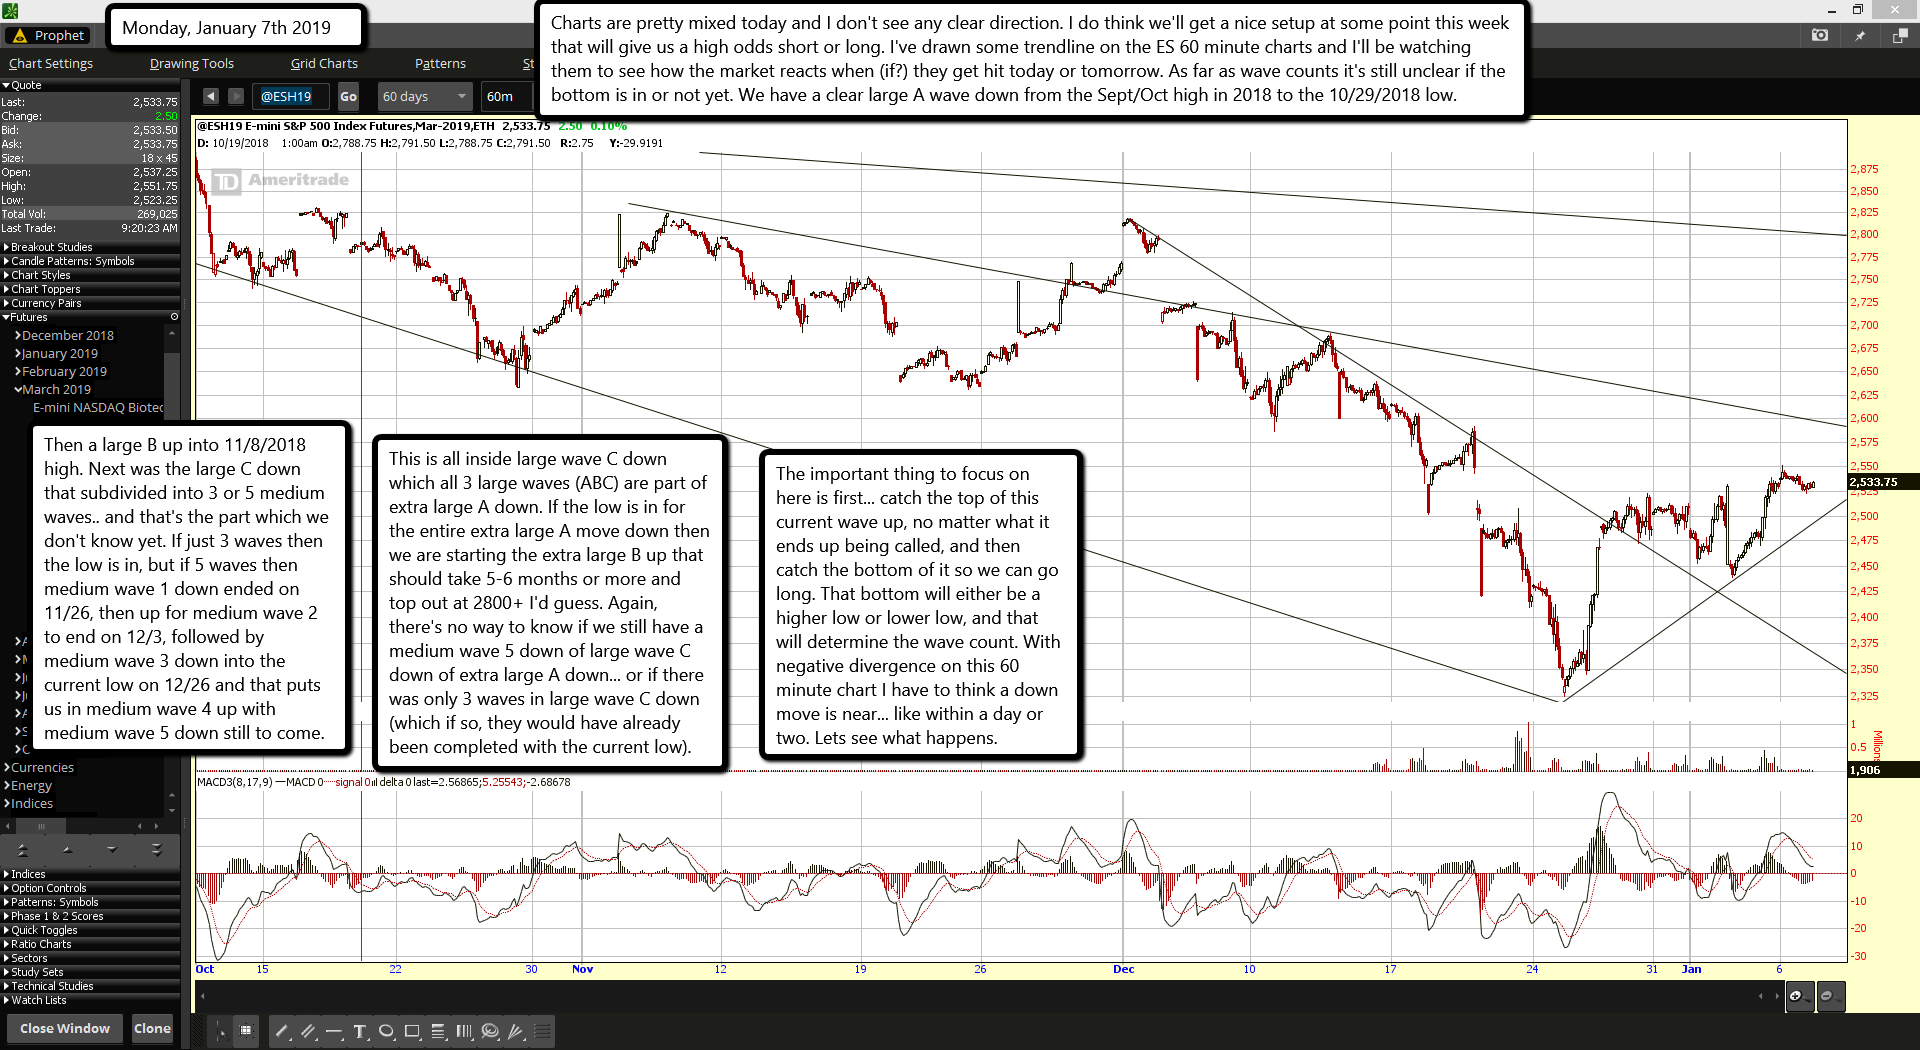
Charts are pretty mixed today and I don't see any clear direction. I do think we'll get a nice setup at some point this week that will give us a high odds short or long. I've drawn some trendline on the ES 60 minute charts and I'll be watching them to see how the market reacts when (if?) they get hit today or tomorrow. As far as wave counts it's still unclear if the bottom is in or not yet. We have a clear large A wave down from the Sept/Oct high in 2018 to the 10/29/2018 low.
Then a large B up into 11/8/2018 high. Next was the large C down that subdivided into 3 or 5 medium waves.. and that's the part which we don't know yet. If just 3 waves then the low is in, but if 5 waves then medium wave 1 down ended on 11/26, then up for medium wave 2 to end on 12/3, followed by medium wave 3 down into the current low on 12/26 and that puts us in medium wave 4 up with medium wave 5 down still to come.
This is all inside large wave C down which all 3 large waves (ABC) are part of extra large A down. If the low is in for the entire extra large A move down then we are starting the extra large B up that should take 5-6 months or more and top out at 2800+ I'd guess. Again, there's no way to know if we still have a medium wave 5 down of large wave C down of extra large A down... or if there was only 3 waves in large wave C down (which if so, they would have already been completed with the current low).
The important thing to focus on here is first... catch the top of this current wave up, no matter what it ends up being called, and then catch the bottom of it so we can go long. That bottom will either be a higher low or lower low, and that will determine the wave count. With negative divergence on this 60 minute chart I have to think a down move is near... like within a day or two. Lets see what happens.

