
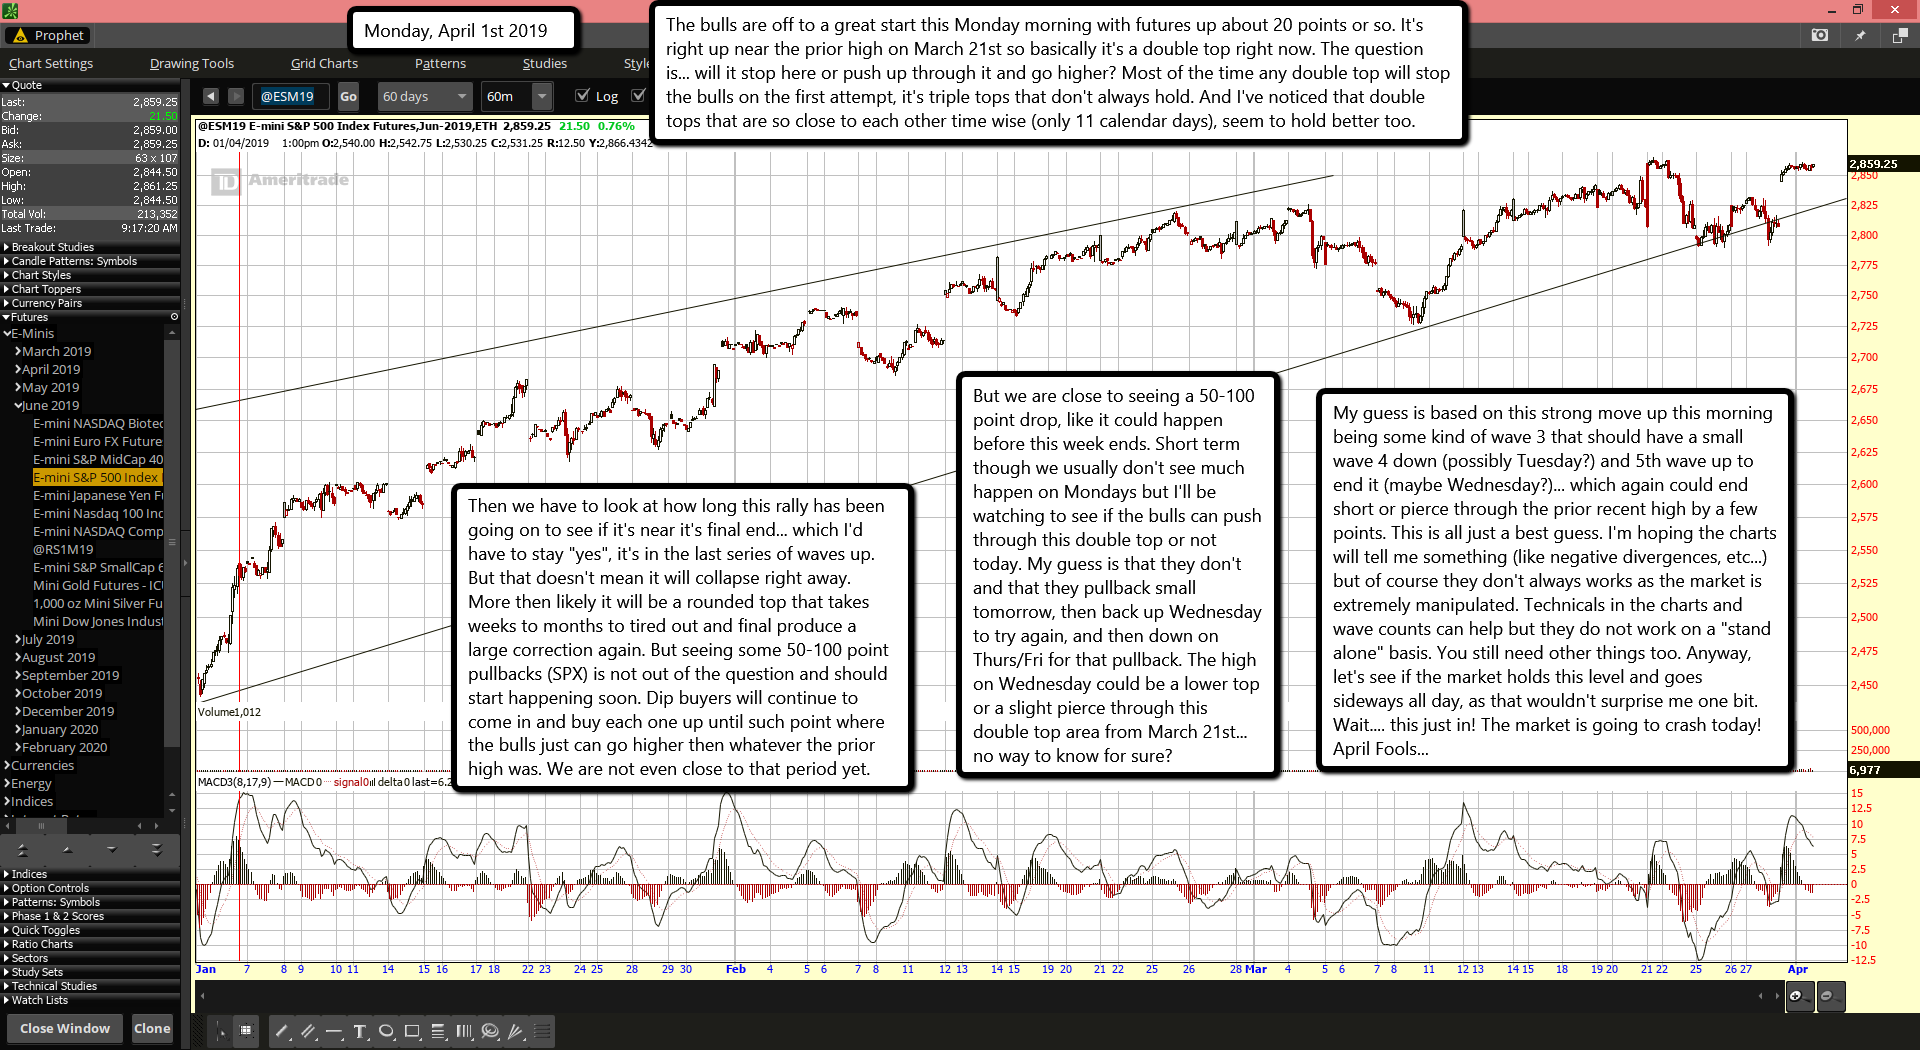
The bulls are off to a great start this Monday morning with futures up about 20 points or so. It's right up near the prior high on March 21st so basically it's a double top right now. The question is... will it stop here or push up through it and go higher? Most of the time any double top will stop the bulls on the first attempt, it's triple tops that don't always hold. And I've noticed that double tops that are so close to each other time wise (only 11 calendar days), seem to hold better too.
Then we have to look at how long this rally has been going on to see if it's near it's final end... which I'd have to stay "yes", it's in the last series of waves up. But that doesn't mean it will collapse right away. More then likely it will be a rounded top that takes weeks to months to tired out and final produce a large correction again. But seeing some 50-100 point pullbacks (SPX) is not out of the question and should start happening soon. Dip buyers will continue to come in and buy each one up until such point where the bulls just can go higher then whatever the prior high was. We are not even close to that period yet.
But we are close to seeing a 50-100 point drop, like it could happen before this week ends. Short term though we usually don't see much happen on Mondays but I'll be watching to see if the bulls can push through this double top or not today. My guess is that they don't and that they pullback small tomorrow, then back up Wednesday to try again, and then down on Thurs/Fri for that pullback. The high on Wednesday could be a lower top or a slight pierce through this double top area from March 21st... no way to know for sure?
My guess is based on this strong move up this morning being some kind of wave 3 that should have a small wave 4 down (possibly Tuesday?) and 5th wave up to end it (maybe Wednesday?)... which again could end short or pierce through the prior recent high by a few points. This is all just a best guess. I'm hoping the charts will tell me something (like negative divergences, etc...) but of course they don't always works as the market is extremely manipulated. Technicals in the charts and wave counts can help but they do not work on a "stand alone" basis. You still need other things too. Anyway, let's see if the market holds this level and goes sideways all day, as that wouldn't surprise me one bit. Wait.... this just in! The market is going to crash today! April Fools...

