
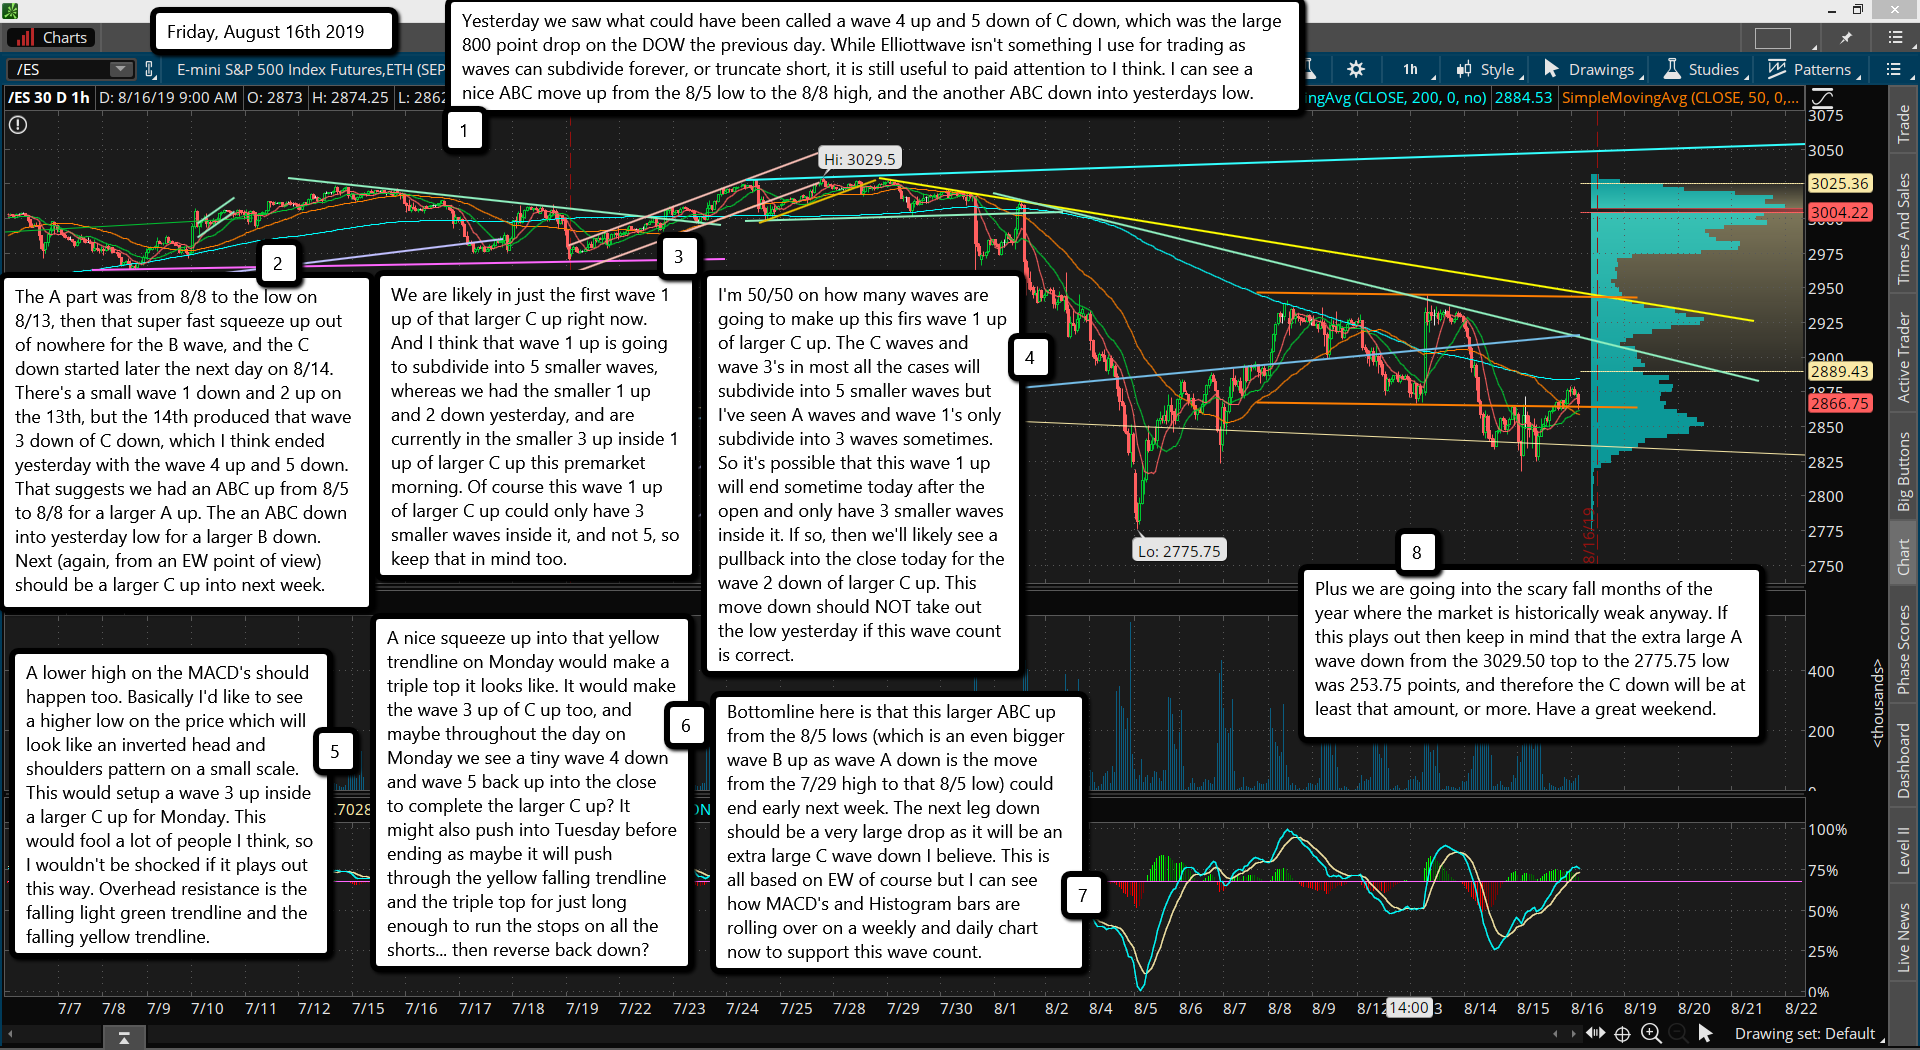
Yesterday we saw what could have been called a wave 4 up and 5 down of C down, which was the large 800 point drop on the DOW the previous day. While Elliottwave isn't something I use for trading as waves can subdivide forever, or truncate short, it is still useful to paid attention to I think. I can see a nice ABC move up from the 8/5 low to the 8/8 high, and the another ABC down into yesterdays low.
The A part was from 8/8 to the low on 8/13, then that super fast squeeze up out of nowhere for the B wave, and the C down started later the next day on 8/14. There's a small wave 1 down and 2 up on the 13th, but the 14th produced that wave 3 down of C down, which I think ended yesterday with the wave 4 up and 5 down. That suggests we had an ABC up from 8/5 to 8/8 for a larger A up. The an ABC down into yesterday low for a larger B down. Next (again, from an EW point of view) should be a larger C up into next week.
We are likely in just the first wave 1 up of that larger C up right now. And I think that wave 1 up is going to subdivide into 5 smaller waves, whereas we had the smaller 1 up and 2 down yesterday, and are currently in the smaller 3 up inside 1 up of larger C up this premarket morning. Of course this wave 1 up of larger C up could only have 3 smaller waves inside it, and not 5, so keep that in mind too.
I'm 50/50 on how many waves are going to make up this firs wave 1 up of larger C up. The C waves and wave 3's in most all the cases will subdivide into 5 smaller waves but I've seen A waves and wave 1's only subdivide into 3 waves sometimes. So it's possible that this wave 1 up will end sometime today after the open and only have 3 smaller waves inside it. If so, then we'll likely see a pullback into the close today for the wave 2 down of larger C up. This move down should NOT take out the low yesterday if this wave count is correct.
A lower high on the MACD's should happen too. Basically I'd like to see a higher low on the price which will look like an inverted head and shoulders pattern on a small scale. This would setup a wave 3 up inside a larger C up for Monday. This would fool a lot of people I think, so I wouldn't be shocked if it plays out this way. Overhead resistance is the falling light green trendline and the falling yellow trendline.
A nice squeeze up into that yellow trendline on Monday would make a triple top it looks like. It would make the wave 3 up of C up too, and maybe throughout the day on Monday we see a tiny wave 4 down and wave 5 back up into the close to complete the larger C up? It might also push into Tuesday before ending as maybe it will push through the yellow falling trendline and the triple top for just long enough to run the stops on all the shorts... then reverse back down?
Bottomline here is that this larger ABC up from the 8/5 lows (which is an even bigger wave B up as wave A down is the move from the 7/29 high to that 8/5 low) could end early next week. The next leg down should be a very large drop as it will be an extra large C wave down I believe. This is all based on EW of course but I can see how MACD's and Histogram bars are rolling over on a weekly and daily chart now to support this wave count.
Plus we are going into the scary fall months of the year where the market is historically weak anyway. If this plays out then keep in mind that the extra large A wave down from the 3029.50 top to the 2775.75 low was 253.75 points, and therefore the C down will be at least that amount, or more. Have a great weekend.

