

A Total Bust For My Bearish Wave Count!
Back To The Drawing Board...
Ok, so a massive failure the last month with every call I made as I just kept looking for that big leg down to only get a "one day wonder" move (or a few days, but not much in points) and to get reversed back up in the days after with a bear squeeze. A super frustrating month of bad trades and forecasts, which forced me to step back and dig in to researching the past to see where I went wrong and what the "truth" really is for the future.
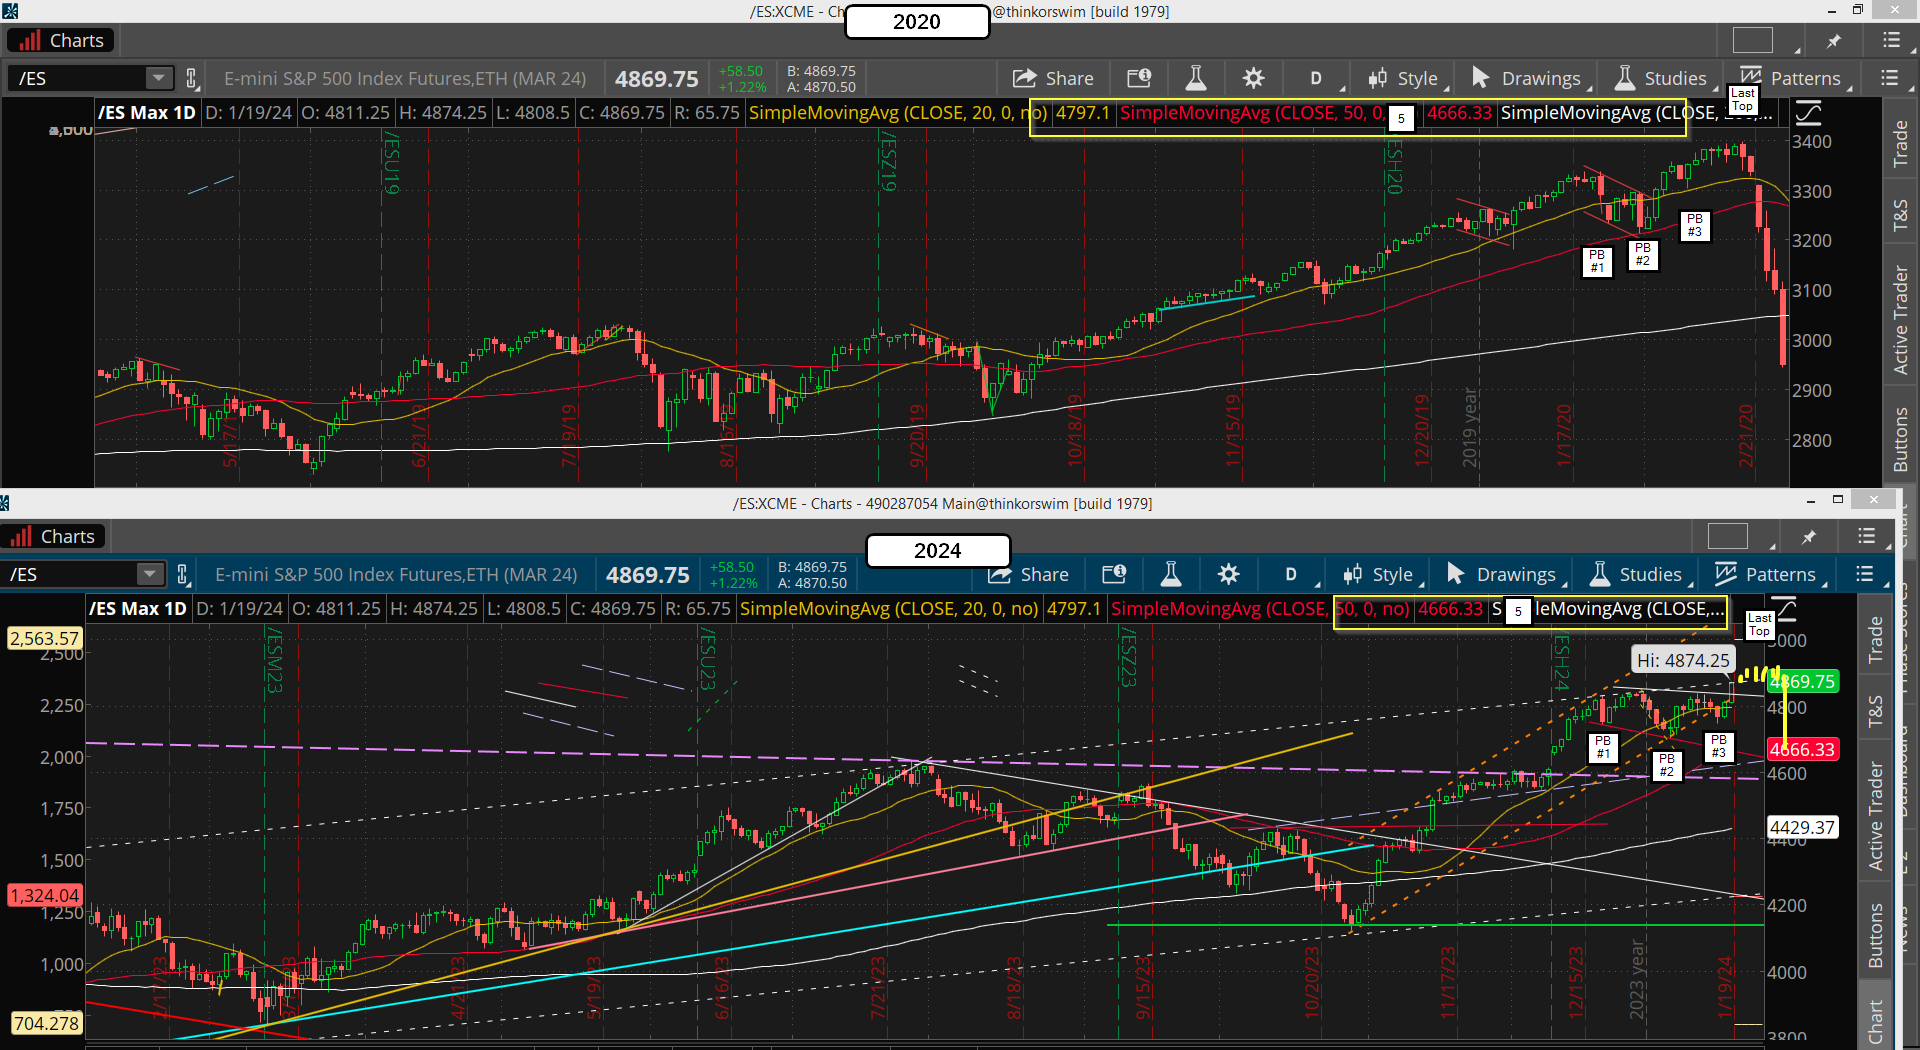
So I what I did was spend the entire weekend studying the 2020 and 2022 tops from the prior lows of each in the 2 years before. For the 2020 top it started from the 2018 bottom, and for the 2022 top it started from the 2020 low. Then I compared it to the rally from the 2022 bottom to our current top in 2024. I looked at the moving averages, the MACD's and the RSI, as well as patterns they made (Head and Shoulders). And what I found is very interesting. Lets go over it and start with the 2022 top first.
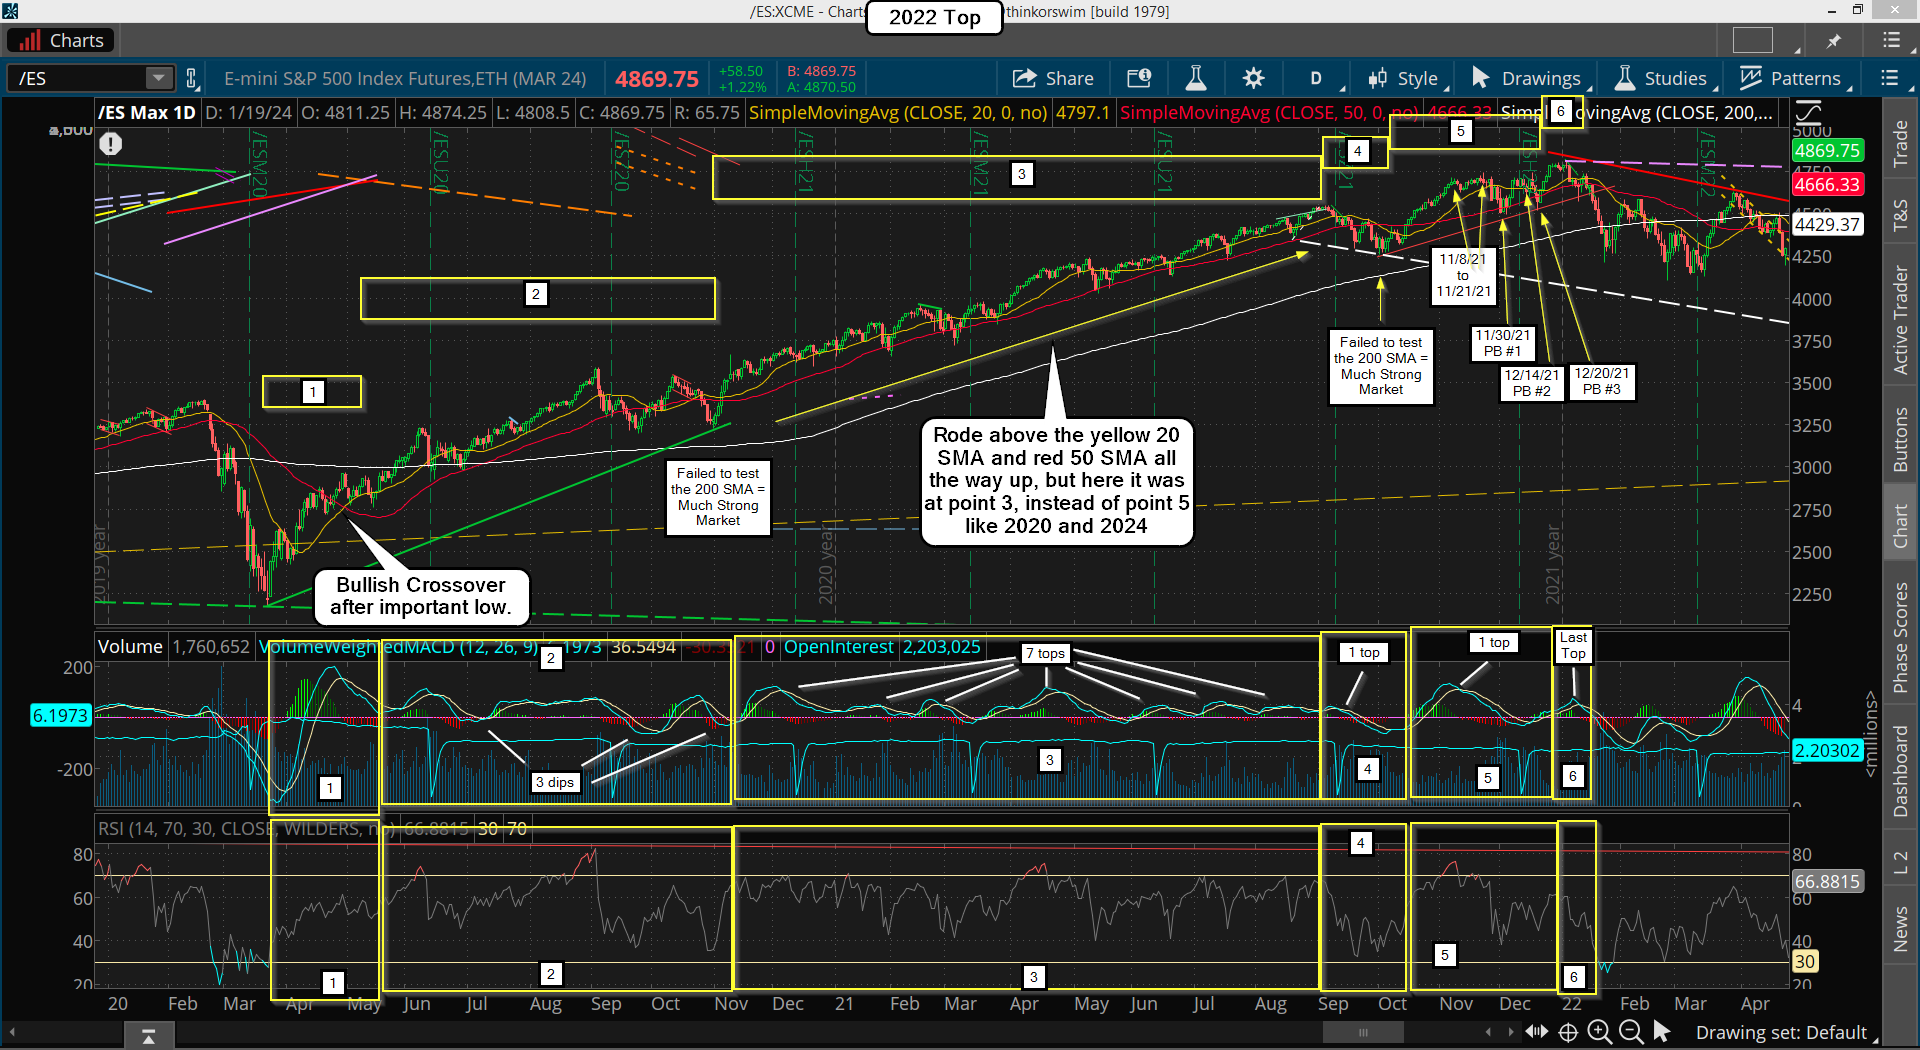
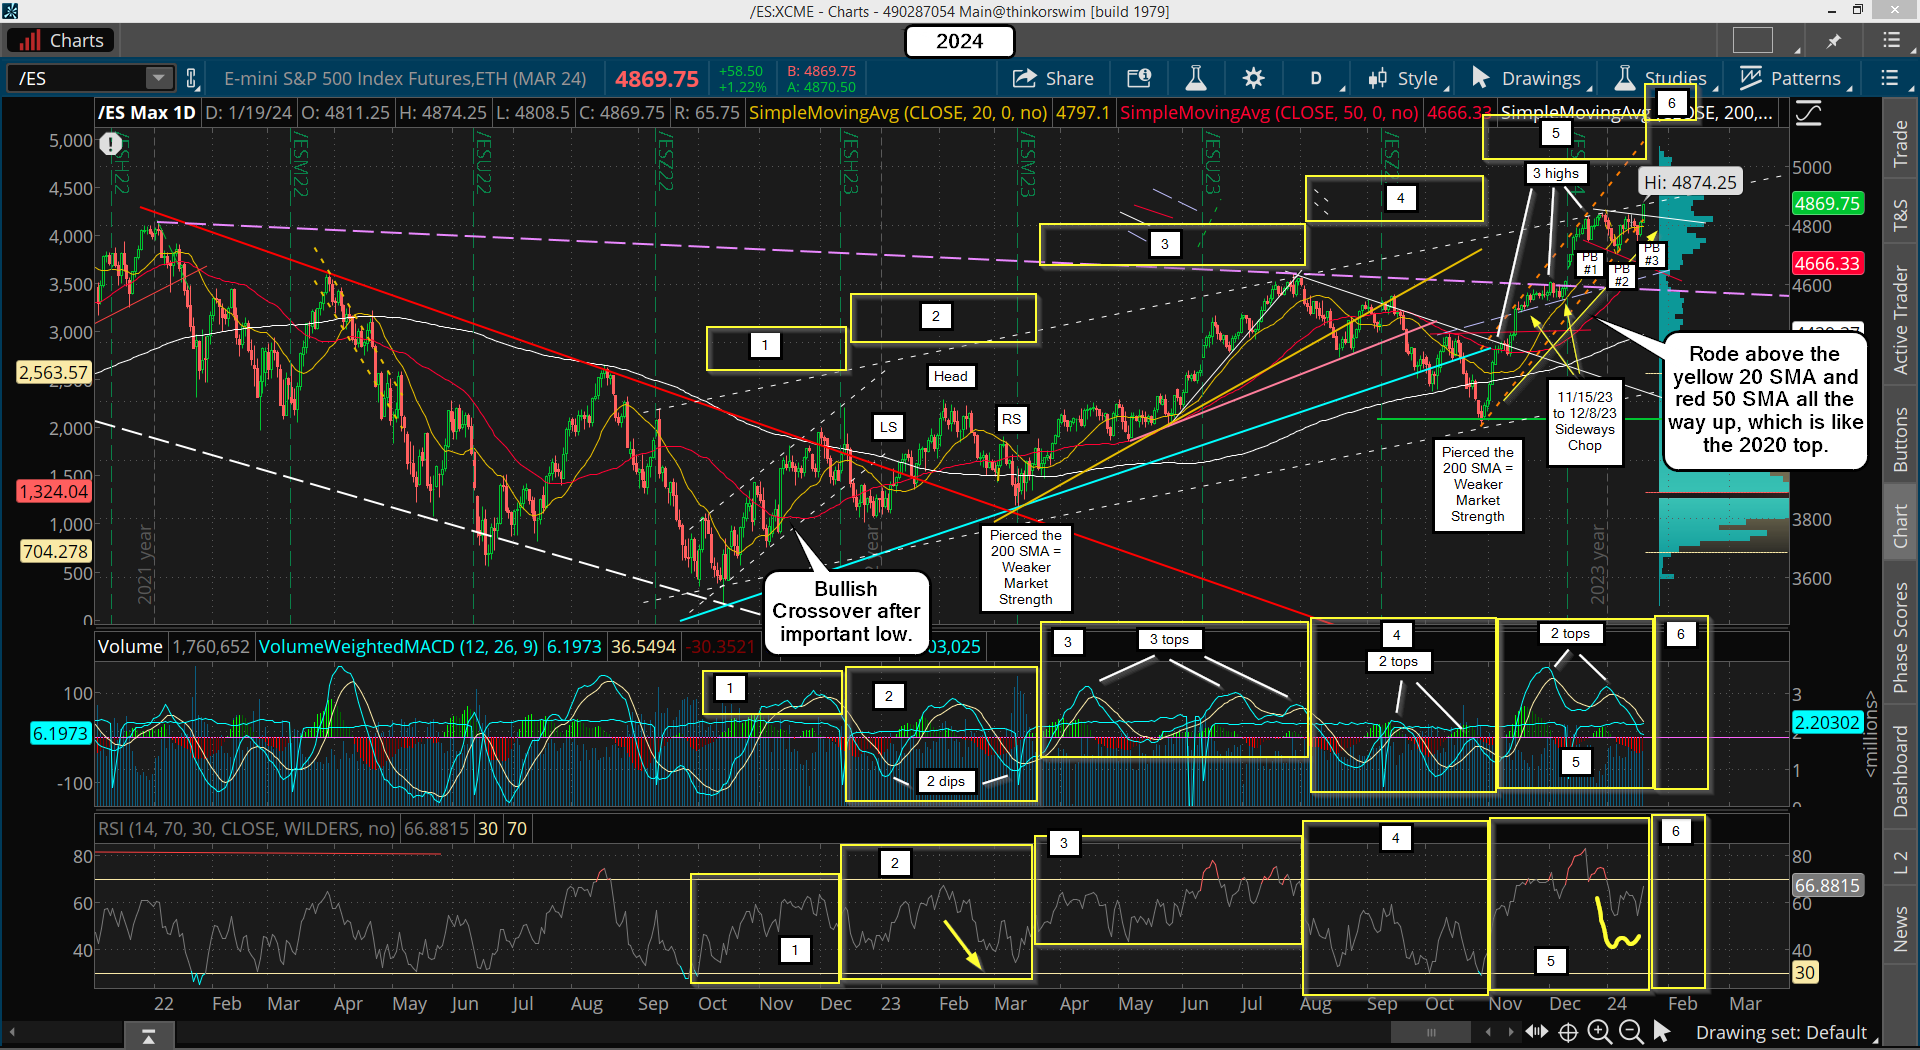
As you can see I have labeled all the periods of importance into 6 areas. I have labeled the MACD's and RSI made notes on some of it. If I would have done this analysis last month I would have figured out that the market wasn't ready for any large drop like I was calling for the past month. I would have seen that "point 5" needed to form and then "point 6", and when I was looking for that large drop at I would has figured out that we were just in the middle of "point 5". Below is the current chart for 2024 with the same labels.
The sideways chop from mid-November 2023 until December 8th was equal to the sideways chop from 11/8/21 to 11/21/21, but back then there was a pullback into 11/30/21 inside "point 5", (PB #1) followed by another push back up to the same spot again, and another drop from 12/16/21 to 12/20/21 (PB #2) for a "higher low", followed by a slightly higher high... and then one last pullback (PB #3) which ended "point 5"... and then a final rally for "point 6".
However, we didn't get that drop after December 8th 2023 (compared to the drop from 11/21/21 to 11/30/21) but instead rallied up to a new all time high. That should have told me that the first pullback wasn't going to happen from a double top sideways zone like 11/8/21 to 11/21/21, but instead will go higher and then do a pullback as the rally up from the October 27th 2023 low was not finished yet.
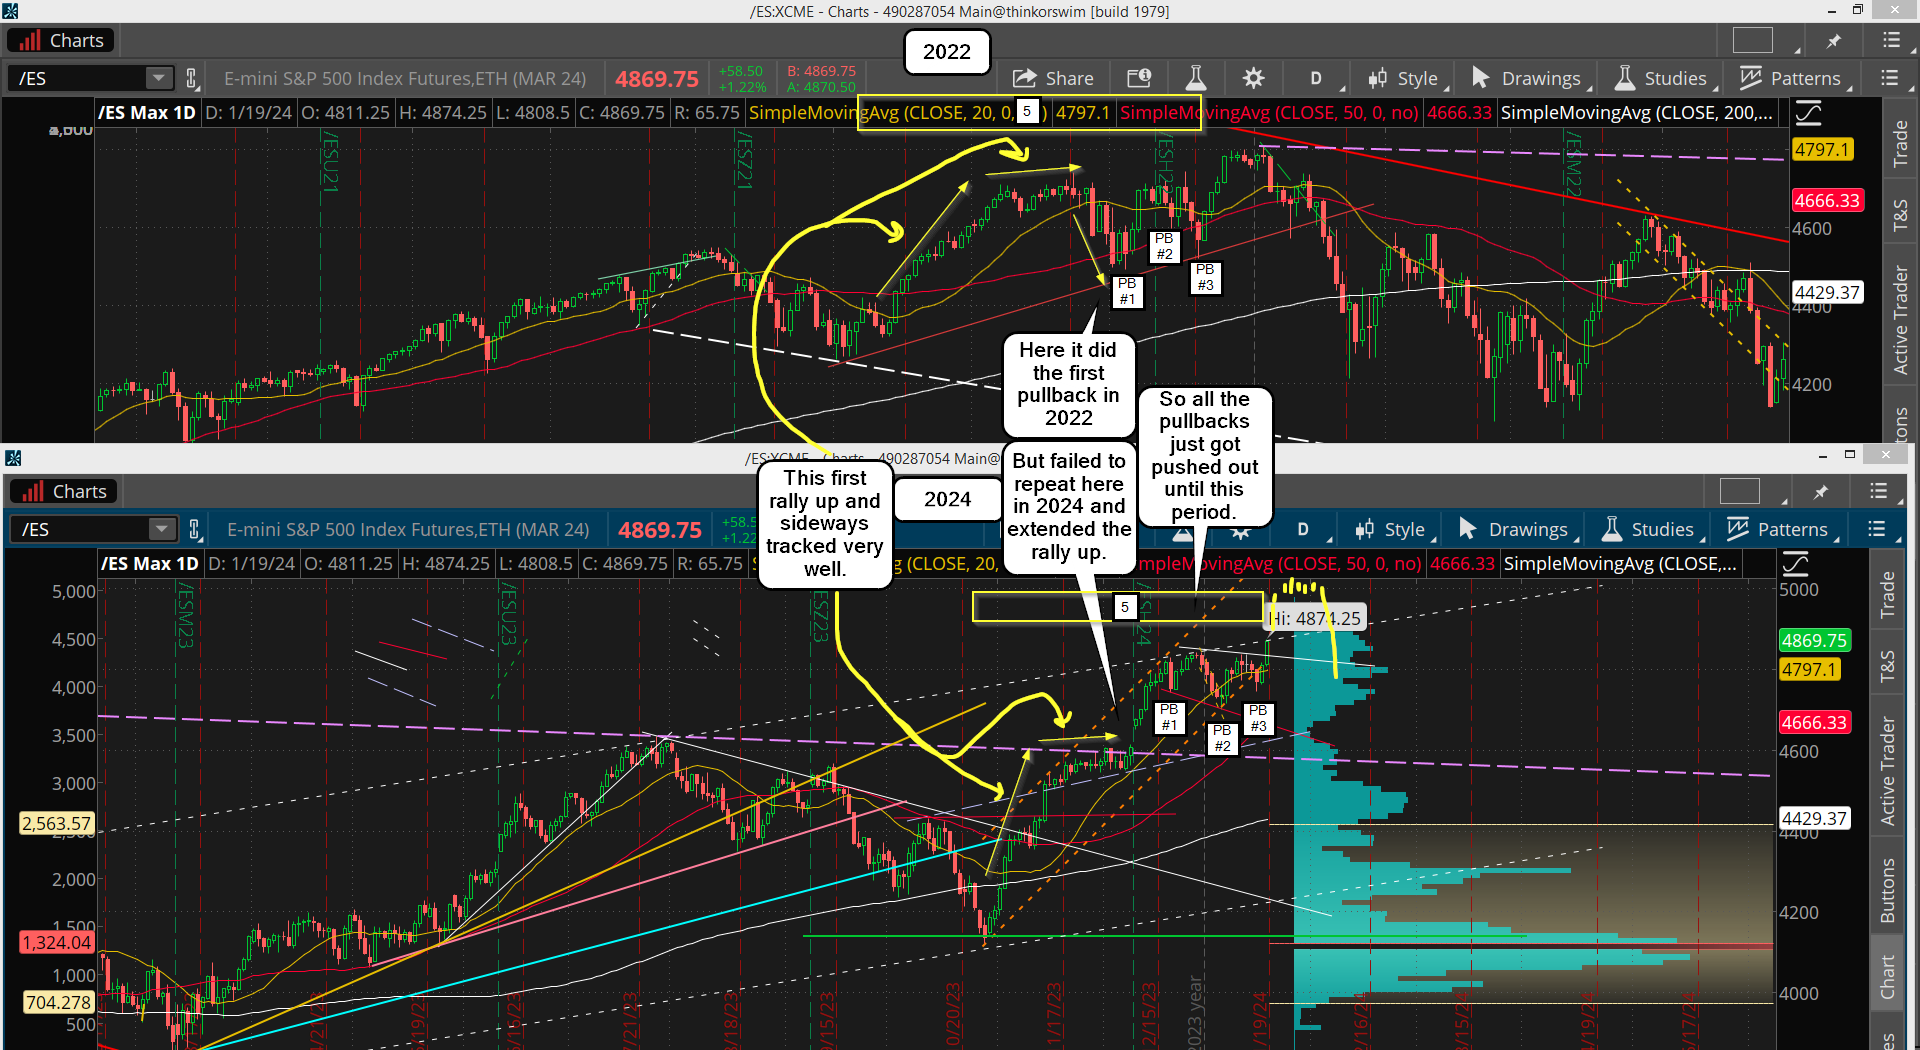
That pullback finally came on 12/20/23 (PB #1), but was just a "one day wonder"... which I have to list it as similar to 11/22/21 to 12/3/21, not in "time" of course, but it was the first move down after a strong rally up. That was followed another push back up to retest the resent high on 11/22/21, which put in a lower high on 12/13/21 before dropping lower the next day on 12/14/21 (PB #2), which I would compare to the 1/5/24 low.
Basically, pullbacks number 1 and 2 in both the 2022 chart and the 2024 chart "flipped" in "time" whereas in the 2022 chart PB #1 was a week or so in "time" and "PB #2" was just one day (12/14/21). On the 2024 chart the opposite happened as "PB #1" was one day (12/20/23) and "PB #2" was a week long.
The last pullback in "point 5" in 2021 (PB #3) was for a higher low (then PB #1), which would be the 1/11/24 to 1/17/24 drop. Obviously this isn't an exact match but the overall pattern is there... they just flip sometimes in "time" or depth.
This leaves one more push up for "point 6", which in 2021 it was another new all time high, and currently here in 2024 we are repeating that move as well. Now... back in 2021 it went sideways up at the top for about a week before rolling over and dropping, so that's possible again this time around.
It won't be an exact match but something similar. Maybe it climbs a little higher in a slow grind day by day this time instead of sideways? I don't know for certain, but this is why I also went back to the 2020 top and studied it... which is in the chart below.
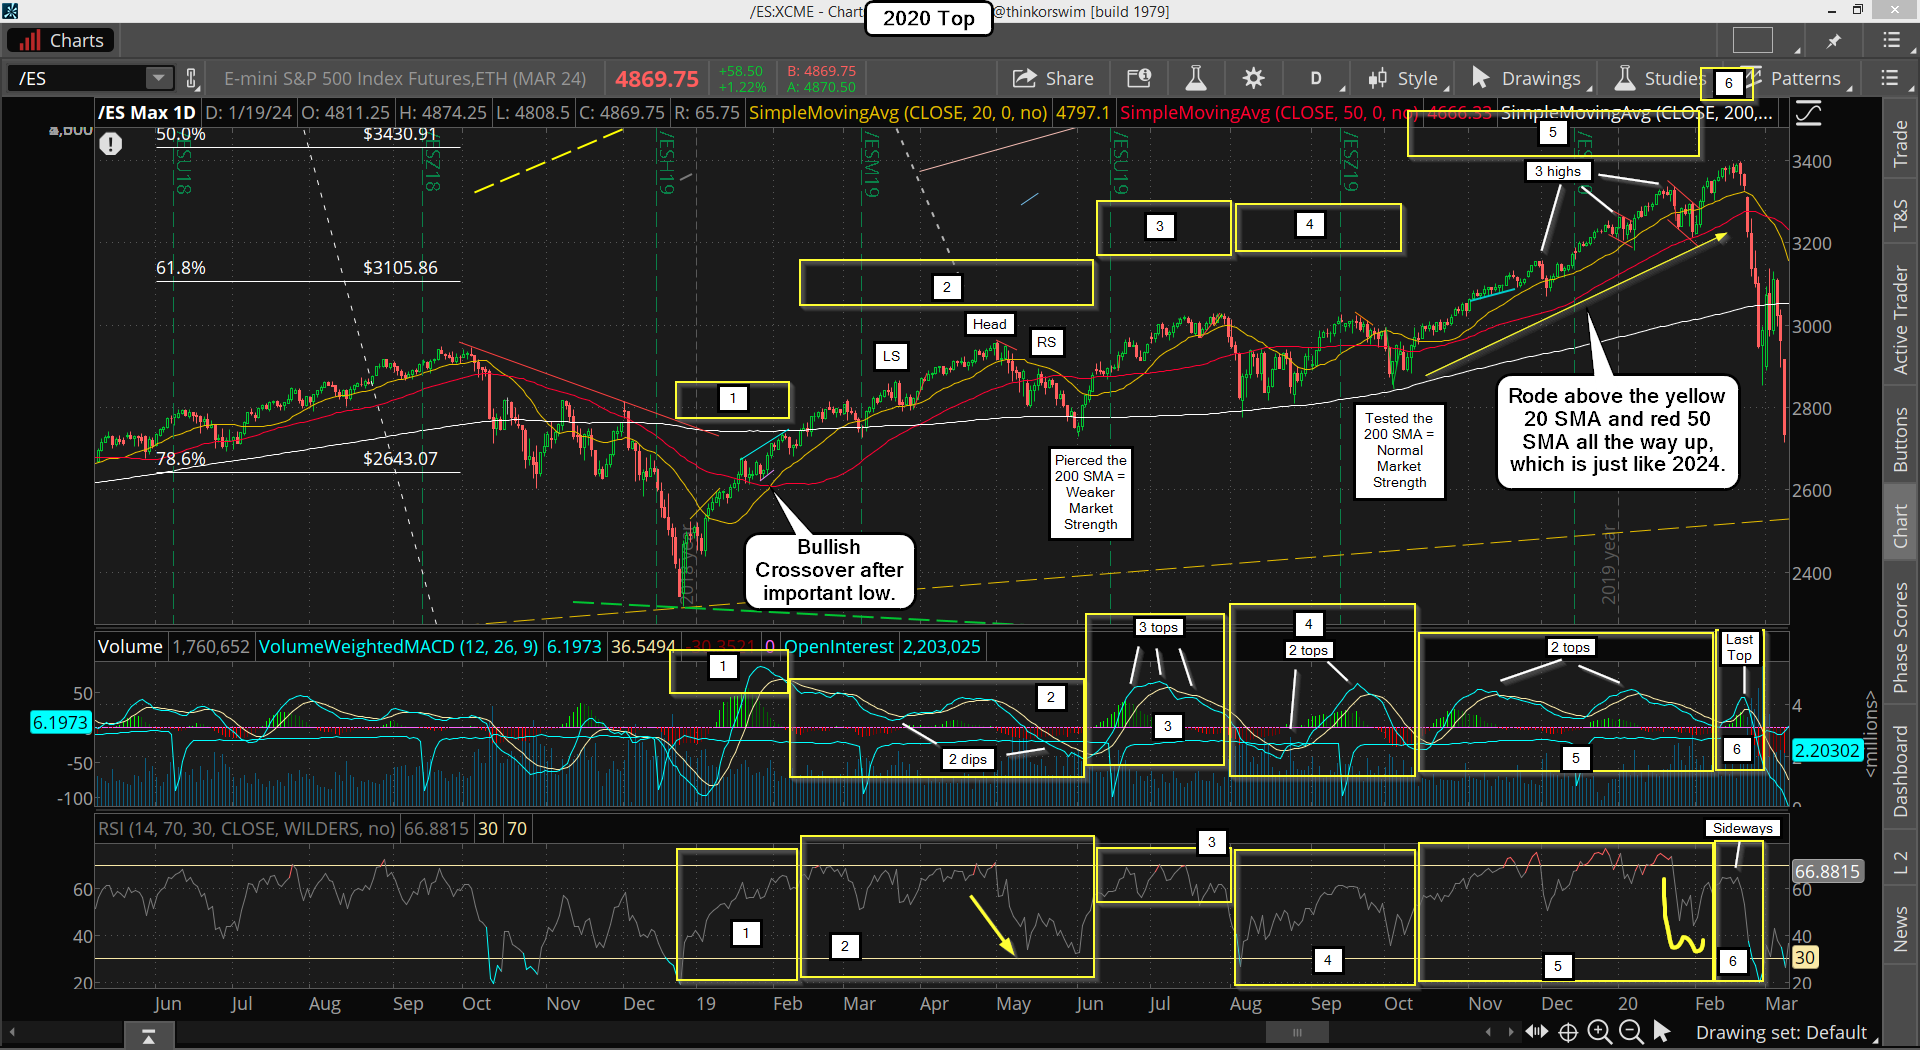
On this chart from 2020 you will notice that "point 5" is longer in "time" then in 2024, but many things are still similar. Like how the rally up rides on top of the 20 and 50 SMA (simple moving averages) and only touches the 50 (red line) at the end of "point 5" in 2020.
Today we haven't yet pulled back that deep to touch it but did pierce the 20 (yellow/gold) at the end of "point 5" on the 2024 chart. I could make the argument that we will have a pullback to touch the 50 SMA soon and then go up for one more higher for "point 6", which is what I'm going to label as "PB #3" and cover shorty.
Note that the MACD's tell another story as in 2020 there were "2 tops" on them inside "point 5" and we currently have "2 tops" completed in 2024, but again... nothing ever matches exactly.
No matter how you look at it we are missing the "Last Top" in "point 6" from 2020, and just looking at the MACD right now it could take 1-2 weeks to "hook it back up" to where we could see a crossover that makes a lower MACD top.
On the 2022 chart there was only "1 top" for "point 5", so a slight difference from it compared to 2020 and 2024. I do not know how this will unfold as both the 2020 and 2022 charts are very similar to 2024, and both suggest we will need 1-2 weeks to finish "point 6" (or the last pullback of "point 5" on the 2020 chart if I'm wrong on that section being completed?).
Let's go over that now. On the 2020 chart there was a good pullback for 2 days (1/24/20-1/27/20) and then another good one on 1/31/20, which are "PB #1 and 2". Therefore I have to adapt (just like I did with PB #1 and 2 on the 2022 and 2024) and label the "one day wonder" pullback on 2/7/20 into 2/10/20 as "PB #3", and say that it's the opposite of the same move on 12/20/23, which was "PB #1" there.
Again, it's flipped around some as back in 2020 the high before "PB #1" was lower then the high before "PB #3" and in 2024 the high before "PB #1" was higher then the high before "PB #3". Back then, from the 2/10/20 low for "PB #3" the market topped in 10 days on 2/20/20... so will this repeat and top in 10 days from the 1/17/24 low?
On the 2022 chart it topped 14 days after the low, which would be January 31st, 2024. A lot of things to watch closely in the next 1-2 weeks as both prior patterns suggest we will top out very soon and complete "point 6".
I'll be very focused on seeing if the MACD curls up and gives me a lower peak (I'd want to see them crossover, even if for only a day). And I'll be looking at the RSI to see if it has a similar pattern form compared to "point 5 and 6" on both the 2020 and 2022 chart.
In the end it will be just a "best guess" as there's no perfect repeat of anything in the past, but many times it does "rhyme", and I think one of these prior years will be repeated.
Conclusion: Bulls want to hold the recent low of 4746 from last Wednesday and go up or sideways the rest of the week for either of my comparisons of the past to play out. Basically they keep at tight range to form a similar pattern as previously.
If 4746 is lost there's a big risk that the high is "in" and we are starting the down move early (compared to what 2020 and 2022 suggest). If 4702 is lost (from Friday the 5th) then I'd say there's a 99% chance the high is "in". Once support is lost it should drop hard and fast and look like a mini-crash.
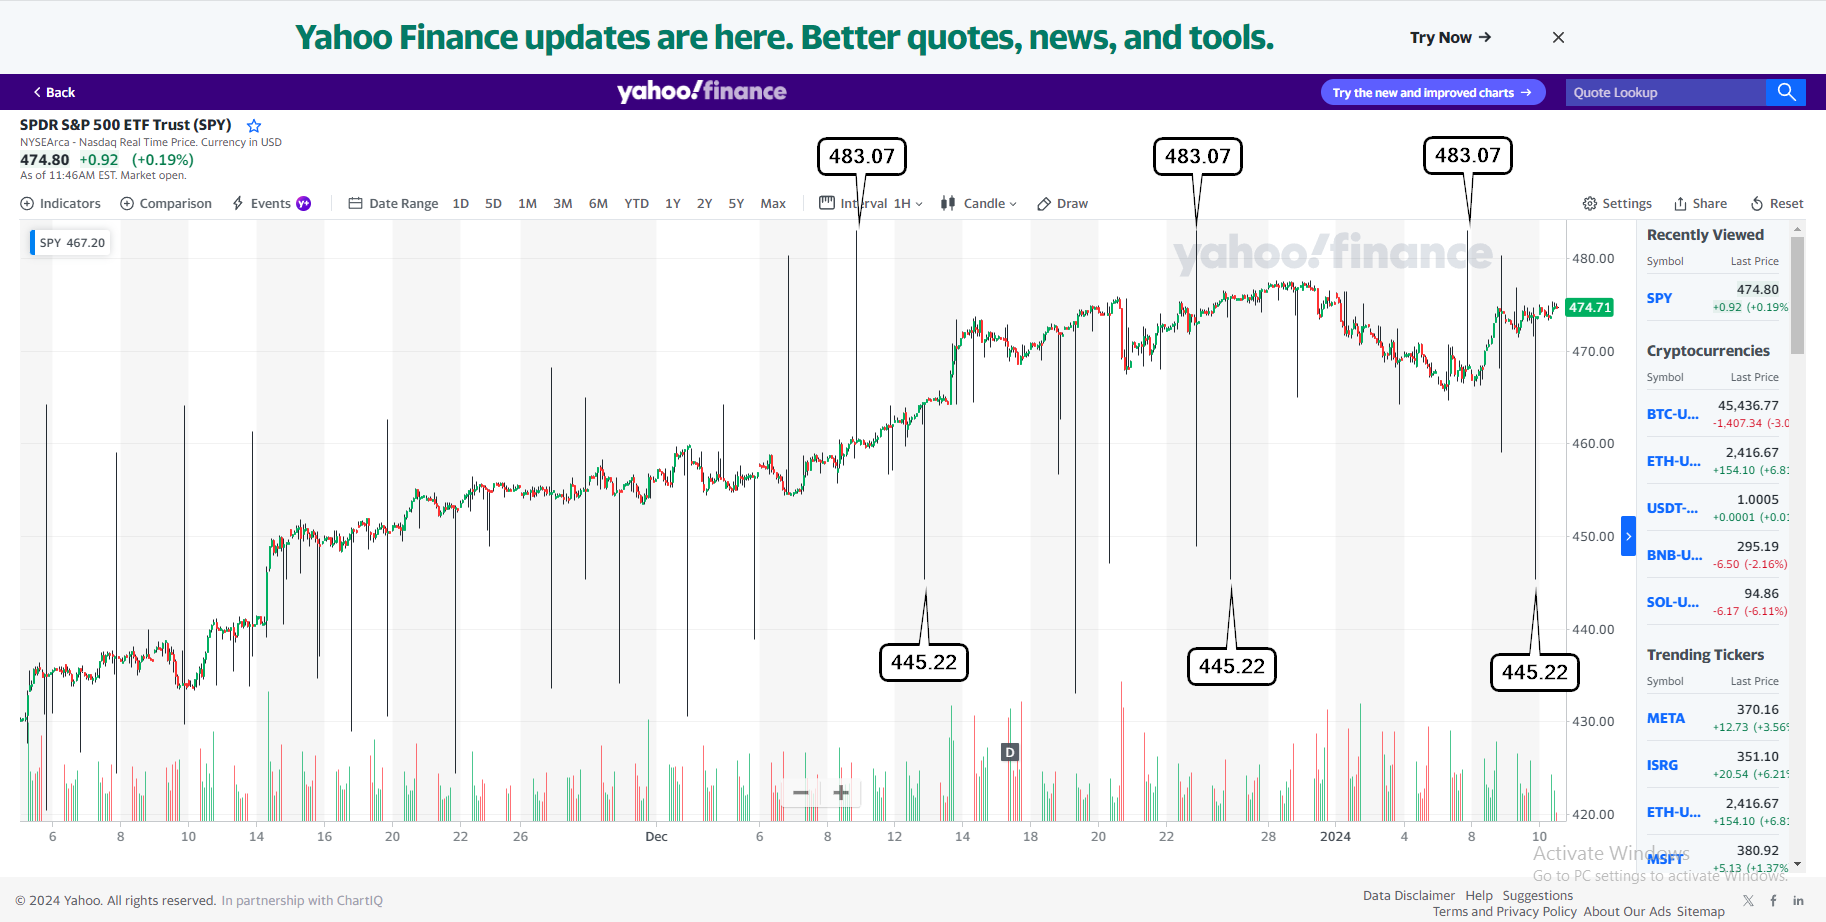
Lest we not forgot...
The Yahoo site with all the FP's on it, that I usually ignore, has almost come true this time (on the upside at least), for we hit 482.72 on Friday and the triple fake prints on this chart are for 483.07... will the 445.22 FP's be next?
Have a blessed day.

