

Incredible move on Friday, and we almost hit the 5000 level. It's still coming and probably a whole lot more. While I think we'll see a top between 5050-5100 this week, where a nice pullback happens, I have no idea how deep it will be? Going into mid-February the market is quite bullish on the Seasonality chart, so the pullback could be brief again, just like last week only had some of Tuesday and all of Wednesday down.
This rally has legs for sure and is going higher then I expected, but I'm just going to keep following it up until I see some real signs of a top. Right now I don't see that, but only see resistance in the 5050-5100 zone. The pullback after that area is hit might be just a few hundred points and then back up again.
Remember that there's still no negative divergence on the weekly chart like I had hope would form, but instead it was canceled. Yes, it's still there from the 2018 high and the 2020 top, but that's longer term and isn't accurate enough for the coming weeks ahead. We need to see a top on the RSI here soon, and then the market go higher while the RSI goes lower, and that's just not here yet. Look at the weekly chart below...
Weekly Chart
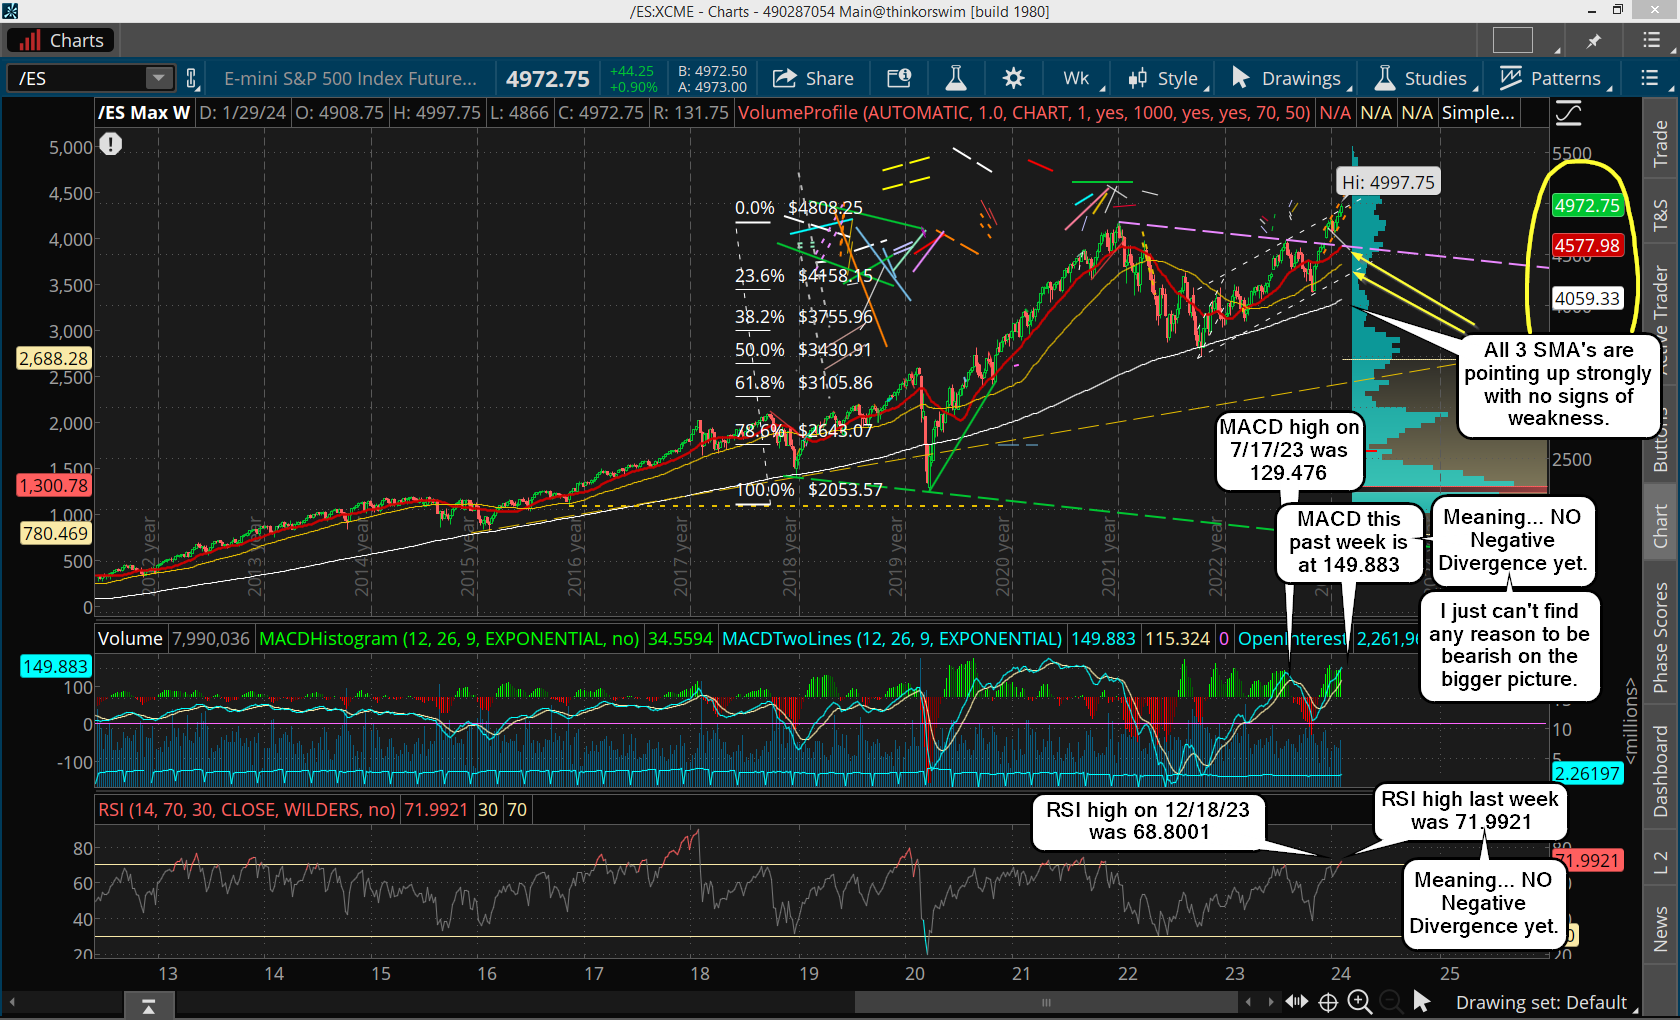
The RSI went up higher then the previous high the second week of December last year. And the MACD's are still pointing up strongly too, with no weakness in sight. While I still think we can see a short term top soon, the final high could be many weeks away, or even months (but I doubt too many). From what I'm seeing this could continue into March easily, and possibly April. It's unknown right now but I can't get super bearish here as there's nothing but bullish strength still on the weekly chart. And the monthly is also bullish as shown below...
Monthly Chart
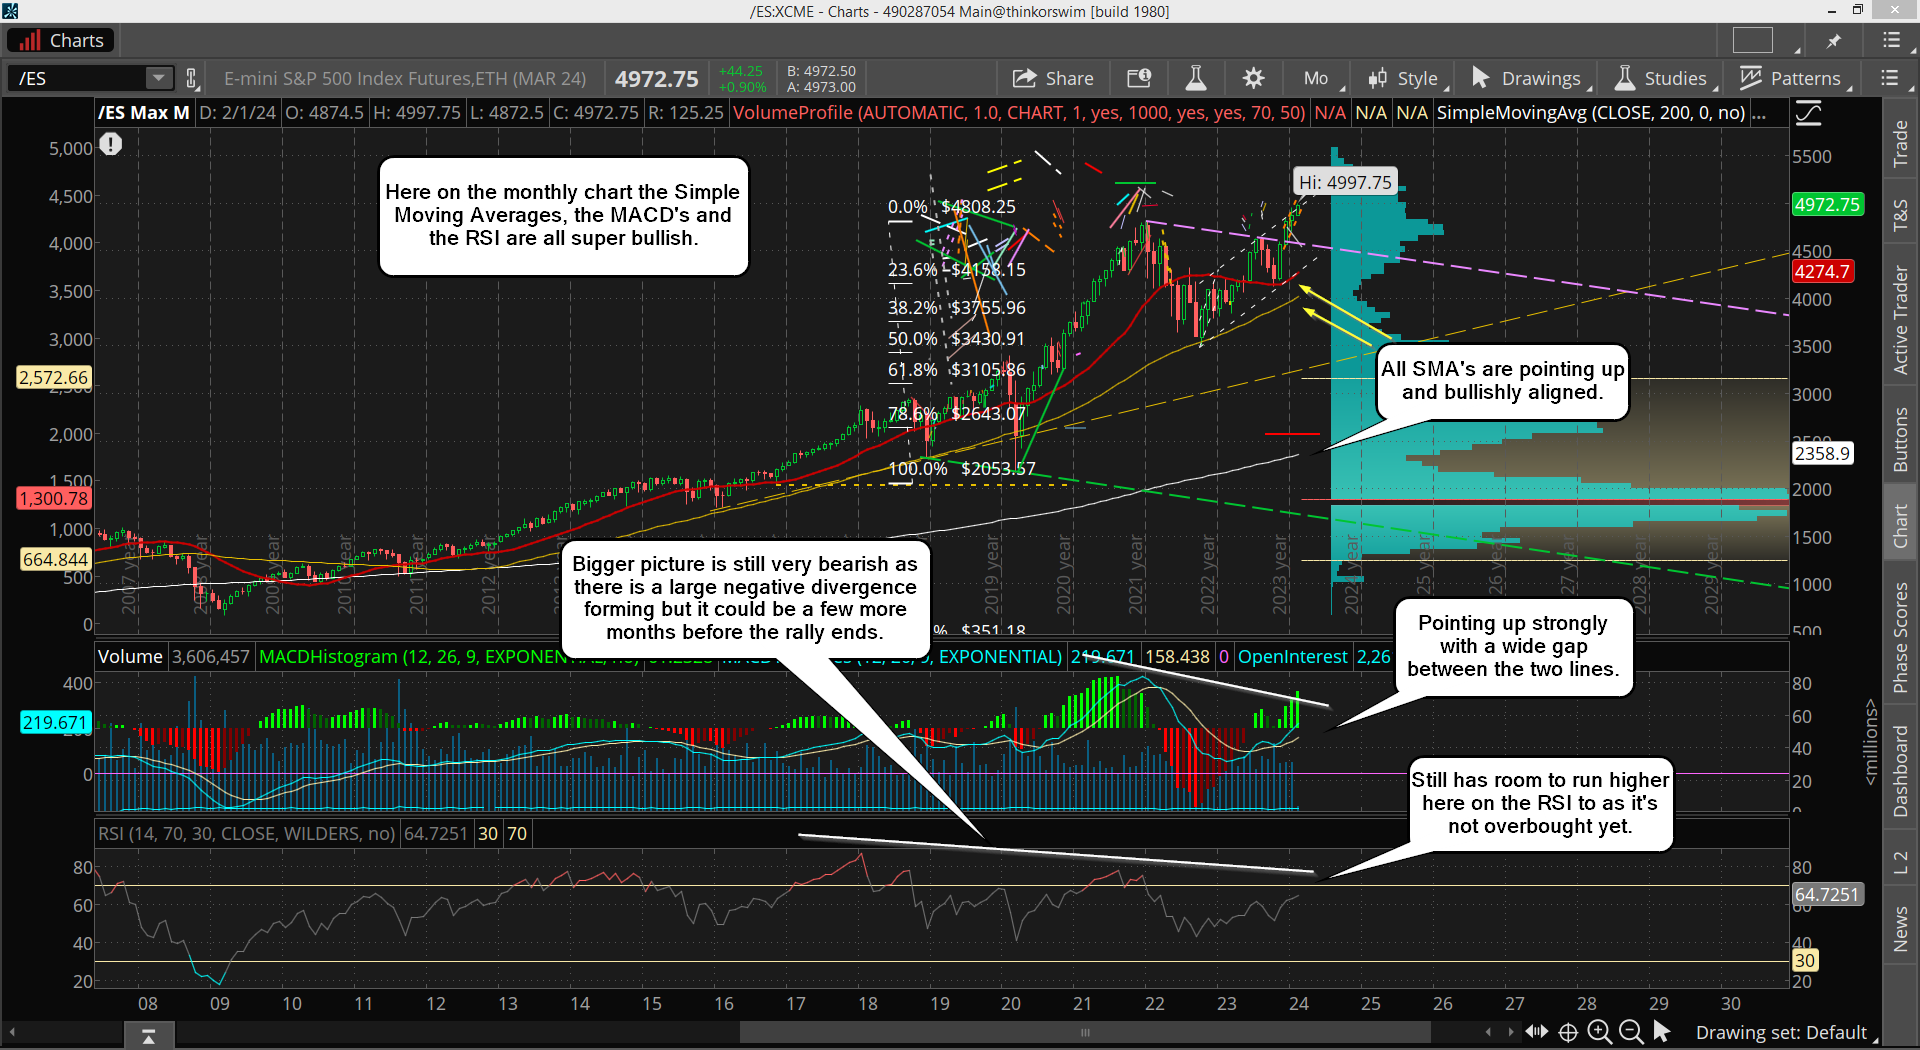
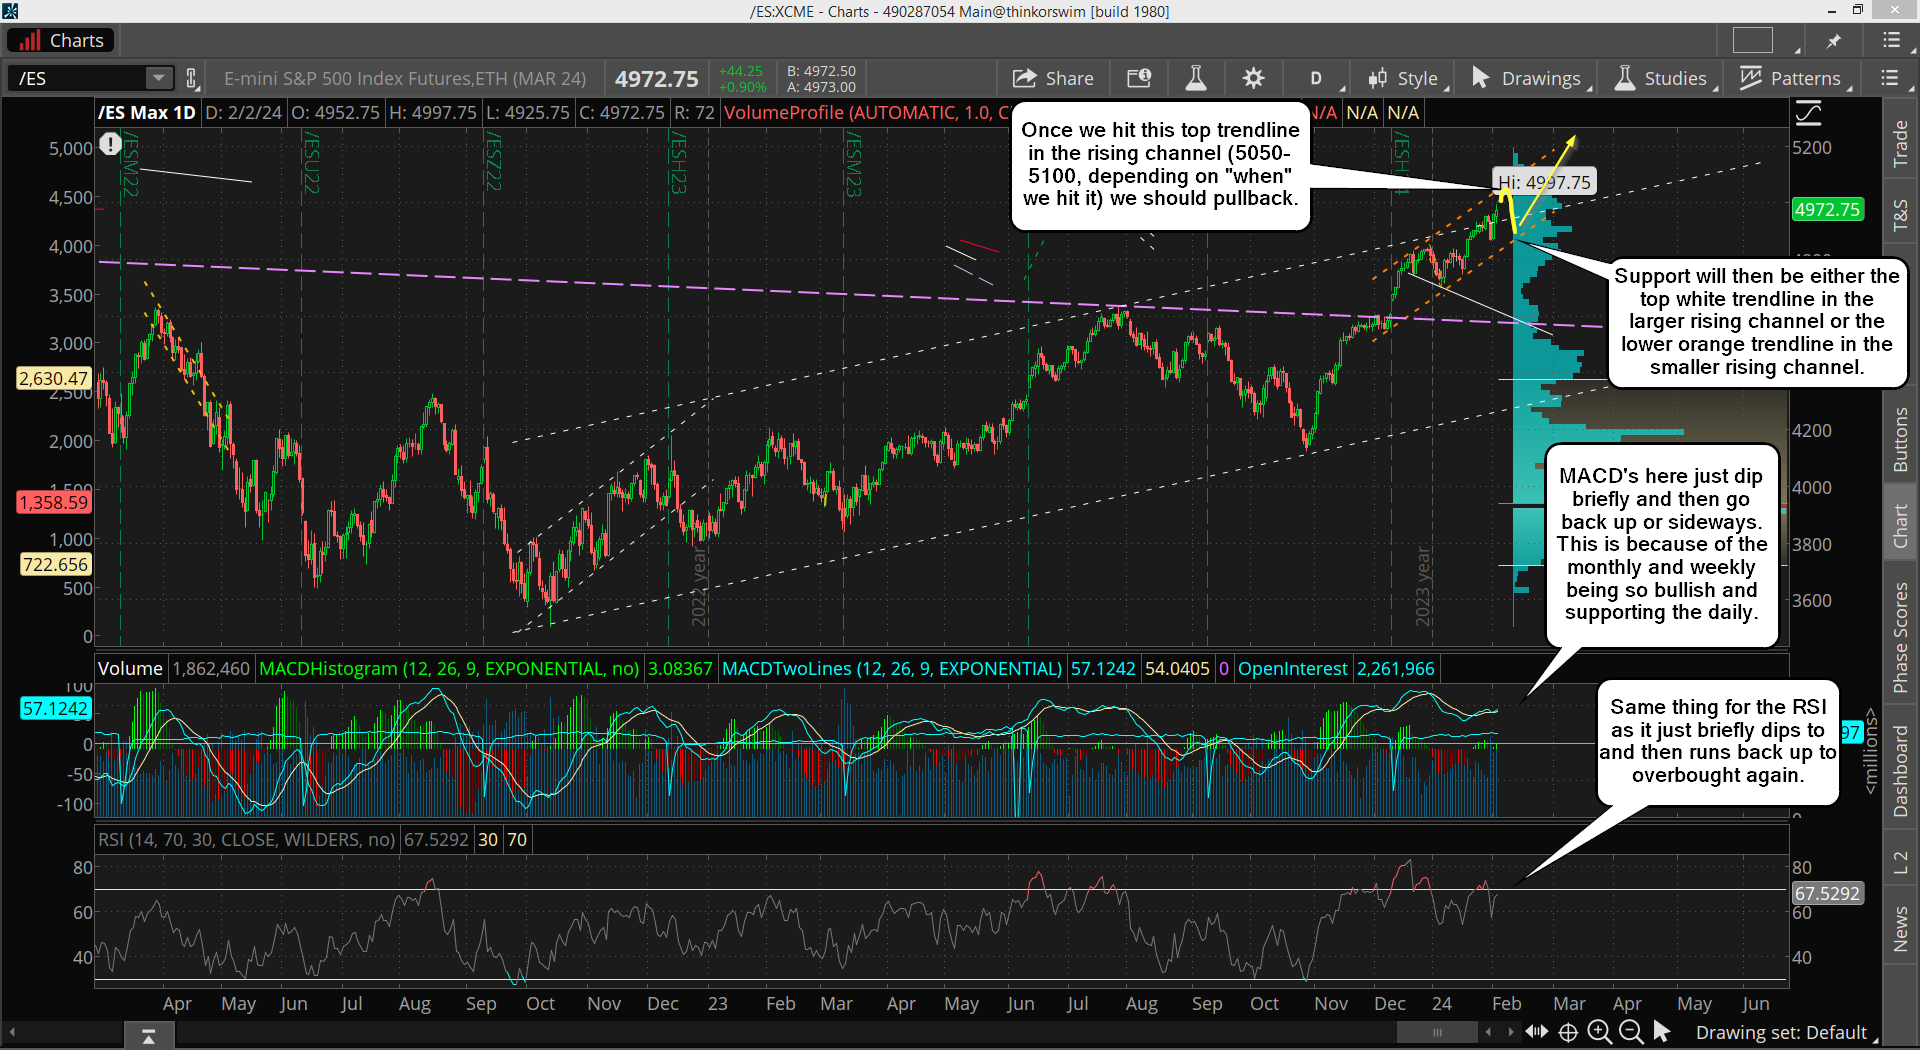
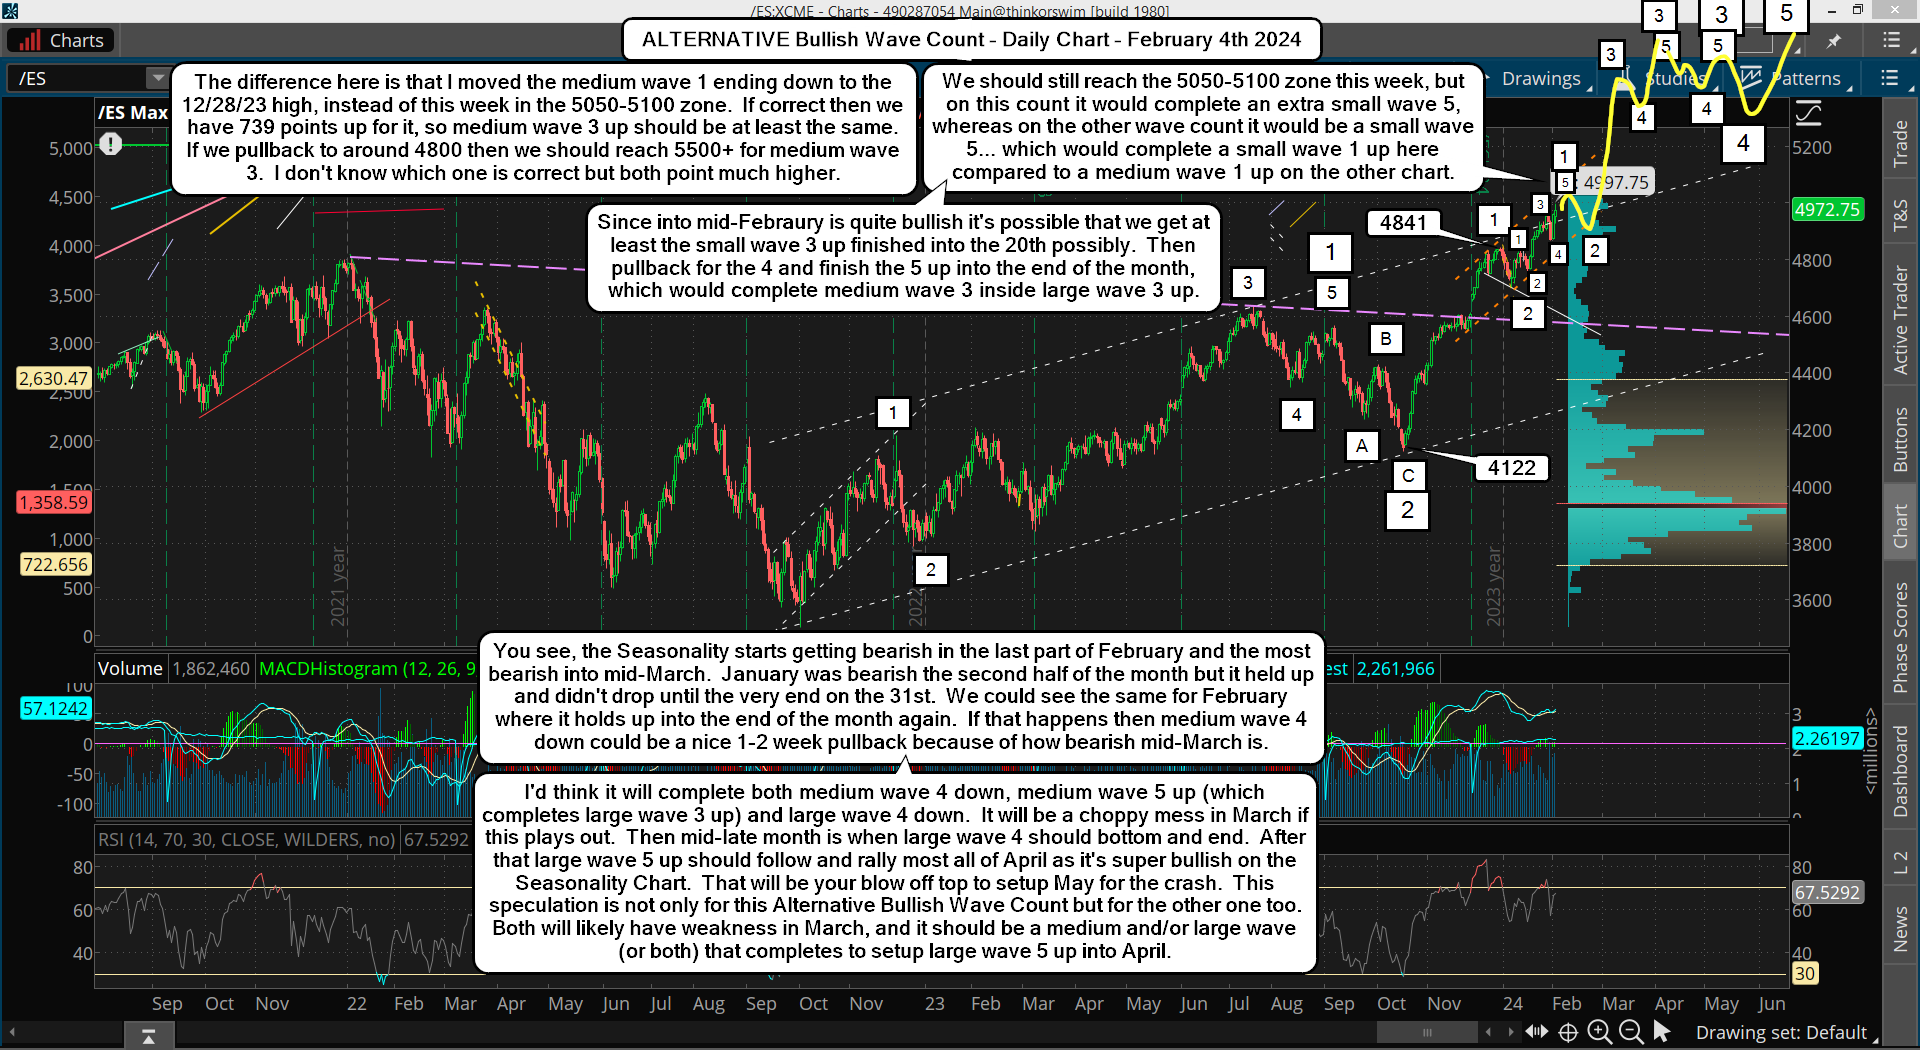
The daily is very overbought... sure, but if the weekly and monthly are bullish then the pullbacks from the super hot daily will be short lived. I'd love to see a multi-week drop but that's just not showing up as likely in the technicals right now. I only see short lived pullbacks. Looking at the daily chart I can see that after we get that last spike to 5050-5100 we should have a fast drop to "cool off" the RSI and MACD some.
Daily Chart
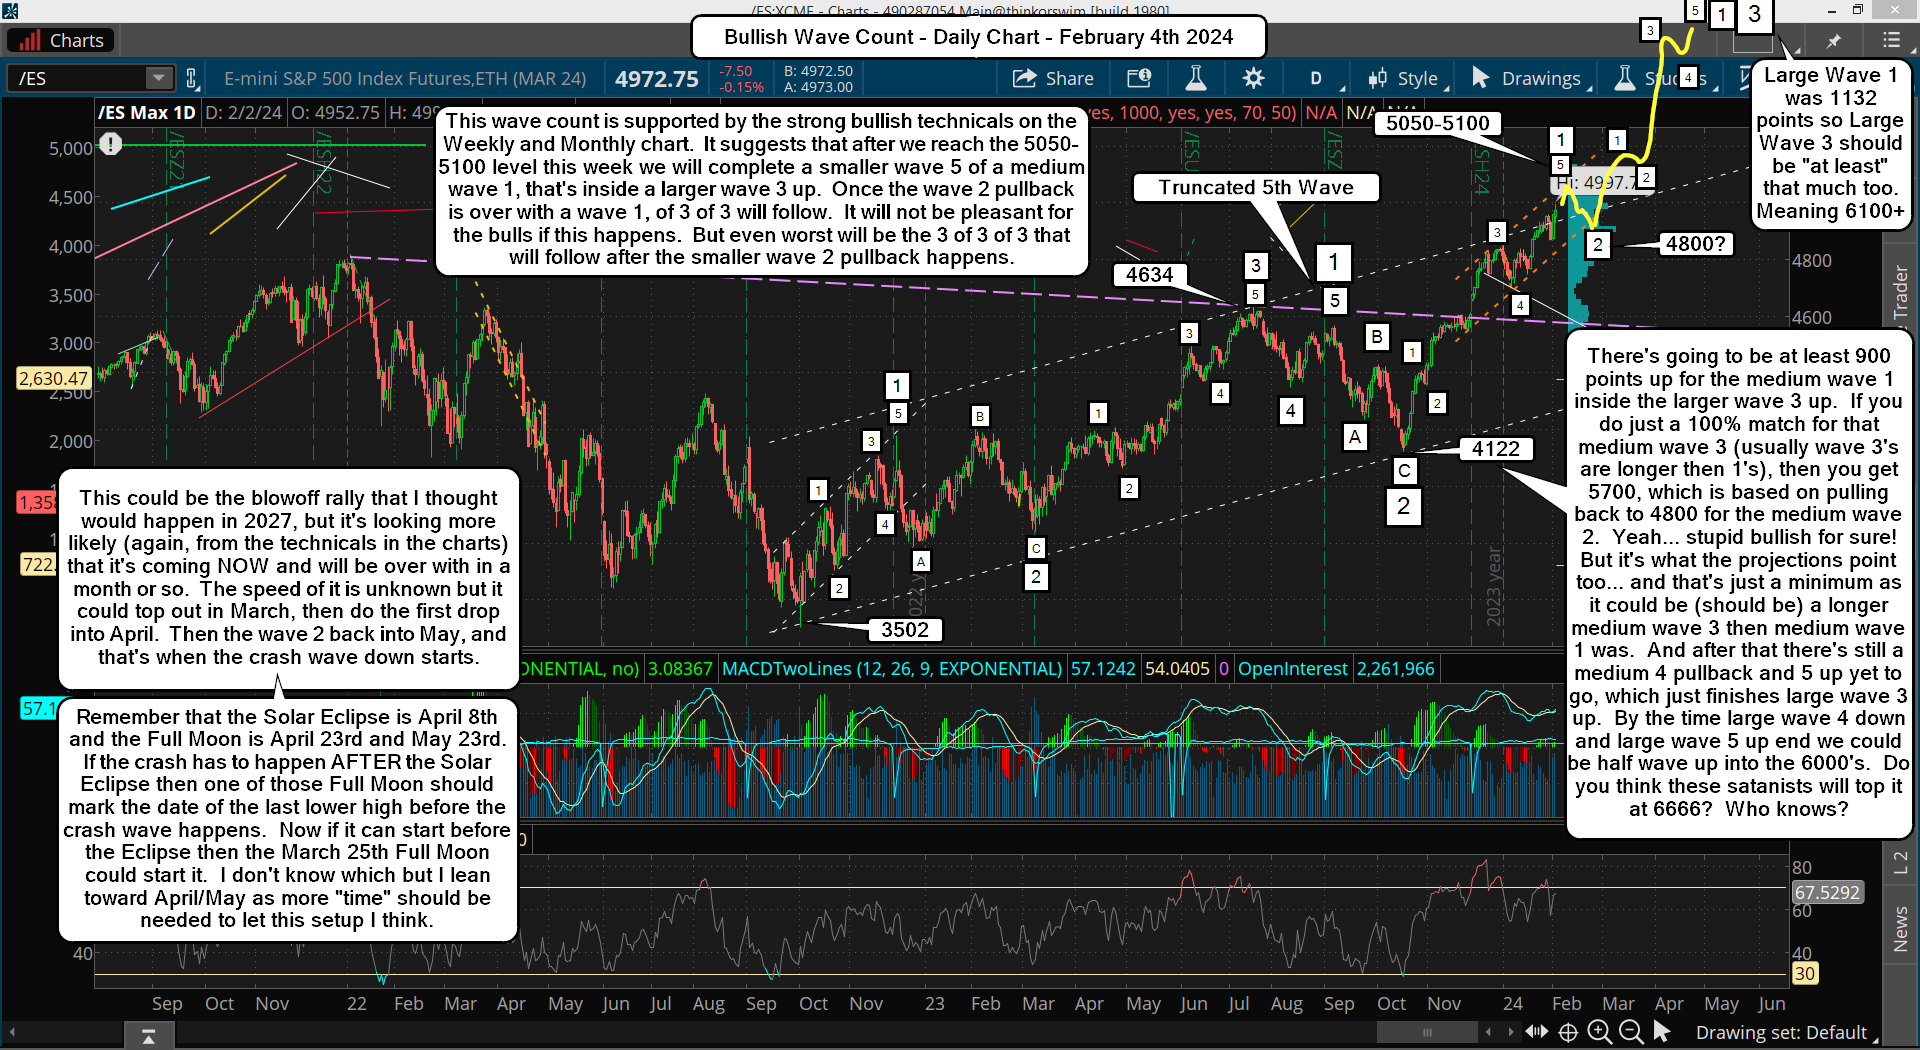
I'm going to have to look at the bullish wave count now as all the technicals tell me this market is NOT ready to crash and is going up much higher in a blow off top. I can't just draw what I "want to happen" but MUST draw what the technicals tell me, and they are still quite bullish on the higher time frames.
I mean, how can I just ignore the obvious? All the moving averages (the 20, 50 and 200) are aligned very bullish on the monthly and weekly chart with zero signs of turning bearish. So I have to ignore the bearish noise out there and just let the technicals speak to me. They say that this market is going up higher, and a higher by a lot more. We could be in a larger degree wave 3 up right now, and no one see's it until it's over with. Below is the bullish wave count I'm talking about...
Main Wave Count
Alternative Wave Count
Now I am not an uber bull, and I'd really consider myself more of a bear if I had to label myself anything. But this is what the wave count suggests, and the technicals back it up. Plus you have that interview that Steve Bannon did with a hedge guy that said that the Demoncrats are likely pumping money from the Treasury into the Stock Market to try and make Pedo Joe look good.
He also said that smart money is front run the election as they think Trump will win, and that's another reason that we see the market keep going up and up and up. It all lines up now to having the mega blow off top this year and the crash too. A friend of mine gave me the chart below a few years ago..
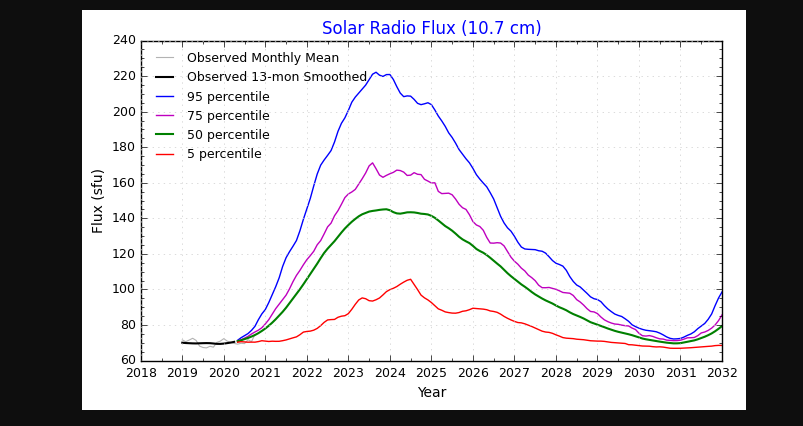
I had forgot about it but just remembered it this weekend and went back and looked at it again. The thing to note is that the last time the chart looked like this was in 1929... meaning the extremely high peaks on it have not been seen in the last 95 years. Now make of that what you will but it sure is something you want to put in the back of your mind.
Last, don't forget about the Presidential Cycle. As one president leaves and another one comes in, which should be Trump, the stock market dumps and history shows you over and over that this pattern repeats. You can look back at the prior post I did about it here...
https://reddragonleo.com/2023/10/14/the-presidential-cycle-says-no-new-high-this-year/
Biden is leaving, no matter what. If the Demoncrats succeed in cheating again and install someone else (Gavin Newsom, Micheal Robinson [aka Michelle Obama], or even Nikki Haley) it will still be a new president. Every time a president in office leaves the market tanks. And Pedo Joe is not getting a second term... everyone knows that. So after this last mega rally you can count on a mega crash following it.
Clearly I was wrong on the drop to 3000 on that prior post on it, but the information about the cycle is still correct. Back then I just thought we would make that lower low first and then rally up into 2026-2027 for the final high. That's changed now as they have sped it up to make it happen this year.
I wouldn't be surprised if they try to delay the election because of the crash... who knows? But all the technicals point to a massive final rally up first (the next few months) and then a great depression crash to follow.
Have a blessed day.

